Please cite this article as: ZHANG ZY, WANG XY, HOU CC, LIU HB, LYU L, CHEN ML, XU XR, JIANG F, LI L, LI WM, LI KB, WANG J. Multiple biomarkers risk score for accurately predicting the long-term prognosis of patients with acute coronary syndrome. J Geriatr Cardiol 2025; 22(5): E1−E12. DOI: 10.26599/1671-5411.2025.07.001.
Citation:
Please cite this article as: ZHANG ZY, WANG XY, HOU CC, LIU HB, LYU L, CHEN ML, XU XR, JIANG F, LI L, LI WM, LI KB, WANG J. Multiple biomarkers risk score for accurately predicting the long-term prognosis of patients with acute coronary syndrome. J Geriatr Cardiol 2025; 22(5): E1−E12. DOI: 10.26599/1671-5411.2025.07.001.
Please cite this article as: ZHANG ZY, WANG XY, HOU CC, LIU HB, LYU L, CHEN ML, XU XR, JIANG F, LI L, LI WM, LI KB, WANG J. Multiple biomarkers risk score for accurately predicting the long-term prognosis of patients with acute coronary syndrome. J Geriatr Cardiol 2025; 22(5): E1−E12. DOI: 10.26599/1671-5411.2025.07.001.
Citation:
Please cite this article as: ZHANG ZY, WANG XY, HOU CC, LIU HB, LYU L, CHEN ML, XU XR, JIANG F, LI L, LI WM, LI KB, WANG J. Multiple biomarkers risk score for accurately predicting the long-term prognosis of patients with acute coronary syndrome. J Geriatr Cardiol 2025; 22(5): E1−E12. DOI: 10.26599/1671-5411.2025.07.001.
Heart-center of Beijing Chao-Yang hospital, Capital Medical University, Beijing Key Laboratory of Hypertension, Beijing, China
2.
Department of Cardiology, the Second Medical Center, National Clinical Research Center for Geriatric Diseases, Chinese PLA General Hospital, Beijing, China
3.
Department of Cardiology, Chui Yang Liu Hospital, Tsinghua University, Beijing, China
Funds:
The research reported in this publication was funded, in part, by the National Natural Science Fund (NSFC, China) under award number 81900382. This research was also supported, in part, by the Yang talents Program of Beijing (QML20200302) and Beijing Municipal Natural Science Foundation (7222072).
Biomarkers-based prediction of long-term risk of acute coronary syndrome (ACS) is scarce. We aim to develop a risk score integrating clinical routine information (C) and plasma biomarkers (B) for predicting long-term risk of ACS patients.
Methods
We included 2729 ACS patients from the OCEA (Observation of cardiovascular events in ACS patients). The earlier admitted 1910 patients were enrolled as development cohort; and the subsequently admitted 819 subjects were treated as validation cohort. We investigated 10-year risk of cardiovascular (CV) death, myocardial infarction (MI) and all cause death in these patients. Potential variables contributing to risk of clinical events were assessed using Cox regression models and a score was derived using main part of these variables.
Results
During 16,110 person-years of follow-up, there were 238 CV death/MI in the development cohort. The 7 most important predictors including in the final model were NT-proBNP, D-dimer, GDF-15, peripheral artery disease (PAD), Fibrinogen, ST-segment elevated MI (STEMI), left ventricular ejection fraction (LVEF), termed as CB-ACS score. C-index of the score for predication of cardiovascular events was 0.79 (95% CI: 0.76−0.82) in development cohort and 0.77 (95% CI: 0.76−0.78) in the validation cohort (5,832 person-years of follow-up), which outperformed GRACE 2.0 and ABC-ACS risk score. The CB-ACS score was also well calibrated in development and validation cohort (Greenwood-Nam-D'Agostino: P = 0.70 and P = 0.07, respectively).
Conclusions
CB-ACS risk score provides a useful tool for long-term prediction of CV events in patients with ACS. This model outperforms GRACE 2.0 and ABC-ACS ischemic risk score.
Acute coronary syndromes (ACS) are the major thrombotic complication of atherosclerotic cardiovascular disease (ASCVD) in worldwide.[1] Although several medical and interventional advances have improved outcomes in patients with ACS, the risk of mortality remains higher (about 5% within a year after a diagnosis of ACS). Over the last ten years it has become clear that people with ACS of all sorts including ST-segment elevation myocardial infarction (STEMI) and NSTE-ACS have quite widely varying outcomes, and much work has gone into defining the clinical components which individually predict this poor outcome.[2] There are exigent need to identify high risk patients who would derive the most benefit from a more aggressive secondary prevention strategy in ACS. [3-5] Furthermore, enhanced precision in risk stratification is imperative for identifying patients eligible for shortening or de-escalating dual antiplatelet therapy. The precise risk score could enhance clinical outcomes through the preservation of efficacy while mitigating bleeding events, thus optimizing the balance between ischemic and bleeding events in ACS patients.[6]
Accurate prediction of thrombosis events in ACS patients is useful in identifying high-risk patients. Scoring systems have been established and proposed by some guidelines to facilitate risk stratification among ACS patients, with recent trials of drugs, and interventions such as coronary angiography and revascularization.[7,8] Early examples, such as the TIMI (Thrombolysis In Myocardial Infarction), the GRACE (Global Registry of Acute Coronary Events) and later GRACE 2.0 score,[9-11] provided short-term risk stratification to aid with decision making at the time of primary ACS presentation for an early invasive approach. However, they are primarily developed to guide health care providers about early therapeutic strategies at presentation. Recently novel biomarkers have been shown to provide prognostic value in patients with ACS.[12,13] The ABC-ACS score, includes 8 items for cardiovascular (CV) risk prediction: age (A), biomarkers (B) [growth differentiation factor 15 (GDF-15), N-termina pro–B-type natriuretic peptide (NT-pro-BNP) and clinical history (C) [extent of coronary artery disease (CAD), prior vascular disease, Killip class, ACS type, P2Y12 inhibitor] for the 1-year risk of CV death and MI among ACS patients undergoing PCI. The authors chose these 8 variables that closely approximated a larger, more inclusive model without significant loss of discriminatory value. Nonetheless, the rigorously selected trial populations would make the score difficult to generalize. Moreover, existing ACS score only provides short-term prediction for ACS patients. Therefore, it is imperative to establish risk stratification tools to serve as decision support for treatment approaches in patients with ACS, irrespective of PCI treatment. Beyond conventional risk factors, risk assessments should encompass additional variables, including inflammation and coagulation risk factors closely associated with ACS pathophysiology.[14-15] Furthermore, there is a pressing need for long-term prognostic tools tailored to ACS patients. Against this backdrop, our objective is to devise a comprehensive risk scoring system that integrates routine clinical risk factors, and a wider array of plasma biomarkers, particularly focusing on coagulation parameters, to accurately forecast the long-term cardiovascular event risk in ACS patients, whether they undergo PCI or not.
METHODS
Study Populations
The observation of cardiovascular events in angina pectoris patients (OCEA) was a prospective observational study, aimed at establishing a risk stratification system for patients with CAD. Details concerning the study’s design and primary outcomes of OCEA have been published in previous studies,[16-19] which are available in supplementary material. In brief, total 5936 patients of the OCEA study were consecutively collected in Cardiovascular Department of Chinese People's Liberation Army (PLA) general hospital during the period from 2010 to 2015. Baseline characteristics of OCEA patients were meticulously gathered and recorded. Furthermore, all patients underwent coronary angiography at Chinese People's Liberation Army (PLA) general hospital. Of these, 2729 ACS patients including unstable angina pectoris or AMI with available biomarkers were enrolled into the study. Based on admission date, the earlier admitted patients (September 2010 to September 2013; n =1910) were enrolled as train cohort; and the subsequently admitted subjects (October 2013 to May 2015; n =819) were treated as validation cohort. Regular outpatient visits and telephone interviews were conducted for participants of the OCEA study (supplementary Figure 1). The OCEA study was performed in accordance with the Declaration of Helsinki and Good Clinical Practice norms on medical research in humans. The study protocol was approved by ethics committee of Chinese PLA general hospital before starting enrollment. All participants gave their written informed consent prior to inclusion.
Clinical Laboratory Analyses
Total cholesterol (TC), high-density lipoprotein (HDL) cholesterol, triglyceride (TG), and glucose levels were determined in serum samples. The Friedewald formula was used for the calculation of low-density lipoprotein (LDL) cholesterol levels.[20] Plasma levels N-terminal pro B-type natriuretic peptide (NT-proBNP) were determined using electro chemiluminescence immunoassays. D-dimer levels were measured by microparticle enzyme immunoassay (Abbott Diagnostics) in the biomarker laboratory. Growth differentiation factor 15 (GDF-15) was measured with a GDF-15 pre-commercial assay. Additional biomarkers in stored plasma samples were chosen from the pathological perspectives of atherosclerosis formation: lipoprotein (a), cystatin C, fibrinogen, Pregnancy-associated plasma protein-A (PAPP-A), Soluble suppression of tumorigenesis-2 (sST2), Hemoglobin A1c (HbA1c), uric acid (UA). Plasma fibrinogen was determined by STA-R (Diagnostica Stago, Germany) with reagents (STA-Fibrinogen, Diagnostica Stago).[21] Plasma sST2 and PAPP-A were determined by use of quantitative sandwich ELISA kit (R&D Systems, Minneapolis, Minnesota). The intra-assay and inter-assay coefficients of variations for all immunoassays mentioned above ranged between 1.8% and 14%. Minimum detection limit for GDF-15, sST2 and PAPP-A was 23.4 pg/mL, 31.3 pg/mL and 0.78 ng/mL. Plasma NT-proBNP was determined with an electrochemiluminescence sandwich immunoassay (ECLIA, Roche Diagnostics, Mannheim, Germany) on an Elecsys System 2010. The linear range of detection of this assay was 5 to 35000 pg/mL. D-dimer was determined using the STA Liatest D-DI. The automated plasma D-dimer assay was performed by using an STA Compact Diagnostica Stago assay instrument (Diagnostica Stago).[22] The manufacturer’s normal reference range is 0.22 to 4.0 μg/mL, with most normal people’s values being < 0.5 μg/mL. UA was measured as described previously. Fasting baseline glucose and creatinine were determined by use of routine methods of the respective study centers. All biochemical analyses were performed blinded to patient status. These biomarker assays were performed at the Clinical Research Center Laboratory at Chinese PLA general hospital.
Model Development
The analyses followed a structural framework for the development and validation of clinical prediction models described previously.[23] The missing rate of all features in this study is less than 5% (Table 1). For features with missing values, median or mode is used to fill in the missing data of continuous and categorical variables, respectively. Initially, a Cox regression model including all possible candidate predictors was fitted in patients in the OCEA train cohort. The possible predictors were selected a priori and included the following candidate variables: those published in previous literature[GRACE score:[24] age, heart rate, systolic blood pressure, Killip class, creatine, ST-segment deviation on electrocardiogram, elevated troponin, cardiac arrest at admission; ABC-ACS ischemia score:[23] age, GDF-15, NT-proBNP, extent of CAD, peripheral artery disease (PAD), Killip class, ACS type, P2Y12 inhibitor] and other possible biomarker variables: WBC count, Fibrinogen, and D-dimer. Biomarkers (NT-proBNP, WBC count, GDF-15, Fibrinogen, D-dimer) were log-transformed (natural logarithm). To develop a more clinically simplified and useful model, we applied a backward procedure based on the Akaike information criterion for variable selection. Variables for inclusion were carefully chosen to ensure parsimony of the final model.[25]
Table
1.
Baseline characters.
Variables
Derivation cohort (n = 1910)
Validation cohort (n = 819)
P-value
Clinical factors
Demographics
Age, yrs
61 (53, 70)
63(55, 73)
< 0.001
Male
1385 (73%)
561(68%)
0.038
SBP, mmHg
134 (122, 149)
131 (120, 145)
0.004
DBP, mmHg
76 (68, 83)
74 (66, 82)
< 0.001
BMI
25.4 (23.4, 27.7)
25.46 (23.35, 27.7)
< 0.001
Medical history
Hypertension
1267 (66%)
535 (65%)
0.64
Diabetes
878 (32%)
756 (31%)
0.72
Hyperlipidemia
559 (29%)
260 (32%)
0.252
Smoker
< 0.001
0
981 (51%)
492 (60%)
1
317 (17%)
101(12%)
2
611 (32%)
226 (28%)
CAD subtype
0.008
Unstable pectoris
1636 (86%)
664 (81%)
Non-STEMI
83 (4%)
42 (5%)
STEMI
191 (10%)
113 (14%)
ST-segment deviation
218 (11%)
129 (16%)
0.002
Stroke
174 (9%)
84 (10%)
0.386
PCI/CABG
1525 (80%)
595 (73%)
< 0.001
Prior MI
463 (17%)
372 (15%)
<0.001
PAD
54 (2.8%)
22 (3%)
1
Multivessel disease
1289 (67%)
422 (51.5%)
0.7
Medications
Aspirin
1820 (95%)
743 (91%)
<0.001
Statins
1809 (95%)
781 (95%)
0.698
Beta-blocker
1386 (73%)
630 (77%)
0.012
Clopidogrel
1638 (86%)
666 (81%)
0.004
ACE-inhibitors
1840 (44%)
339 (41%)
0.464
Cardiac function parameters
LVEDd, mm
46.0 (43.0, 49.0)
45.0 (43.0, 48.0)
< 0.001
LVESd, mm
31.0 (29.0, 34.0)
31.0 (29.0, 34.0)
< 0.001
EF (%)
57 (53, 61)
58 (54, 62)
0.016
Coagulation parameters
Fibrinogen, g/L
3.17 (2.74, 3.73)
3.21 (2.72, 3.83)
0.497
D-dimer, μg/mL
0.31 (0.21, 0.52)
0.31 (0.19, 0.58)
0.752
Biomarker analyses
WBC, 10e9/L,
6.55 (5.48, 8.00)
6.6 (5.48, 7.94)
0.998
Hemoglobin, g/L
138 (126, 148)
138 (126, 148)
0.757
PLT, 10e9/L
204 (171, 241)
205 (172, 241)
0.005
TC, mmol/L
3.96 (3.34, 4.73)
3.75 (3.21, 4.42)
< 0.001
TG, mmol/L
1.38 (0.99, 2.01)
1.34 (0.96, 1.83)
0.067
LDL-C, mmol/L
2.31(1.8, 2.93)
2.22 (1.75, 2.78)
0.006
HDL-C, mmol/L
1 (0.85, 1.18)
1.02 (0.86, 1.23)
0.196
Glucose, mmol/L
5.99(5.09, 7.84)
5.82 (4.93, 7.94)
0.055
GDF-15, ng/L
2167 (1383, 3548)
1434 (908, 2262)
< 0.001
NT-proBNP, pg/mL
155.7 (59.53, 587.55)
206.1 (69.6, 754.15)
0.002
sST2, μg/L
21338.6 (1396.4, 31768.8)
16338.7 (11237, 24272.3)
< 0.001
eGFR, ml/min/1.73 m2
90.5 (76, 100)
86.4 (70.5, 97.3)
< 0.001
Creatine, mg/dL
0.68 (0.58, 0.81)
0.68 (0.58, 0.79)
< 0.001
PAPPA, ng/mL
0.46 (0.4, 0.55)
0.42 (0.37, 0.5)
< 0.001
UA, mg/dL
5.57 (4.59, 6.62)
5.37 (4.36, 6.61)
< 0.001
HbA1c (%),
6.10 (5.70, 7.00)
6.10 (5.60, 7.00)
0.015
Lp (a), mg/dL
18 (9, 31)
18 (9, 31)
0.2
Categorical data are shown as numbers and percentages (%). Continuous data are presented as median and inter-quartile range. ACE: angiotensin converting enzyme; BMI: body mass index; CABG: coronary artery bypass graft; DBP: diastolic blood pressure; EF: ejection fraction; eGFR: estimated glomerular filtration rate; GDF-15: growth differentiation factor 15; HbA1c: glycated hemoglobin; HDL-C: high-density lipoprotein cholesterol; LDL-C: low-density lipoprotein cholesterol; LVEDd: left ventricular end diastolic diameter; LVESd: left ventricular end systolic diameter; MI: myocardial infarction; NT-proBNP: N-terminal pro brain natriuretic peptide; PCI: percutaneous coronary intervention; PAD: peripheral atherosclerosis disease; PLT: platelet; SBP: systolic blood pressure; TC: total cholesterol; TG: total triglyceride; WBC: white blood cell; UA: uric acid:.
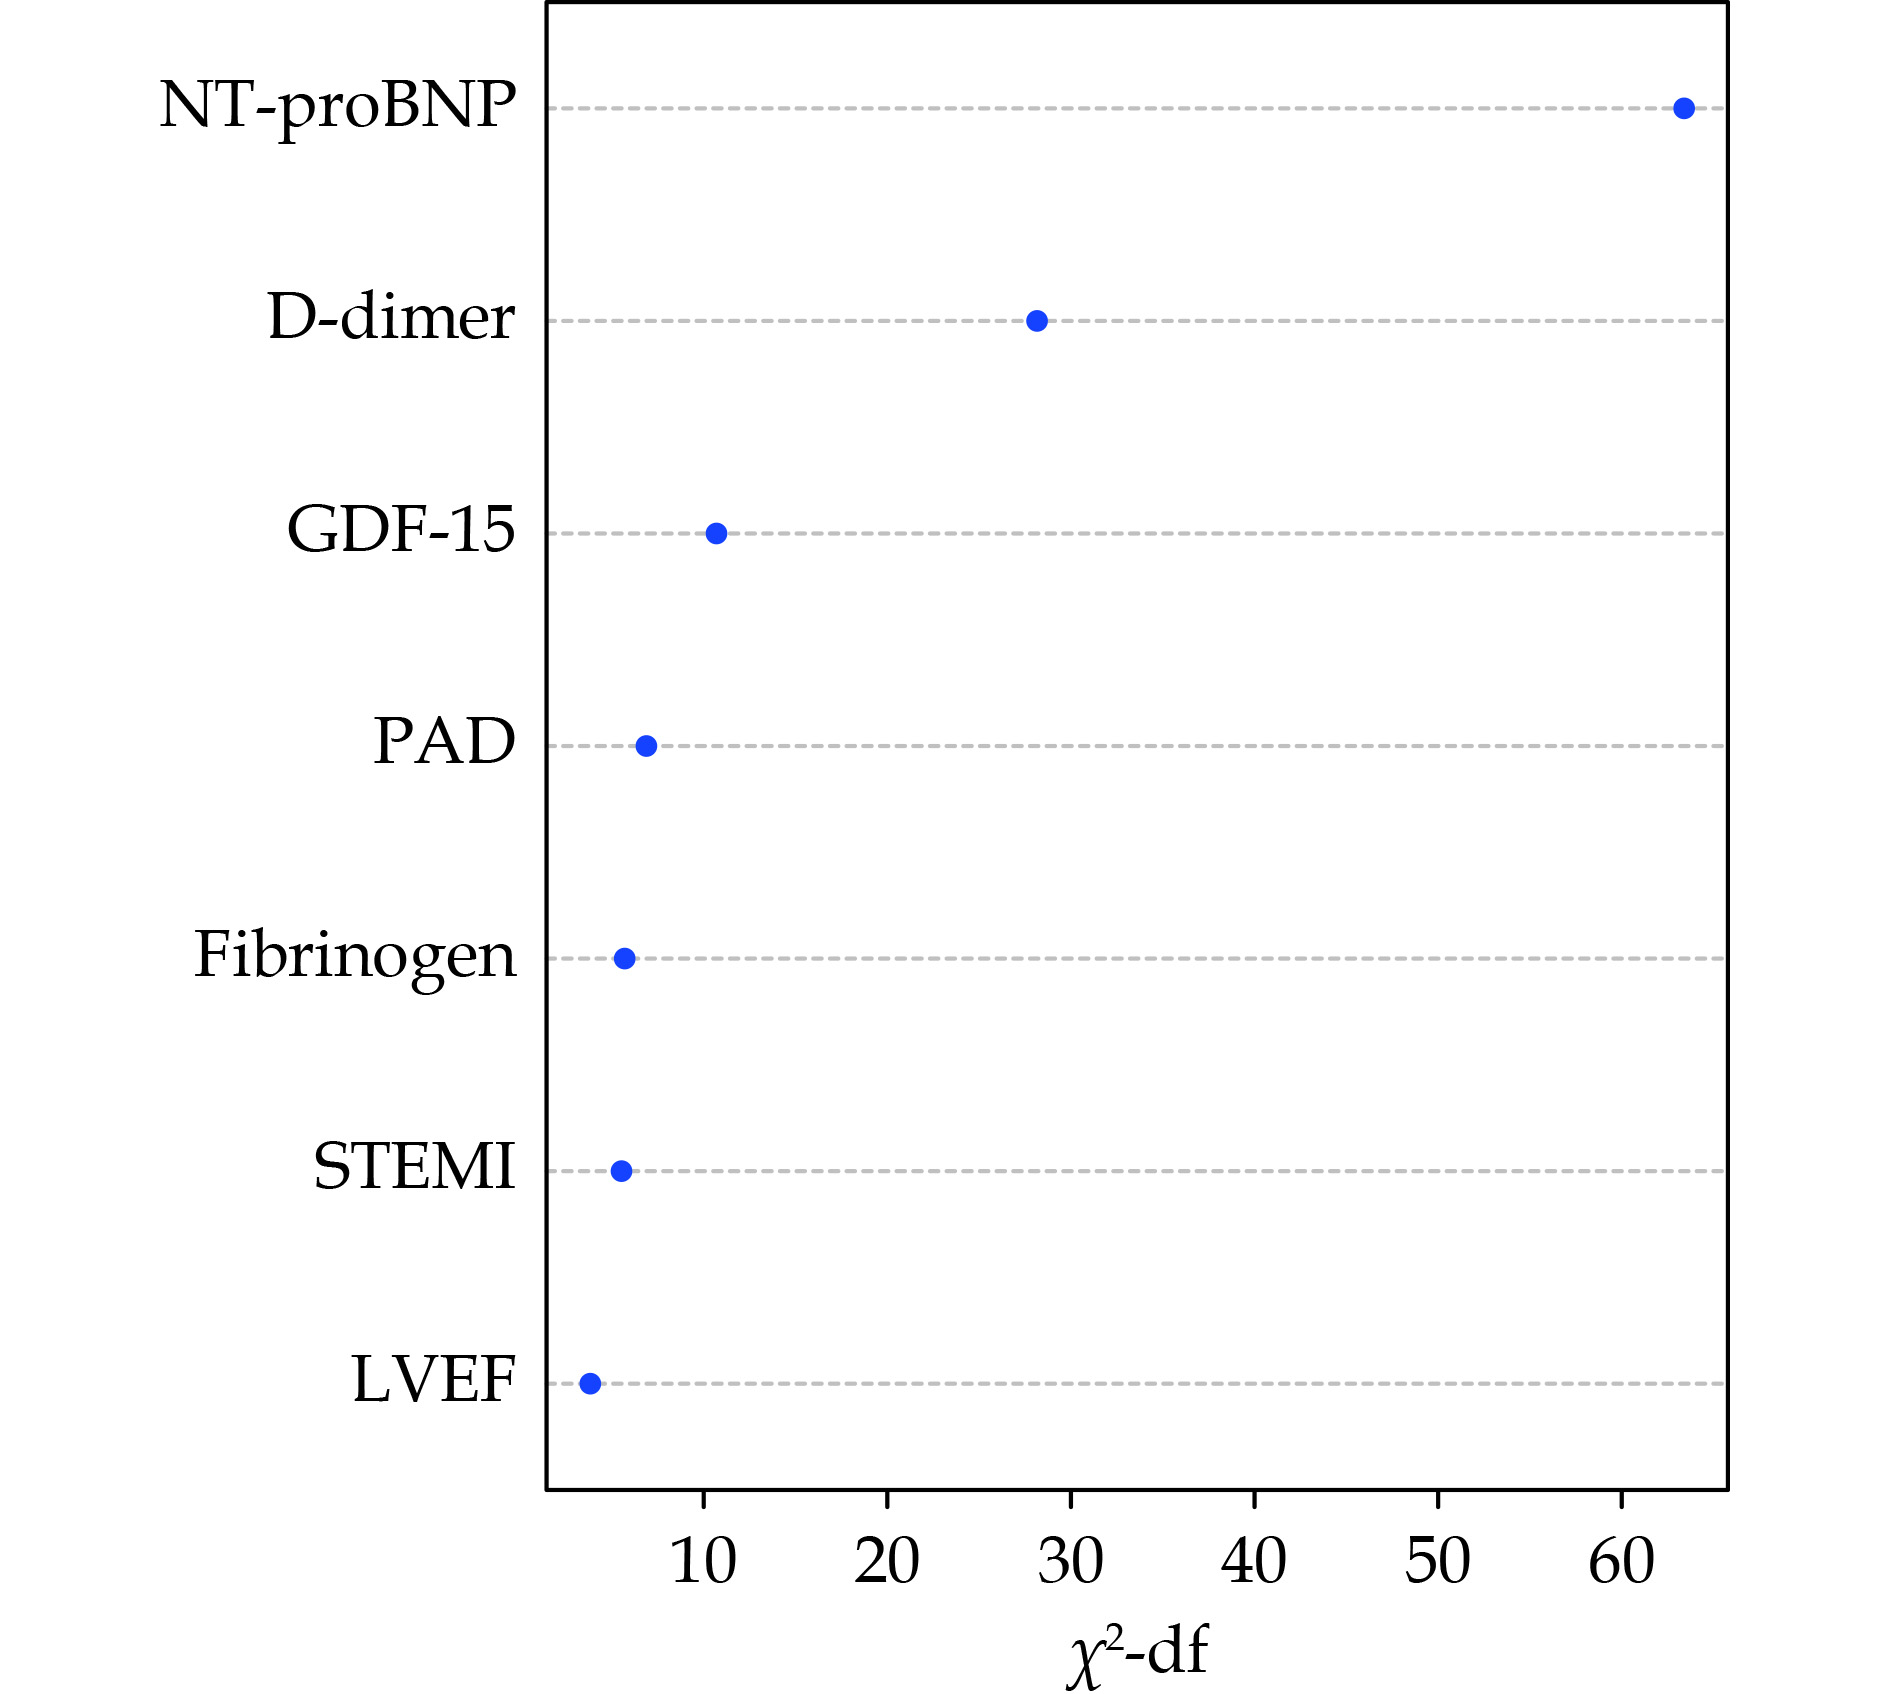
The result for the most important factors included in the final model is presented in Figure 1. In addition, the model was used for estimating a score for the risk of CV death/MI. For descriptive purposes, patients were arbitrarily grouped based on scores into low (< 5%) and high (> 5%) 5-year risk of CV death/MI and the Kaplan-Meier curves of two groups were compared by log-rank test. Internal validation of the final parsimonious model was performed using 500 bootstrap samples. The performance of the score was compared with the GRACE 2.0 score and ABC-ACS score in two cohorts.[11,23] Discrimination was assessed by using the Harrell C-index.[26] Calibration was assessed by comparing predicted and observed 10-year and 8-year rates of CV death/MI in development and validation cohort, respectively, by using calibration plots and Greenwood-Nam-D'Agostino (GND) statistic. Discrimination was assessed for all-cause death/MI and separately for all-cause death, and CV death. The clinical utility and net benefit of the novel score were evaluated with decision curve analysis as recommended by the TRIPOD (Transparent Reporting of a Multivariable Prediction Model for Individual Prognosis or Diagnosis) statement.[27]
Figure
1.
The relative importance of variables included in the final model for the prediction of cardiovascular death death/myocardial infarction.
Importance is measured as chi-square statistic minus the predictor degrees of freedom (df). GDF-15: growth differentiation factor 15; PAD: peripheral artery disease; STEMI: ST-segment elevated myocardial infarction.
Baseline characteristics of the cohorts are described using medians (interquartile range, IQR) for continuous variables, and numbers (percentages) for categorical variables. We performed analyses of the associations between these biomarkers and all outcomes using Cox proportional hazard regression analyses (Supplementary materials). The R statistical package was used for statistical analysis (http://www.R-project.org; version 4.2.3).[28]
RESULTS
Baseline Characteristics
The OCEA group is the main prospective observational study data source for CV risk score derivation and validation. The earlier admitted patients (September 2010 to September 2013; n =1910) were enrolled as train cohort; and the subsequently admitted subjects (October 2013 to May 2015; n =819) were treated as validation cohort. In the derivation cohort, the median age was 61 years, 86% had unstable angina pectoris, 4% had NSTMI, 10% had STEMI. In the derivation cohort the median age was 63, 81% experienced unstable angina, 5% had STEMI and 14% had NSTEMI. Baseline characteristics of patients with and without clinical events are displayed in Table 1.
Model Development and Internal Validation
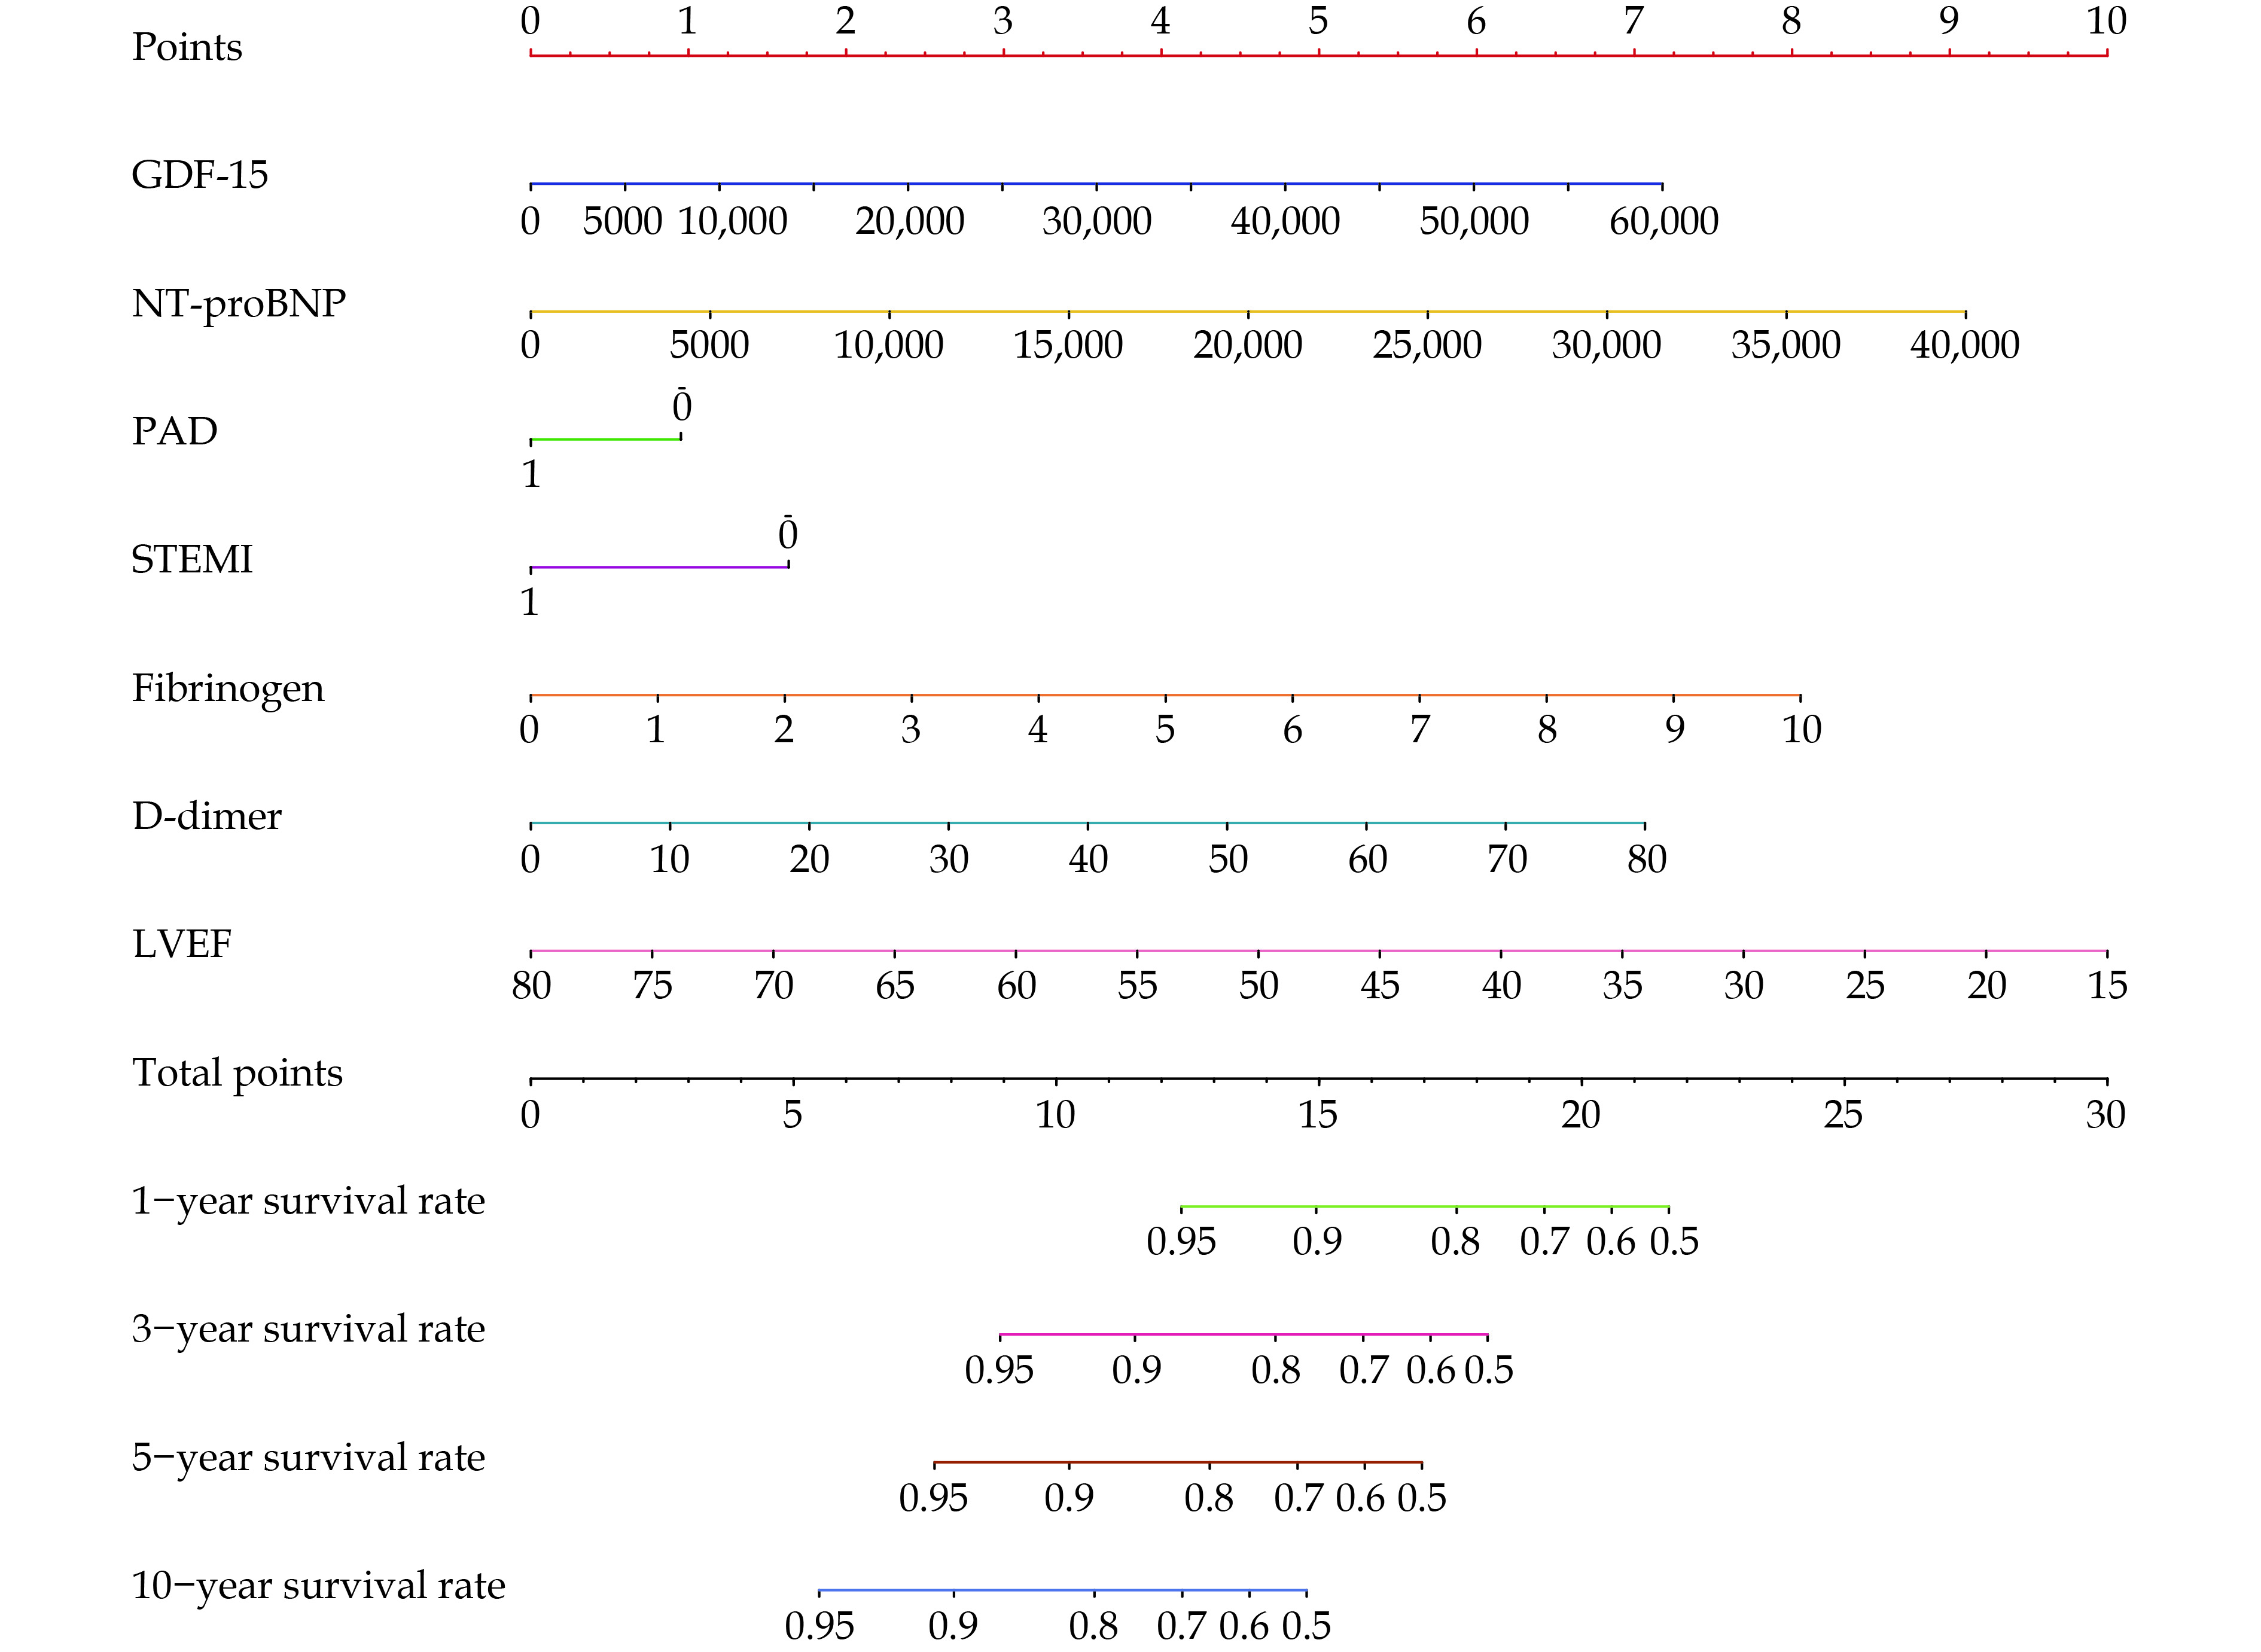
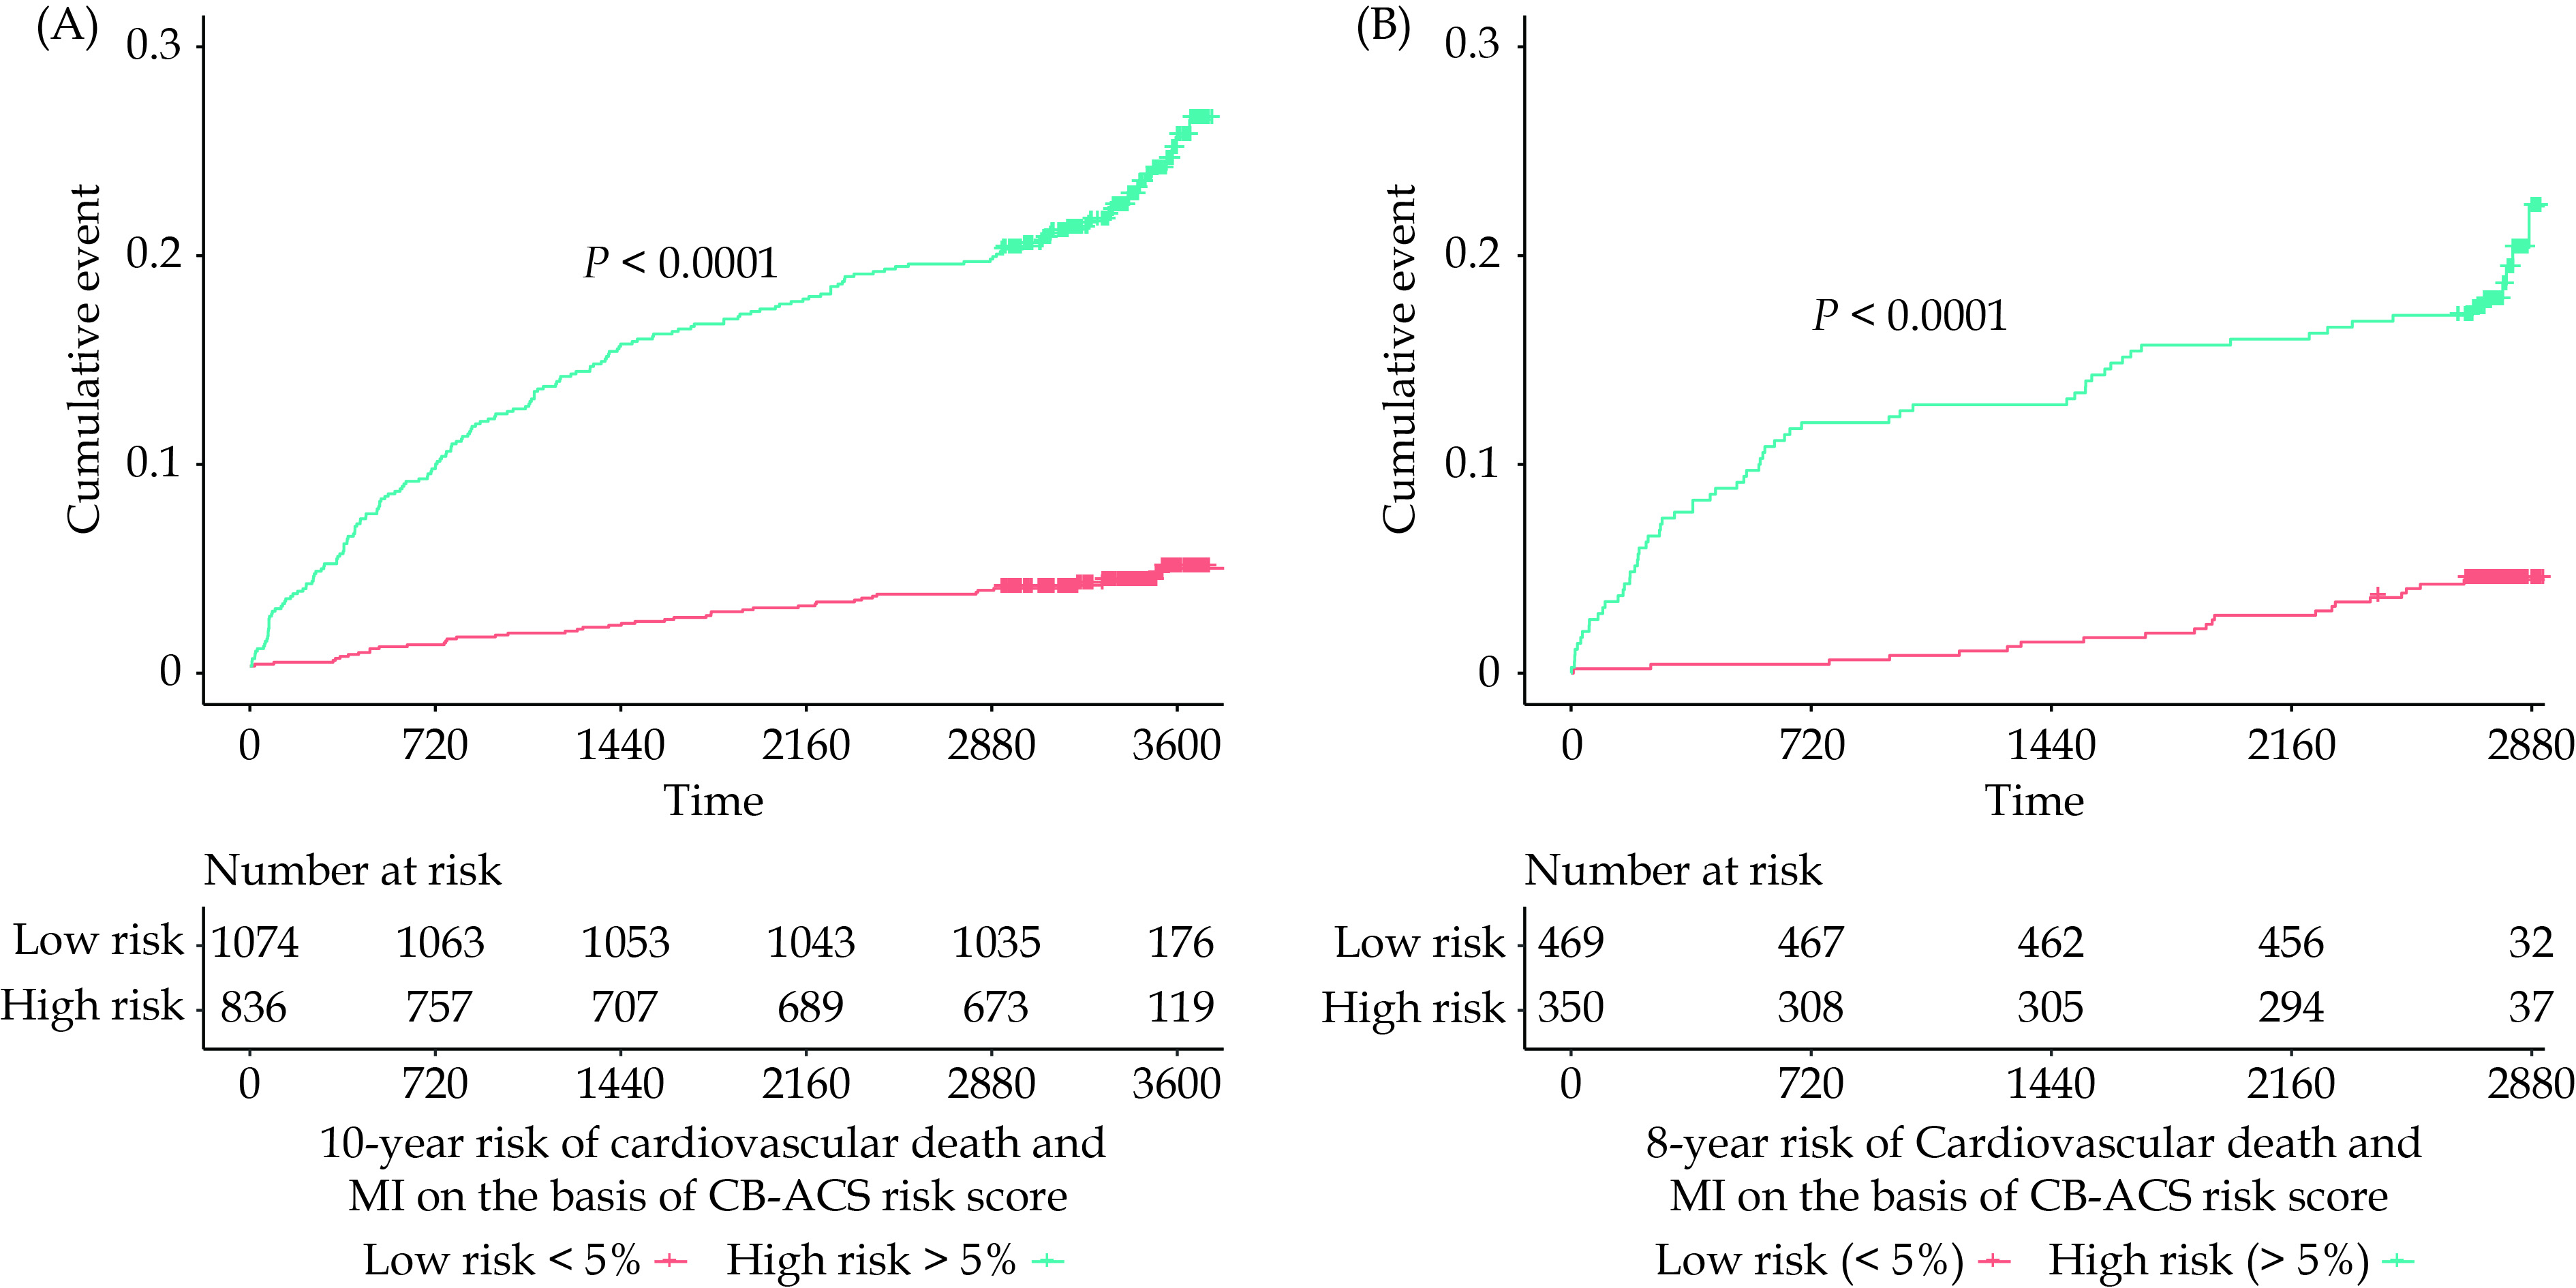
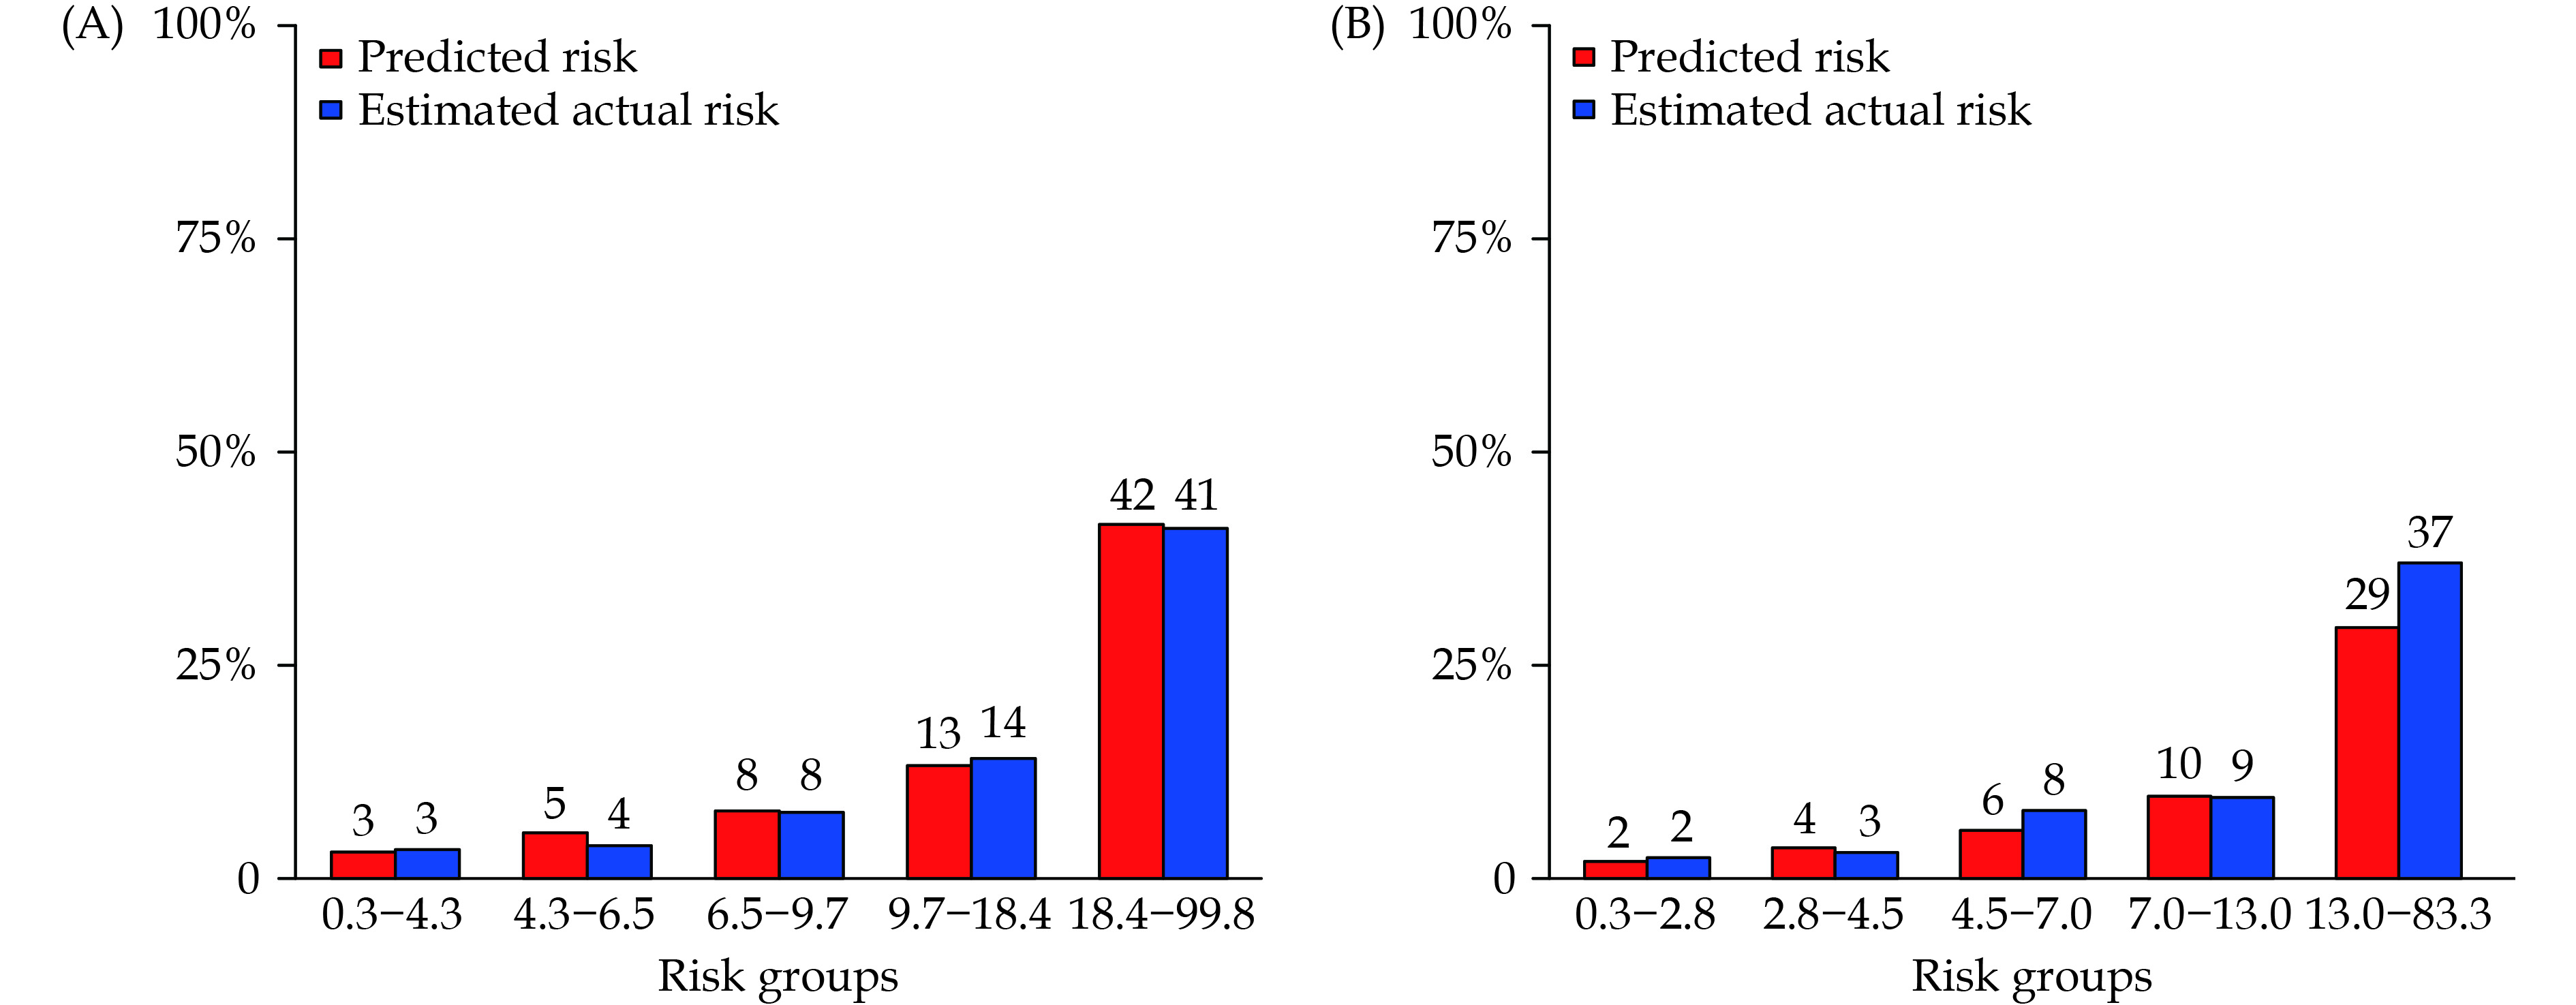
The development of the score was based on 16,110 person-years of follow-up (median follow-up: 9.2 years) and 238 episodes of cardiovascular death/MI (incidence rate: 1.45 per 100 person-years) in our cohort. The full model, including all candidate variables, yielded a C-index of 0.80 (95% CI: 0.75-0.82) for overall risk of cardiovascular death/MI. The 7 most important predictors including in the final model, in order of rank, were NT-proBNP, D-dimer, GDF-15, PAD, Fibrinogen, STEMI left ventricular ejection fraction (LVEF) (Figure 1). The model including clinical risk factors (C) and biomarkers of plasma (B) were termed as CB-ACS ischemia score. This model was represented as a nomogram in Figure 2 and a regression equation was described in the Supplemental Material. Kaplan-Meier estimates showed the score had good discriminative capacity in development cohort as illustrated by comparing event rates between low and high-risk classes within 10 years (Figure 3A). The CB-ACS ischemia score was also well calibrated in development population (Figure 4A, Greenwood-Nam-D'Agostino P = 0.70).The AIC-backward selection procedure presents a final parsimonious model with C-index for prediction of overall CV death/MI being 0.79 (95% CI: 0.76-0.82) and an annual C-index between 0.78 and 0.86 (Figure 5A). Internal bootstrap validation indicated that the final model was not overfitted (optimism-corrected C-index: 0.78, optimism-corrected calibration slope: 0.97; both indicating only modest over-fitting). A significant association was observed between variables and the outcomes (Supplementary Figure 2).
Figure
2.
Nomogram for the final model. Each variable corresponds to a point (top).
These points are then summed to translate into a risk of cardiovascular death or myocardial infarction (1-year, 3-year, 5-year, and 10-year) (bottom). GDF-15: growth differentiation factor 15; PAD: peripheral artery disease; STEMI: ST-segment elevated myocardial infarction.
Kaplan-Meier estimates of cumulative 10-year and 8-year risk of cardiovascular death or myocardial infarction predicted by ABC-ACS ischemia risk classes (low risk: < 5%; high risk: > 5%) in the development (A) and the validation (B) cohort, respectively.
Figure
4.
Calibration column for risk of cardiovascular death or myocardial infarction based on the CB-ACS risk score in the development (A) and the validation (B) cohort.
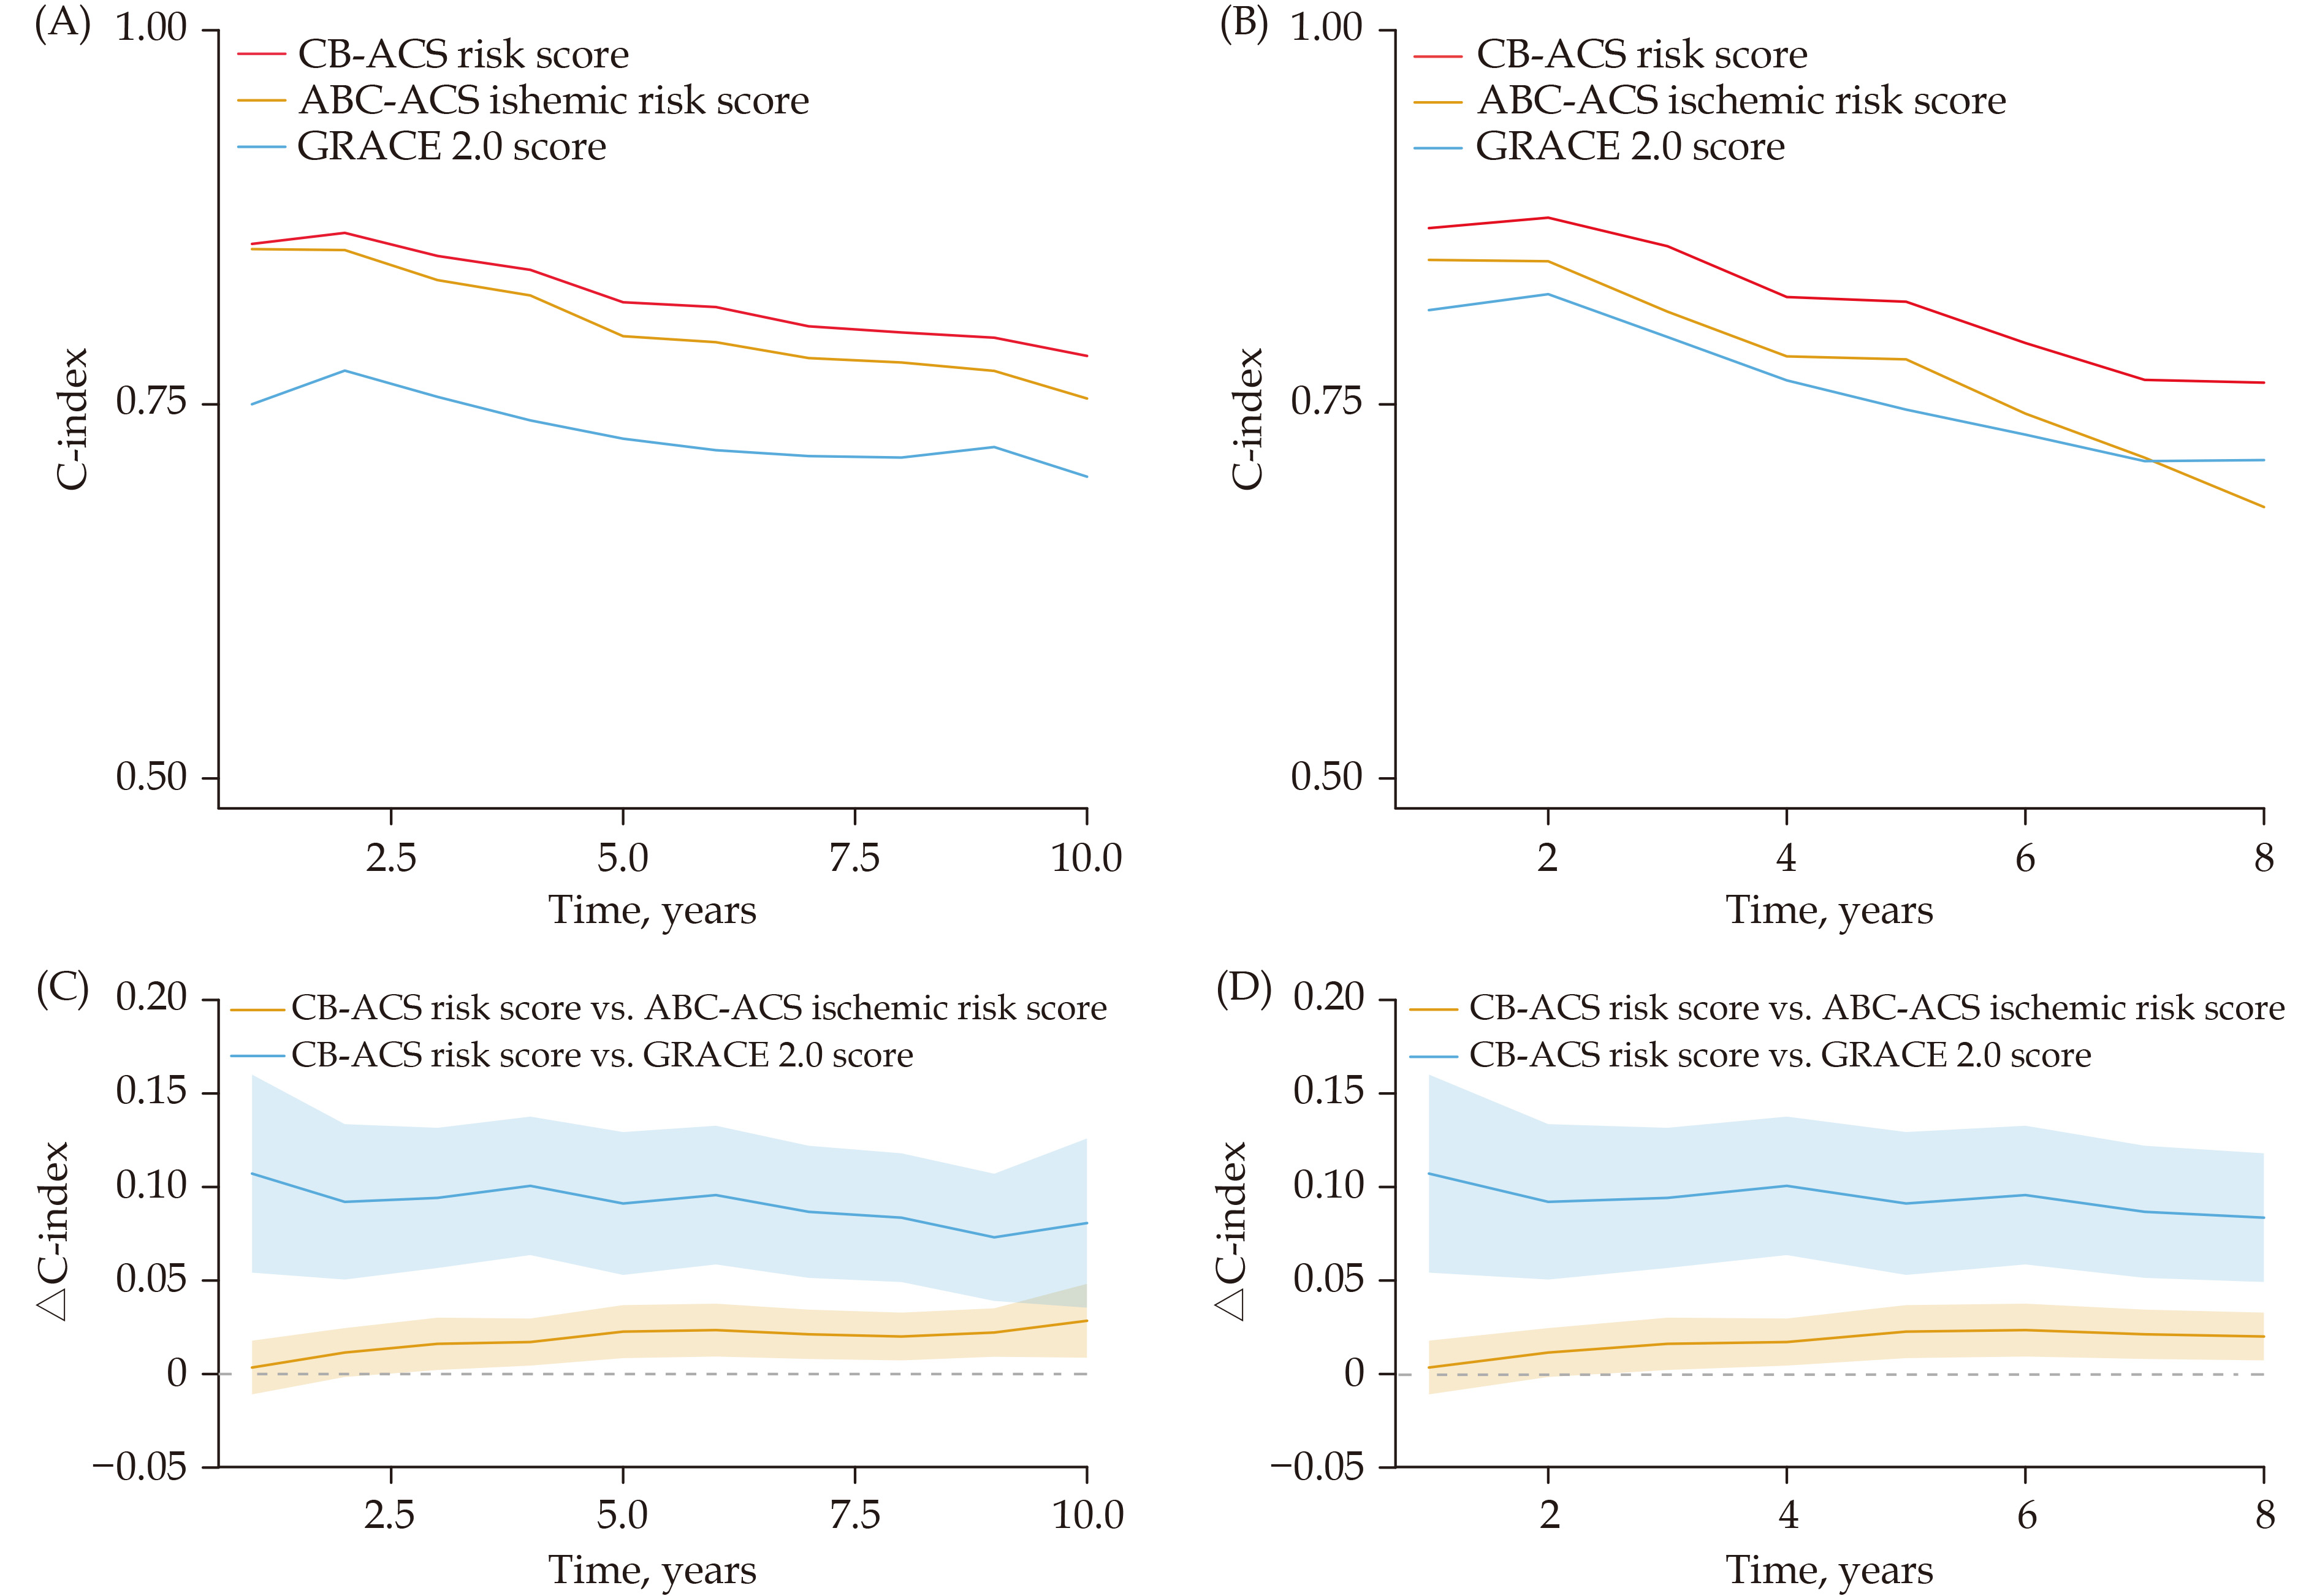
Figure
5.
Time-C-index of three models in development (A) and validation (B) cohort.
The C-indices of CB-ACS model are highest among three models throughout follow-up times. ∆C-index indicates differences of C-indices between two models in development (C) and validation (D) cohort through follow-up times. Most of the lower confidence interval (CI) of ∆ C-index between two models (CB-ACS score vs GRACE 2.0 score; CB-ACS score vs ABC-ACS score) outweigh zero, meaning CB-ACS model having a significantly higher C-index for CV death/MI than ABC-ACS and GRACE 2.0 risk score across most of follow-up times.
External validation was performed in the subsequent enrolled cohort based on 5,832 person-years of follow-up (median follow-up: 7.6 years) and 88 episodes of CV death/MI (incidence rate: 1.51 per 100 person-years). In the external cohort, the CB-ACS ischemia score achieved annual C-indices between 0.76 and 0.88 (Figure 5B). It was also well calibrated (Figure 4B; Greenwood-Nam-D'Agostino P = 0.07) and present a good discriminative capacity as showed by comparing event rates between two risk classes in external cohort (Figure3B).
Model Comparison
The C-indices of CB-ACS risk score for predication of CV death or MI were 0.79 (95% CI: 0.76-0.82) and 0.77 (95% CI: 0.76-0.78) in development and validation cohort, respectively, significant superior to that of both GRACE 2.0 score and ABC-ACS ischemia score (Table 2) and this finding remained consistent throughout most of the follow-up times in two cohort (Figure 5). For individual all-cause death and CV death endpoint, the CB-ACS ischemia score also performed better in development as well as validation cohort, compared with the other two risk scores (Table 2).
Table
2.
C-index of CB-ACS risk score for prediction of cardiovascular events compared with GRACE 2.0 and ABC-ACS risk score.
Derivation cohort
Validation cohort
C-index (95% CI)
P-value
C-index (95% CI)
P-value
Cardiovascular death or MI
CB-ACS risk score
0.79 (0.757,0.822)
Ref.
0.759 (0.749, 0.776)
Ref.
ABC-ACS risk score
0.772 (,0.736,0.804)
0.001
0.712 (0.706,0.725)
0.007
GRACE 2.0
0.706 (0.666, 0.736)
<0.001
0.713 (0.697,0.742)
0.034
All-cause death or MI
CB-ACS risk score
0.792 (0.757, 0.825)
Ref.
0.765 (0.758, 0.775)
Ref.
ABC-ACS risk score
0.770 (0.734, 0.801)
0.001
0.714 (0.709, 0.724)
0.005
GRACE 2.0
0.701 (0.662, 0.732)
<0.001
0.707 (0.694, 0.728)
0.011
Cardiovascular death
CB-ACS risk score
0.788 (0755, 0.820)
Ref.
0.751 (0.739, 0.768)
Ref.
ABC-ACS risk score
0.768 (0.733, 0.802)
0.02
0.708 (0.698,0.728)
0.017
GRACE 2.0
0.698 (0.661, 0.731)
<0.001
0.689 (0.665, 0.724)
0.012
All-cause death
CB-ACS risk score
0.790 (0.758, 0.820)
Ref.
0.759 (0.751,0.773)
Ref.
ABC-ACS risk score
0.766 (0.731, 0.799)
0.001
0.710 (0.700,0.727)
0.008
GRACE 2.0
0.692 (0.654, 0.727)
<0.001
0.692 (0.676, 0.719)
0.005
ABC: age, biomarkers, clinical history; CB: clinical risk factors, biomarkers; GRACE: Global Registry of Acute Coronary Events.
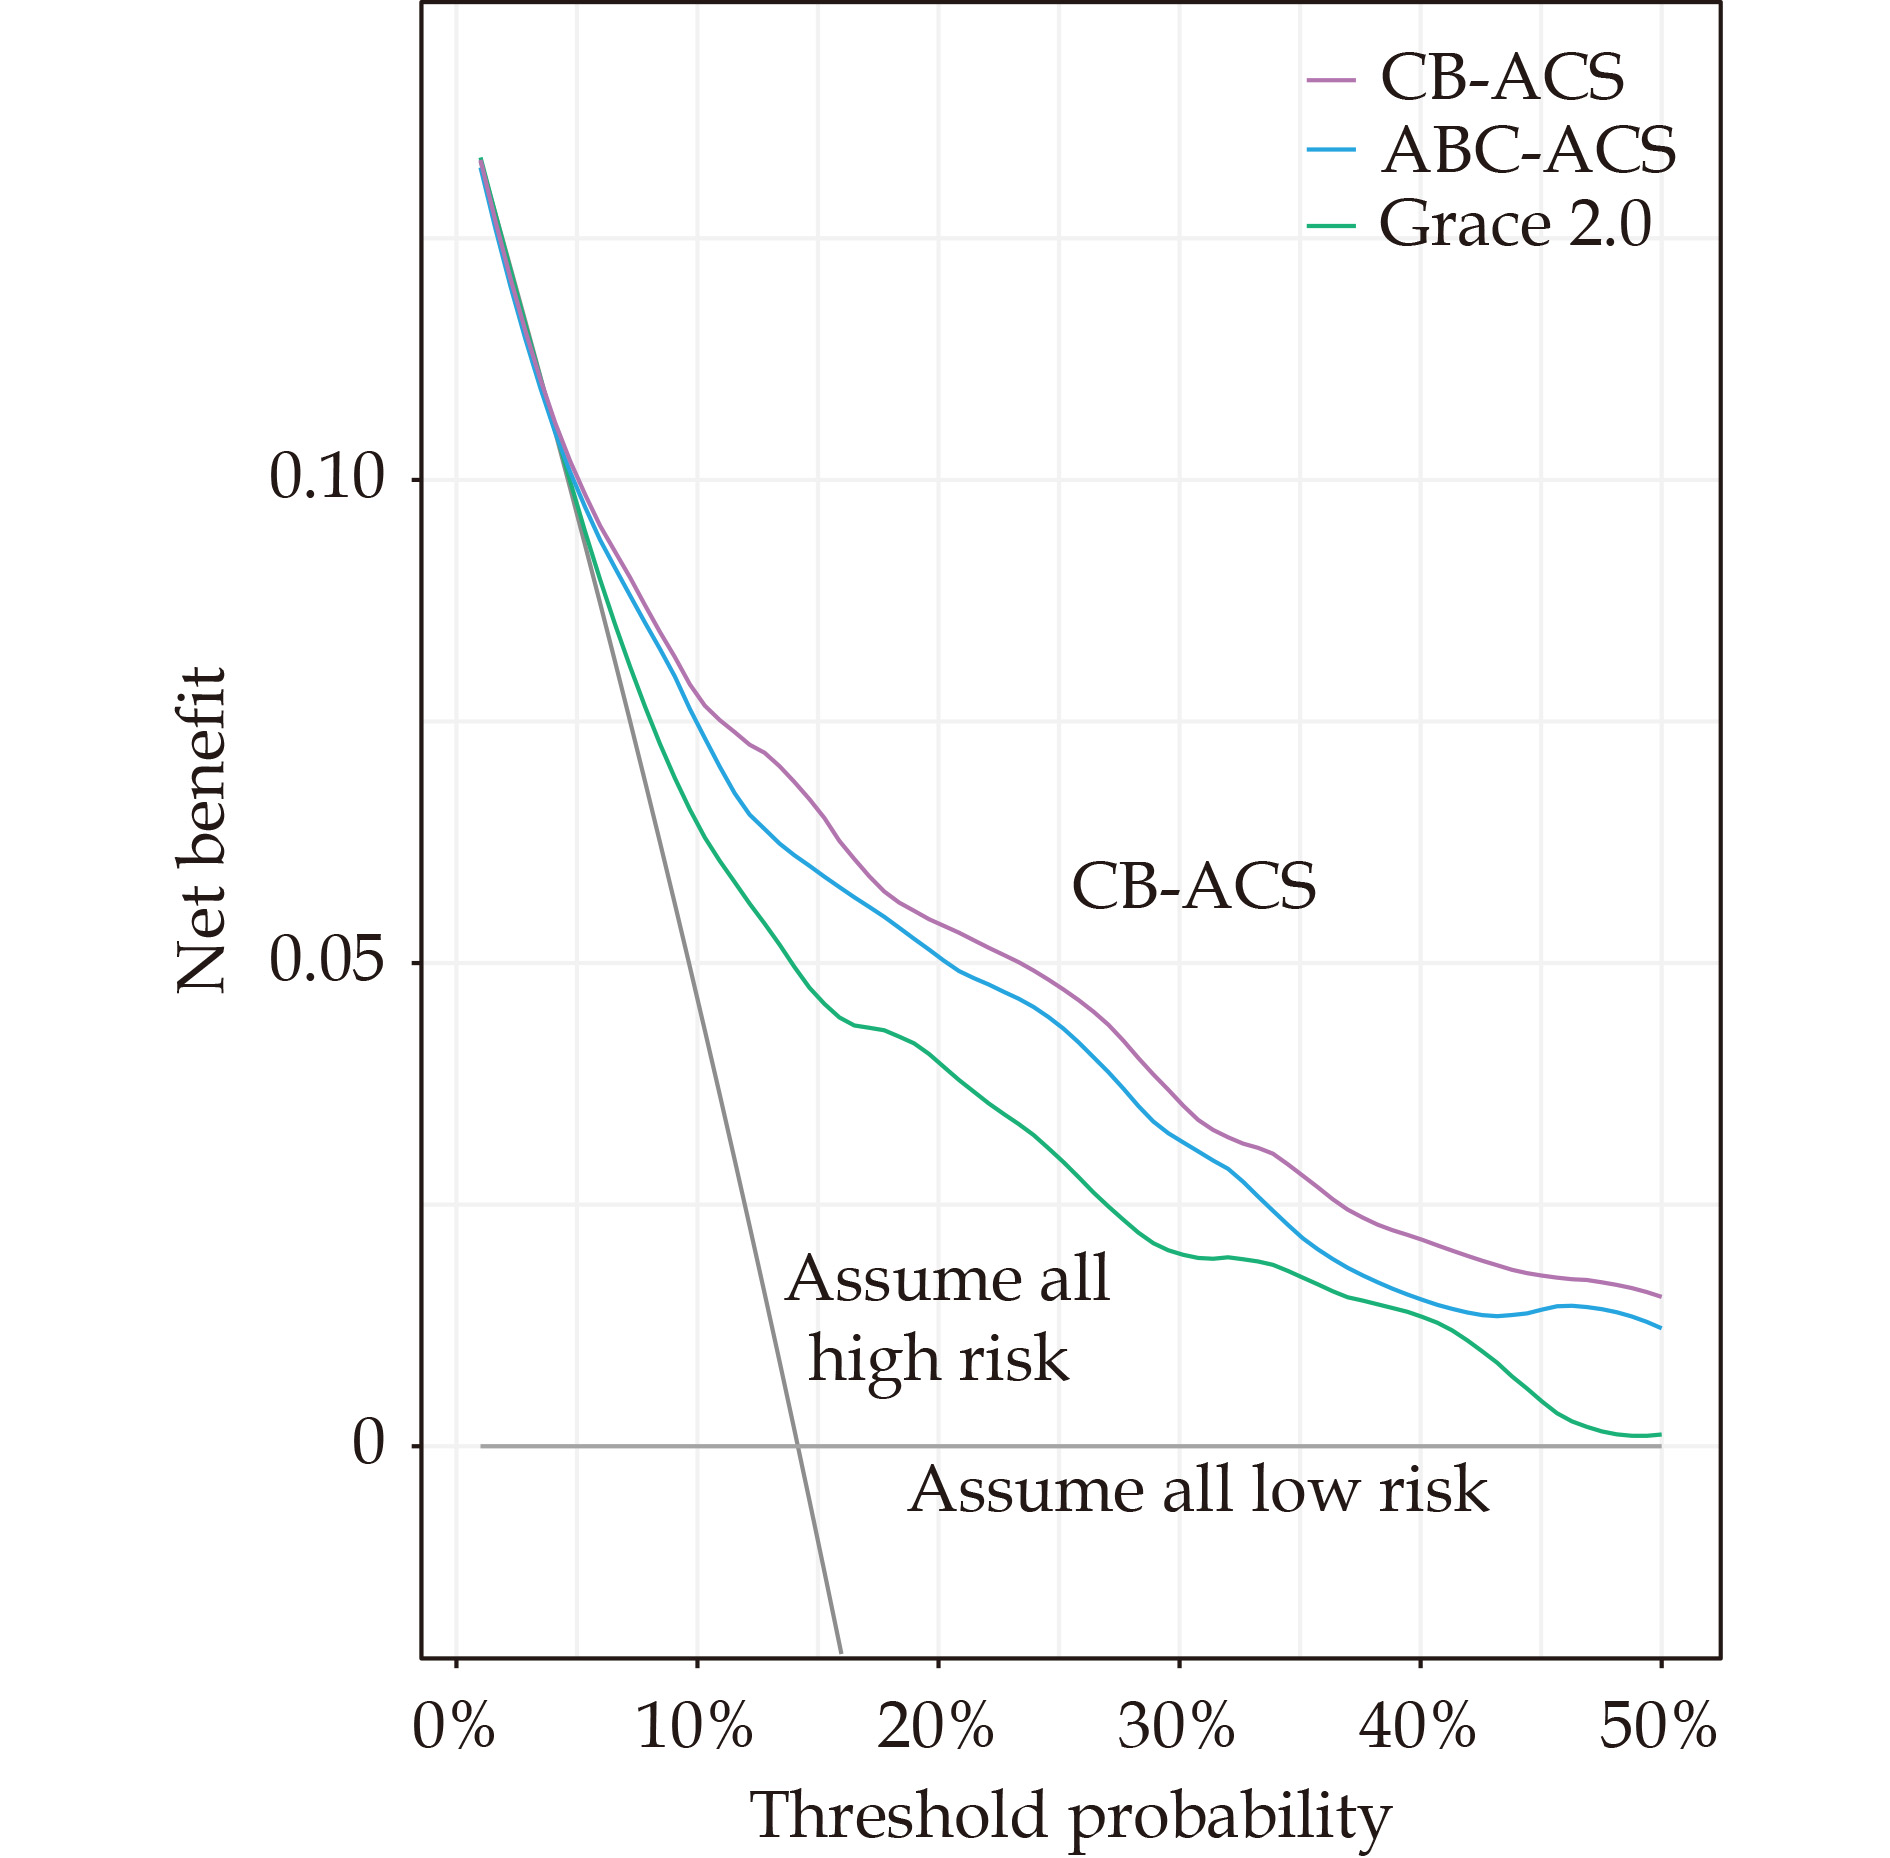
Decision curve analysis was used to assess the clinical utility of the CB-ACS ischemia score compared to the ABC-ACS and GRACE 2.0 score. In brief, decision curve analysis calculates the “net benefit” of using a prediction model to risk stratify patients (Y-axis) across a range of threshold probabilities (X-axis) compared to default strategies of treating all or no patients. Compared to the ABC-ACS and GRACE 2.0 ischemia score, the CB-ACS model resulted in a higher net benefit across a range of threshold probabilities (Figure 6).
Figure
6.
Decision curve analysis.
Net benefit of using CB-ACS model to predict 10-year CV death or MI compared with ABC-ACS risk score and GRACE 2.0 risk score with strategies of “assume high risk for all” or “assume low risk for all” for different thresholds.
In this study, we developed and validated a novel biomarker-based risk model for predicting a long-term CV events and all-cause death in the large clinical cohorts of patients with ACS. The CB-ACS risk score was optimized to constructed as an accurate predictive model containing clinical risk factors (C): STEMI, PAD, LVEF of echocardiography; and biomarkers of plasma (B): NT-proBNP, GDF-15, D-dimer and fibrinogen. Compared to existing risk scores (ABC-ACS ischemia score and GRACE risk score) for ACS patients, the new model provided an even better and longer-term prediction of CV death, all-cause death and MI, with similar findings when externally validated.
Clinical practice guidelines recommend that health care providers tailor secondary prevention strategies, including antithrombotic therapies, after personalized risk stratification. Therefore, there is an urgent requirement for accurate tools to easily and accurately assess the risk of recurrent ischemic events in patients with ACS. Previous risk assessment scores, such as TIMI risk score and the GRACE risk score have predominantly focused on the physical parameters of ACS patients and provided short-term risk stratification to aid with decision making at the time of primary ACS presentation for an early invasive approach.[29] More recent study even showed that GRACE risk score did not improve adherence to guideline recommended management or reduce CV events.[30] In the present study, the current risk score was developed by involvement of multiple biomarkers of plasma, which might be ignored in previous risk model construction. All patients with ACS whether undergone PCI or not were all enrolled into this study. Moreover, the study incorporated various CV risk factors and clinical accessible biomarkers into the CB-ABC risk score, achieving a high AUC of 0.845 in predication of all cause deaths. The CB-ACS risk model was intentionally developed to complement the GRACE, GRACE 2.0 and TIMI risk scores, specially targeting the long-term CV event risk prediction with or without PCI. It holds significant relevance for clinical decisions regarding secondary preventive management, including determining the intensity and duration of antithrombotic regiments. Integrating multi-pathway risk predictors within an individual patient’s assessment presents a challenge for the clinicians. The incorporation of biomarkers into prediction models has previously demonstrated enhanced model performance. Previous study in clinical cardiology, have also develop a biomarkers-based risk model (ABC-ACS risk score) and highlighted that ABC-ACS surpasses clinical or imaging modalities when it comes to predicting CV or all-cause mortality.[23] Notably, cardiac biomarkers like NT-proBNP and GDF-15 had provided supplementary predictive insights even considered alongside clinical variables. [16,23]
GDF-15 has been explored as a potential biomarker for various inflammatory diseases and cardiovascular events.[16,18] Furthermore, higher levels of GDF-15 has been showed could consistently provide prognostic information for cardiovascular events and all cause death, independent of clinical risk factors and other biomarkers.[17] Nevertheless, the coagulation parameters were not involved in the ABC-ACS model, which may not fully provide the predication information of ischemic events. In the present study, we especially analyzed the biomarkers of hypercoagulability and thrombosis (D-dimer and fibrinogen) which have been associated closely with a risk of subsequent arterial and venous thrombotic events, particularly in patients with prior vascular disease.[31-34] Compared with the other risk factors, D-dimer independently predict long-term mortality in both stable CAD and suspect ACS.[35] The coagulation index changes can effectively provide many hints of acute thrombosis events and leverage the link between elevated inflammatory markers and short-term ACS outcomes to make accurate predictions.[36-37] Also, compared with ABC-ACS risk score, the CB-ACS model can help assess the usefulness of laboratory and clinical features in predicting the in-hospital mortality among ACS patients regardless of PCI treatment. [23]
In our previous study, we employed a traditional COX regression methodology to predict CV events. We demonstrated that the multiple-markers approach offers added predictive value beyond the scope of traditional risk factors.[14] In our current study, which encompasses an extension to 10-year follow-up duration, more patients were enrolled into this study and more parameters of different physiological pathways we detected. We found multi-biomarkers-based risk score yield an incremental enhancement in prognostic accuracy compared with GRACE 2.0 risk score or ABC-ACS ischemic score reported recently. We managed a dataset consisting of more than 40 variables encompassing clinical parameters, coagulation metrics, biomarkers of plasma for long-term follow up. Augmenting the extended clinical risk factors with biomarkers significantly elevated the C-statistic from 0.71, 0.76 to 0.78 for predicting CV death and MI in ACS compared with GRACE 2.0 and ABC-ACS risk score (Table 2) in derivation cohort. ABC-ACS ischemia score exhibited notable discrimination power for predicting 1-year risk of CV death and MI in ACS patients and performed better than GRACE 2.0 risk score.[23] In our study, we introduced a prediction model capable of forecasting CV events over a 10-year follow-up period. The resulting model comprised three traditional clinical variable, two coagulation biomarkers and two other biomarkers of plasma, boasting a C-index of 0.79. We also calculated the time-dependent AUCs values throughout 10-year follow-up period. Furthermore, in contrast to the GRACE 2.0 and ABC-ACS ischemic risk score the CB-ACS consistently improved the AUC, presenting incremental prognostic value for assessing the risk of individual CV events. To our knowledge, this is the first large-scale and long-term risk assessment of recurrent CV events using both traditional risk factors and biomarkers in ACS patients. The CB-ACS risk score effectively personalizes risk assessment and performed better compared with clinical used GRACE 2.0 risk score or previously reported biomarkers-based ABC-ACS ischemic risk score. The involvement of coagulation metrics and other clinical available biomarkers of plasma into clinical risk factors is more reasonable and convenient for management of ACS patients. Also, the use of frequently occurring cardiac-specific events may not introduce bias in ACS populations.
Strengths and Limitations
There are some strengths in our study. First, our data was well characterized, and with standardized measurement of clinical characteristics and biomarkers. Also, outcomes were rigorously and centrally adjudicated with standardized and accepted definitions. And the findings were consistent across variant outcomes. Second, our cohort had a complete 10-year follow-up, which present a tool to assess the long-time prognosis of ACS patients. Finally, we validated our model in an independent ACS cohort. Our study also has potential limitations. First, the validation cohort of our study came from two different time periods in the same study center. The validation cohort were small. Thus, further lager cohort validation of CB-ACS is warranted in the different medical centers. Second, the CB-ACS risk score was derived from ACS patients, whether it is applicable for stable CAD or general population remains to be tested. Finally, future studies might be able to improve the discriminative capability of the model by including more valuable biomarkers.
Conclusions
By integrating clinical factors and plasma biomarkers, we developed and validated a new risk model (CB-ACS risk score) for ACS patients. The CB-ACS risk score showed good discrimination and calibration in the ACS patients and performed better than GRACE 2.0 and ABC-ACS ischemic risk score within ten years follow up. The results of this study have considerable clinical importance and provided a potentially helpful decision support tool for clinicians, facilitating the long-term CV risk evaluation of ACS patients.
DISCLOSURE
Availability of data and materials
The datasets used and analyzed in the current study are available from the corresponding author upon reasonable request.
Conflict of interest
The authors declare that they have no competing interests.
Ethics approval and consent to participate
The study was approved by the ethics committee of Chinese PLA General Hospital. All patients were informed about the study objectives and procedure. Participants gave their written informed consent to participate prior to admission.
Hollander JE, Than M, Mueller C. State-of-the-art evaluation of emergency department patients presenting with potential acute coronary syndromes. Circulation 2016; 134: 547−564. doi: 10.1161/CIRCULATIONAHA.116.021886
[2]
Thompson PL. Modern challenges in acute coronary syndrome. Med J Aust 2014; 201: S86−87.
[3]
Bhatt DL, Lopes RD, Harrington RA. Diagnosis and Treatment of Acute Coronary Syndromes: A Review. JAMA 2022; 327: 662−675. doi: 10.1001/jama.2022.0358
[4]
Eisen A, Giugliano RP, Braunwald E. Updates on Acute Coronary Syndrome: A Review. JAMA cardiology 2016; 1: 718−730. doi: 10.1001/jamacardio.2016.2049
[5]
Antoniades C, Polkinghorne MD. Novel Biomarkers for Risk Stratification in NSTE-ACS: Is There a Place for Cathepsin S? J Am Coll Cardiol 2022; 80: 1011−1013.
[6]
Gorog DA, Ferreiro JL. De-escalation or abbreviation of dual antiplatelet therapy in acute coronary syndromes and percutaneous coronary intervention: a Consensus Statement from an international expert panel on coronary thrombosis. Nat Rev Cardiol 2023; 20: 830−844. doi: 10.1038/s41569-023-00901-2
[7]
Al-Zaiti SS, Faramand Z, Alrawashdeh MO, et al. Comparison of clinical risk scores for triaging high-risk chest pain patients at the emergency department. Am J Emerg Med 2019; 37: 461−467. doi: 10.1016/j.ajem.2018.06.020
[8]
Bohula EA, Morrow DA, Giugliano RP, et al. Atherothrombotic risk stratification and ezetimibe for secondary prevention. J Am Coll Cardiol 2017; 69: 911−921.
[9]
O'Gara PT, Kushner FG, Ascheim DD, et al. 2013 ACCF/AHA guideline for the management of ST-elevation myocardial infarction: a report of the American College of Cardiology Foundation/American Heart Association Task Force on Practice Guidelines. J Am Coll Cardiol 2013; 61: e78−e140.
[10]
Amsterdam EA, Wenger NK, Brindis RG, et al. 2014 AHA/ACC Guideline for the Management of Patients with Non-ST-Elevation Acute Coronary Syndromes: a report of the American College of Cardiology/American Heart Association Task Force on Practice Guidelines. J Am Coll Cardiol 2014; 64: e139−e228. doi: 10.1016/j.jacc.2014.09.017
[11]
Fox KA, Fitzgerald G, Puymirat E, et al. Should patients with acute coronary disease be stratified for management according to their risk? Derivation, external validation and outcomes using the updated GRACE risk score. BMJ Open 2014; 4: e004425. doi: 10.1136/bmjopen-2013-004425
[12]
The Lancet Regional Health-Western P. Realising potential: Strong leadership and resilience of Pacific emergency care clinicians. Lancet Reg Health West Pac 2022; 25: 100583.
[13]
Ye B, Zhao Q, Fan J, et al. RBP4-based multimarker score: a prognostic tool for adverse cardiovascular events in acute coronary syndrome patients. J Clin Endocrinol Metab 2023; 108: 3111−3121. doi: 10.1210/clinem/dgad389
[14]
Wang J, Wang J, Zhong J, et al. LRG1 promotes atherosclerosis by inducing macrophage M1-like polarization. Proc Natl Acad Sci U S A 2024; 121: e2405845121. doi: 10.1073/pnas.2405845121
[15]
Wang J, Wu Q, Wang X, et al. Targeting macrophage phenotypes and metabolism as novel therapeutic approaches in atherosclerosis and related cardiovascular diseases. Curr Atheroscler Rep 2024; 26: 573−588. doi: 10.1007/s11883-024-01229-z
[16]
Wang J, Liu J, Guo W, et al. Multiple biomarkers in the context of conventional risk factors in patients with coronary artery disease. J Am Coll Cardiol 2017; 69: 2769−2770. doi: 10.1016/j.jacc.2017.03.580
[17]
Wang J, Han LN, Ai DS, et al. Growth differentiation factor 15 predicts cardiovascular events in stable coronary artery disease. J Geriatr Cardiol. 2023 Jul 28;20: 527−537.
[18]
Wang J, Tan GJ, Han LN, et al. Novel biomarkers for cardiovascular risk prediction. J Geriatr Cardiol 2017; 14: 135−150.
[19]
Wang J, Wei L, Yang X, Zhong J. Roles of Growth Differentiation Factor 15 in Atherosclerosis and Coronary Artery Disease. J Am Heart Assoc 2019; 8: e012826. doi: 10.1161/JAHA.119.012826
[20]
Sølvik U, Røraas TH, Petersen PH, et al. Effect of coagulation factors on discrepancies in International Normalized Ratio results between instruments. Clin Chem Lab Med 2012; 50: 1611−1620.
[21]
Bos MJ, Koudstaal PJ, Hofman A, Witteman JC, Breteler MM. Uric acid is a risk factor for myocardial infarction and stroke: the Rotterdam study. Stroke 2006; 37: 1503−1507. doi: 10.1161/01.STR.0000221716.55088.d4
[22]
Rathbun SW, Whitsett TL, Raskob GE. Negative D-dimer result to exclude recurrent deep venous thrombosis: a management trial. Ann Intern Med 2004; 141: 839−845. doi: 10.7326/0003-4819-141-11-200412070-00007
[23]
Batra G, Lindbäck J, Becker RC, et al. Biomarker-Based Prediction of Recurrent Ischemic Events in Patients With Acute Coronary Syndromes. J Am Coll Cardiol 2022; 80: 1735−1747. doi: 10.1016/j.jacc.2022.08.767
[24]
Georgiopoulos G, Kraler S, Mueller-Hennessen M, et al. Modification of the GRACE Risk Score for Risk Prediction in Patients With Acute Coronary Syndromes. JAMA Cardiol. 2023; 8: 946−956.
[25]
Barbour SJ, Coppo R, Zhang H, et al. Evaluating a new international risk-prediction tool in IgA nephropathy. JAMA Intern Med 2019; 179: 942−952. doi: 10.1001/jamainternmed.2019.0600
[26]
Ye Z, Xu Y, Tang L, et al. Predicting long-term prognosis after percutaneous coronary intervention in patients with new onset ST-elevation myocardial infarction: development and external validation of a nomogram model. Cardiovasc Diabetol 2023; 22: 87. doi: 10.1186/s12933-023-01820-9
[27]
Vickers AJ, Cronin AM, Elkin EB, Gonen M. Extensions to decision curve analysis, a novel method for evaluating diagnostic tests, prediction models and molecular markers. BMC medical informatics and decision making. BMC Med Inform Decis Mak 2008; 8: 53. doi: 10.1186/1472-6947-8-53
[28]
Hasan M, Hossain MA, Chowdhury S, et al. Human monkeypox and preparedness of Bangladesh: A knowledge and attitude assessment study among medical doctors. J Infect Public Health 2023 ;16: 90−95.
[29]
de Araújo Gonçalves P, Ferreira J, Aguiar C, Seabra-Gomes R. TIMI, PURSUIT, and GRACE risk scores: sustained prognostic value and interaction with revascularization in NSTE-ACS. Eur Heart J 2005; 26: 865−872. doi: 10.1093/eurheartj/ehi187
[30]
Gale CP, Stocken DD, Aktaa S, et al. Effectiveness of GRACE risk score in patients admitted to hospital with non-ST elevation acute coronary syndrome (UKGRIS): parallel group cluster randomised controlled trial. BMJ 2023; 381: e073843.
[31]
Gorog DA. Prognostic value of plasma fibrinolysis activation markers in cardiovascular disease. J Am Coll Cardiol 2010; 55: 2701−2709. doi: 10.1016/j.jacc.2009.11.095
[32]
Simes J, Robledo KP, White HD, et al. D-dimer predicts long-term cause-specific mortality, cardiovascular events, and cancer in patients with stable coronary heart disease: LIPID study. Circulation 2018; 138: 712−723. doi: 10.1161/CIRCULATIONAHA.117.029901
[33]
Kleinegris MC, ten Cate H, ten Cate-Hoek AJ. D-dimer as a marker for cardiovascular and arterial thrombotic events in patients with peripheral arterial disease. A systematic review. Thromb Haemost 2013; 110: 233−243. doi: 10.1160/TH13-01-0032
[34]
Giansante C, Fiotti N, Cattin L, et al. D-dimer and thrombin-antithrombin complexes in a random population sample: relationships with other cardiovascular risk factors. Thromb Haemost 1994; 71: 581−586. doi: 10.1055/s-0038-1642486
[35]
Mjelva Ø R, Pönitz V, Brügger-Andersen T, et al. Long-term prognostic utility of pentraxin 3 and D-dimer as compared to high-sensitivity C-reactive protein and B-type natriuretic peptide in suspected acute coronary syndrome. Eur J Prev Cardiol 2016; 23: 1130−1140. doi: 10.1177/2047487315619733
[36]
Stark K, Massberg S. Interplay between inflammation and thrombosis in cardiovascular pathology. Nat Rev Cardiol 2021; 18: 666−682. doi: 10.1038/s41569-021-00552-1
[37]
Eapen DJ, Manocha P, Patel RS, Hammadah M, Veledar E, Wassel C, Nanjundappa RA, Sikora S, Malayter D, Wilson PW, Sperling L, Quyyumi AA, Epstein SE. Aggregate risk score based on markers of inflammation, cell stress, and coagulation is an independent predictor of adverse cardiovascular outcomes. J Am Coll Cardiol 2013; 62: 329−337. doi: 10.1016/j.jacc.2013.03.072


 DownLoad: