Please cite this article as: WANG SH, YIN H, ZHOU SS. The relationship between geriatric nutritional risk index and cardiovascular disease and all-cause mortality in patients with osteoporosis and osteopenia. J Geriatr Cardiol 2025; 22(4): 443−454. DOI: 10.26599/1671-5411.2025.04.006.
Citation:
Please cite this article as: WANG SH, YIN H, ZHOU SS. The relationship between geriatric nutritional risk index and cardiovascular disease and all-cause mortality in patients with osteoporosis and osteopenia. J Geriatr Cardiol 2025; 22(4): 443−454. DOI: 10.26599/1671-5411.2025.04.006.
Please cite this article as: WANG SH, YIN H, ZHOU SS. The relationship between geriatric nutritional risk index and cardiovascular disease and all-cause mortality in patients with osteoporosis and osteopenia. J Geriatr Cardiol 2025; 22(4): 443−454. DOI: 10.26599/1671-5411.2025.04.006.
Citation:
Please cite this article as: WANG SH, YIN H, ZHOU SS. The relationship between geriatric nutritional risk index and cardiovascular disease and all-cause mortality in patients with osteoporosis and osteopenia. J Geriatr Cardiol 2025; 22(4): 443−454. DOI: 10.26599/1671-5411.2025.04.006.
The relationship between geriatric nutritional risk index and cardiovascular disease and all-cause mortality in patients with osteoporosis and osteopenia
The correlation between geriatric nutritional risk index (GNRI) and the prognosis of patients with osteoporosis or osteopenia has not been studied. This study aims to explore the relationship between GNRI and the cardiovascular disease (CVD) and all-cause mortality rates in elderly patients with osteoporosis or osteopenia.
METHODS
This study included 4756 patients with osteoporosis and osteopenia from five cycles of the National Health and Nutrition Examination Survey (NHANES). We used multivariable Cox regression and subgroup analyses to investigate the correlation between GNRI and mortality rates. The restricted cubic spline analysis was used to assess the dose-response relationship between GNRI and mortality risk. Mediation analysis was conducted to examine the mediating effect of chronic kidney disease on the relationship between nutritional risk and mortality.
RESULTS
During a median follow-up period of 114 months, a total of 1241 deaths (26.09%) occurred, including 300 deaths due to CVD (6.31%). In the fully adjusted Model 3, compared to the no-risk group, the risk group showed significantly increased all-cause mortality risk (HR = 2.05, 95% CI: 1.74–2.40) and CVD mortality risk (HR = 1.88, 95% CI: 1.30–2.71). The restricted cubic spline analysis indicated a non-linear association between GNRI and all-cause mortality risk as well as CVD mortality risk. The mediation analysis results indicated that chronic kidney disease mediates 16.9% of the effect of nutritional risk on all-cause mortality and 25.3% on CVD mortality risk.
CONCLUSIONS
GNRI can serve as a predictive factor for all-cause and CVD mortality rates in elderly patients with osteoporosis or osteopenia.
Among adults aged over 50 years, 10.2% have osteoporosis, and this figure is projected to increase to 13.6% by 2030.[1] Osteoporosis or osteopenia is a common cause of morbidity and mortality in the elderly.[2] A prospective study on elderly patients indicated that osteoporosis is the most significant risk factor for all-cause mortality (HR = 4.46, 95% CI: 1.82–10.91), followed by diabetes mellitus (HR = 2.17, 95% CI: 1.04–4.52) and hypertension (HR = 1.81, 95% CI: 1.09–3.03).[3] In the United States, osteoporosis affects approximately 8 million women and 2 million men, with related fractures being a common and preventable cause of death in up to 50% of older women.[4] Additionally, decreased bone density is associated with metabolic disorders such as diabetes mellitus (DM),[5] chronic kidney disease (CKD),[6] and cancer.[7] More importantly, low bone mass is considered an independent risk factor for cardiovascular disease (CVD) in older adults.[8] A previous meta-analysis indicated that individuals with low bone mass have a higher CVD mortality and event rate compared to those with normal bone mass, with a risk ratio of 1.2 to 1.4.[9]
Due to various risk factors associated with decreased nutrient intake and weight loss throughout the aging process, the risk of malnutrition in older adults increases.[10] Malnutrition in older adults is a challenging health issue that is associated not only with increased mortality and morbidity but also with physical decline, which has significant adverse effects on daily activities and overall quality of life.[11] Numerous studies have shown that older adults diagnosed with malnutrition through nutritional assessments are closely associated with increased mortality.[12–14] Furthermore, malnutrition is also linked to cardiac remodeling and poor CVD outcomes.[15] Patients with reduced bone density often suffer from nutritional deficiencies, which can, in turn, lead to a series of complications.[16] Research indicates that malnutrition weakens immune function, and the decline in immunity lead to chronic inflammation that damages bone tissue and impairs bone metabolic regulation, while persistent inflammation drives the progression of various diseases.[17] Bone loss and atherosclerosis share similar risk factors and pathophysiological mechanisms, with both pathological processes mutually reinforcing each other.[18] Moreover, the chronic inflammation caused by malnutrition also promotes the progression of atherosclerosis,[19] undoubtedly increasing the risk of CVD events in patients with reduced bone mass.
As a simple and objective index, the geriatric nutritional risk index (GNRI) overcomes the limitations of questionnaire-based tools by allowing clinicians to assess a patient’s nutritional status solely based on height, weight, and serum albumin levels.[20] Numerous studies have shown that the GNRI is associated with the prognosis of various diseases in the elderly.[21,22] However, to our knowledge, no studies have yet investigated the relationship between the GNRI and mortality in patients with bone loss or osteoporosis. Therefore, the aim of this study is to determine the association between the GNRI and all-cause mortality as well as CVD mortality in elderly patients with osteopenia and osteoporosis.
METHODS
Study Population
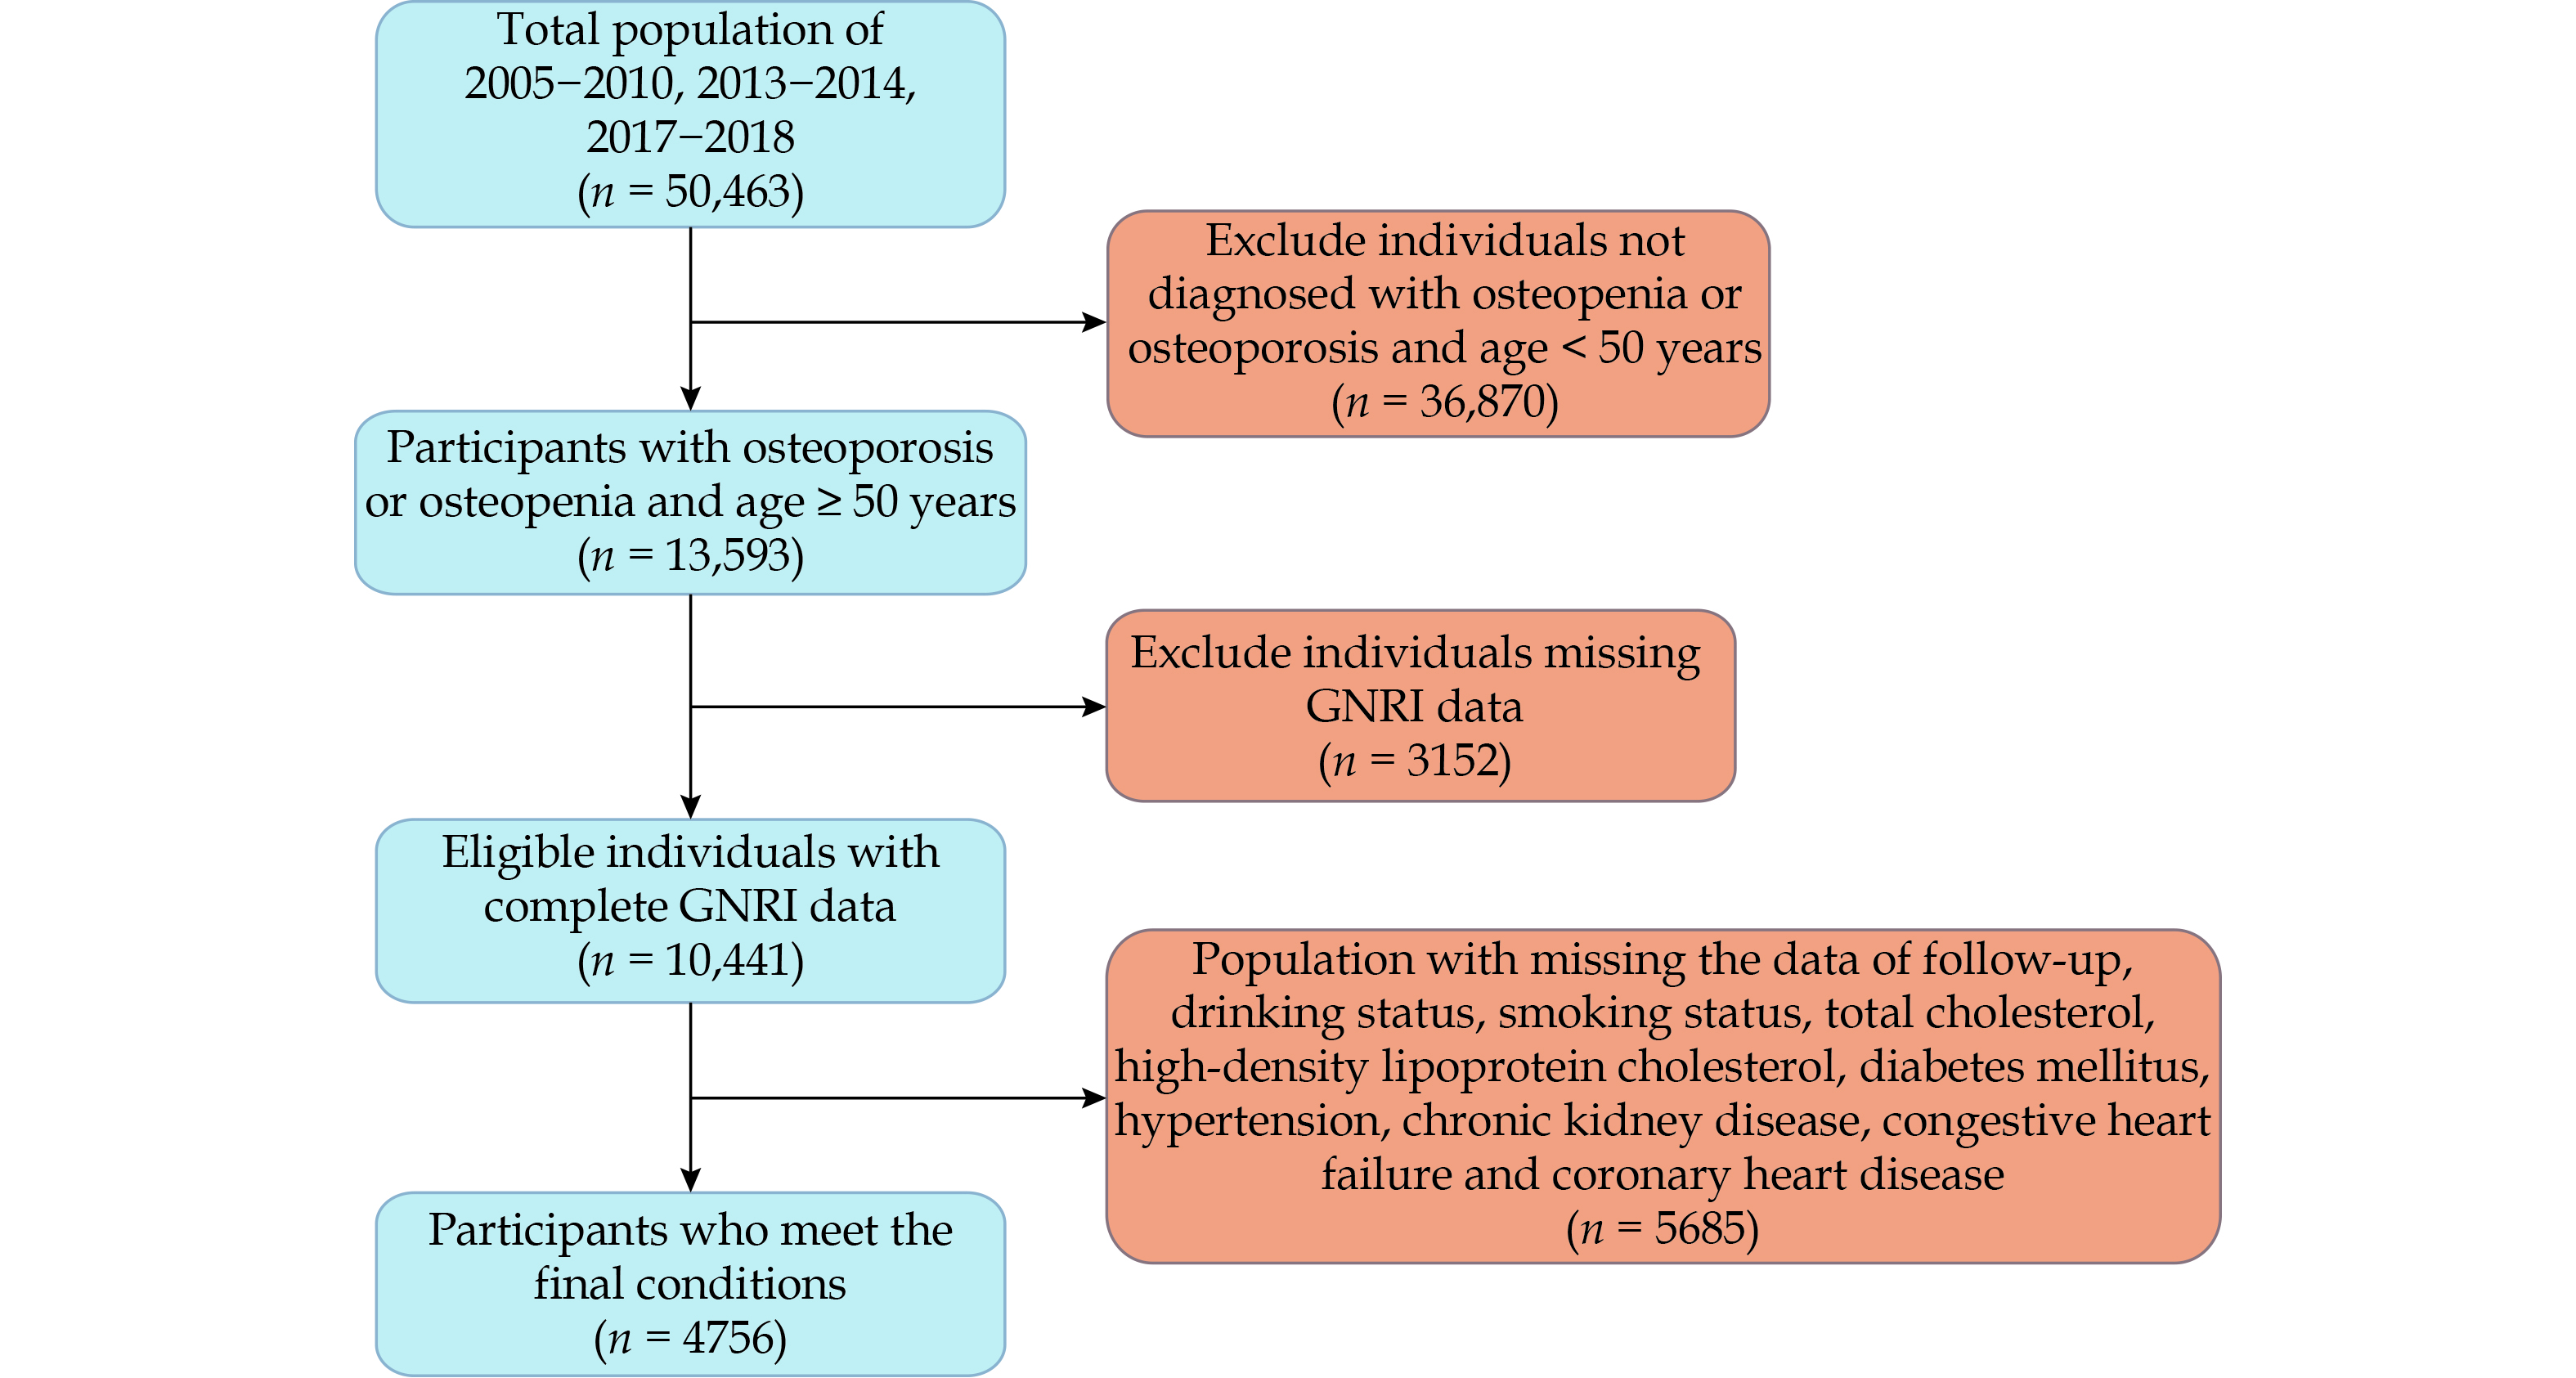
The National Health and Nutrition Examination Survey (NHANES) dataset contains bone density data necessary for this study only in five cycles, so data from the periods of 2005–2010, 2013–2014, and 2017–2018 were selected for this research. NHANES employs a stratified, complex multistage sampling design to randomly select a nationally representative sample of adults in the United States.[23] Health examinations and blood sample collections were conducted using the Mobile Examination Centers. This includes demographic data, dietary interviews, laboratory tests, and examinations conducted by trained personnel. Initially, 50,463 participants were included from the five cycles, of which 36,870 participants were excluded due to normal bone density or being younger than 50 years old. We further excluded 3152 patients lacking height, weight, and albumin data required to calculate the GNRI. Additionally, 5685 patients lacking important covariate data such as smoking, alcohol consumption, blood pressure, blood glucose, lipid levels, CKD, congestive heart failure (CHF), and coronary heart disease (CHD) were also excluded. Ultimately, 4756 elderly patients with bone loss or osteoporosis were included in this study, with a detailed flowchart provided in Figure 1. All participants provided informed consent, and the survey procedures were approved by the National Center for Health Statistics Research Ethics Review Board.
Bone Mineral Density (BMD) Measurements and Definition of Osteopenia or Osteoporosis
BMD (measured in g/cm2) was evaluated using a dual X-ray absorptiometry technique with the Hologic QDR-4500A fan beam densitometer (Hologic Inc.) while the participants visited the Mobile Examination Centers by trained and certified radiology technologists. A high level quality of data was strictly controlled by monitoring of field staff and densitometers, conducting expert review on 100% of participants and developing a rigorous phantom scanning schedule. According to the World Health Organization’s definition of osteopenia and osteoporosis in individuals aged 50 years and above, similar to the previous study,[24] we calculated the average and standard deviation of bone density in various parts of males and females aged 20–29 years as the reference. Osteopenia was defined as a BMD value being the reference mean minus 1 to 2.5 times the reference standard deviation. Osteoporosis was defined as a BMD value of more than 2.5 standard deviations below the reference mean.
GNRI
The GNRI is a simple nutritional assessment score for the elderly, yet it holds significant prognostic value across different medical population. According to prior research,[25] GNRI is calculated as follows: GNRI = [1.489 × serum albumin (g/L)] + [41.7 × (actual weight (kg)/ideal weight (kg))]. The Lorenz equation is used to calculate ideal body weight, where for males it is height (cm) - 100 - [(height (cm) - 150)/4] and for females it is height (cm) - 100 - [(height (cm) - 150)/2.5]. When patient’s weight exceeds the ideal weight, the ratio of actual to ideal weight is adjusted to 1. The GNRI values derived from the above calculations categorize the overall population into the low-risk group (GNRI ≥ 98) and the high-risk group (GNRI < 98).
Outcome Assessment
By matching records of NHANES patients with follow-up data on the National Center for Health Statistics mortality rates, all-cause mortality and CVD mortality were defined as outcome events, with follow-up ending on December 31, 2019. CVD mortality was defined as death due to CVD (I00-I09, I11, I13 and I20-I51).
Covariates
We selected the covariates for this study based on previous literature[17,26] and clinical experience. Lifestyle factors and demographic information, including sex, age, race, education level, marital status, smoking status, and drinking status, were obtained through standardized questionnaires during household interviews. Drinking status was categorized into four groups based on monthly alcohol consumption frequency: non-drinkers, 1–5 times per month, 5–10 times per month, and more than 10 times per month. Smoking status was categorized as follows: (1) “Never” was defined as having smoked fewer than 100 cigarettes in a lifetime; (2) “Current” was defined as having smoked more than 100 cigarettes in a lifetime and now smoking either occasionally or daily; and (3) “Former” was defined as having smoked more than 100 cigarettes in a lifetime but not currently smoking. Weight, height, blood pressure, and serum biomarker levels were measured through physical examinations and blood tests conducted at the Mobile Examination Centers. Body mass index (BMI) was calculated by dividing weight (kg) by height squared (m2). According to the World Health Organization standards, participants’ BMI levels were classified as < 25 kg/m2, 25–29.9 kg/m2, and ≥ 30 kg/m2, corresponding to normal weight, overweight, and obesity, respectively. Hypertension was defined as an average systolic blood pressure ≥ 140 mmHg or diastolic blood pressure ≥ 90 mmHg, determined through three separate measurements, a previous diagnosis of hypertension, or the use of antihypertensive medication. DM was diagnosed by a fasting blood glucose level ≥ 126 mg/dL, a glycated hemoglobin level ≥ 6.5%, a diagnosis of DM by a physician, or the current use of antidiabetic medications or insulin. According to the 2012 Kidney Disease: Improving Global Outcomes (KDIGO) clinical practice guideline,[27] CKD was defined using estimated glomerular filtration rate and urinary albumin-to-creatinine ratio, calculated using the Chronic Kidney Disease Epidemiology Collaboration (CKD-EPI) equation,[28] for each participant. CKD was diagnosed by the estimated glomerular filtration rate ≤ 60 mL/min per 1.73 m2 or an albumin-to-creatinine ratio ≥ 30 mg/g. The definitions of CHF and CHD were based on survey questions. Individuals who answered “yes” to the questions “Have you been diagnosed with CHF by a professional doctor?” and “Have you been diagnosed with CHD by a professional doctor?” were defined as having CHF and CHD, respectively.
Statistical Analysis
The characteristics of the study population were summarized by GNRI group: categorical variables were presented as unweighted numbers and weighted percentages, and continuous variables were presented as weighted medians and interquartile ranges. Comparisons of continuous variables between groups were performed using the Mann-Whitney U test, while comparisons of categorical variables were performed using the Pearson’s chi-squared test. Unadjusted Kaplan-Meier methods were employed to compare overall survival and non-CVD-free survival, with log-rank tests used to assess significance. We used the “survey” package to construct complex weighted Cox proportional hazards models, assessing the associations between GNRI and the risks of all-cause and CVD mortality. We further conducted a competing risks analysis of GNRI and CVD mortality using the “cmprsk” package and plotted the cumulative risk curves. Subgroup analyses were performed by grouping participants by age (≤ 65 years, > 65 years), sex (male, female), race (White, non-White), DM (yes, no), hypertension (yes, no), CKD (yes, no), CHD (yes, no), and CHF (yes, no). Interaction terms between subgroups were included in the fully adjusted models to derive interaction test results. We used the “rms” package to create restricted cubic spline plots for complex weighted Cox proportional hazards models, assessing the dose-response relationships between GNRI as a continuous variable and the outcomes. To obtain the optimal curve model, we determined the number of knots based on the Akaike’s information criterion. Finally, mediation analysis was conducted to evaluate the impact of GNRI on mortality risk through CKD. All data analyses were performed using R statistical software (version 4.3.3, R Foundation for Statistical Computing). Two-sided P-value < 0.05 were considered statistically significant.
RESULTS
Baseline Characteristics
Among the 4756 participants, there were 2390 males and 2366 females; however, after weighting, females comprised a higher percentage at 52.77%, while males accounted for 47.23%. Of whom, 4312 participants were in the low-risk group and 444 participants in the high-risk group. The weighted median age of all patients was 63.0 years. Non-Hispanic Whites constituted a higher percentage (81.64%), and most participants had completed high school or higher education and were married. The weighted median GNRI for the low-risk group was 104.2 points, while for the high-risk group, it was 95.3 points. Compared to the low-risk group, the high-risk group was more likely to be female, non-Hispanic Black, older, with lower educational levels, and a higher proportion of single individuals. Additionally, a greater proportion of patients were current smokers, non-drinkers, and had normal body weight, with lower total cholesterol levels. Furthermore, the high-risk group had a higher proportion of patients with CKD, osteoporosis, and CHF. There were no significant differences in the prevalence of high-density lipoprotein cholesterol levels, DM, hypertension, and CHD among different nutritional risk levels; further details are provided in Table 1.
Table
1.
Baseline characteristics of patients of osteopenia and osteoporosis in GNRI (category).
Variables
Overall (n = 35,419,263)
Non-risk group (n = 32,650,739)
Risk group (n = 2,768,525)
P-value
Sex
< 0.001
Female
2366 (52.77%)
2126 (52.08%)
240 (60.91%)
Male
2390 (47.23%)
2186 (47.92%)
204 (39.09%)
Age, yrs
63.0 (56.0–72.0)
62.0 (56.0–71.0)
68.0 (59.0–77.0)
< 0.001
Race
< 0.001
Mexican American
686 (4.56%)
634 (4.61%)
52 (4.01%)
Non-Hispanic Black
574 (5.29%)
482 (4.87%)
92 (10.26%)
Non-Hispanic White
2801 (81.64%)
2564 (82.19%)
237 (75.11%)
Other Hispanic
391 (2.94%)
361 (2.97%)
30 (2.51%)
Other race
304 (5.57%)
271 (5.35%)
33 (8.12%)
Education
0.010
< 9th grade
698 (6.86%)
624 (6.57%)
74 (10.28%)
9–11 grade
691 (11.19%)
607 (10.82%)
84 (15.55%)
High school or graduation
1161 (24.70%)
1057 (24.84%)
104 (23.06%)
Some college or associate of arts degree
1194 (28.78%)
1090 (28.93%)
104 (26.99%)
≥ college graduate
1012 (28.48%)
934 (28.85%)
78 (24.12%)
Marital status
< 0.001
Divorced
663 (13.86%)
597 (13.88%)
66 (13.73%)
Living with partner
122 (2.41%)
114 (2.44%)
8 (2.03%)
Married
2771 (63.56%)
2573 (64.67%)
198 (50.46%)
Never married
259 (4.85%)
229 (4.72%)
30 (6.41%)
Separated
134 (1.82%)
115 (1.77%)
19 (2.41%)
Widowed
807 (13.50%)
684 (12.53%)
123 (24.95%)
GNRI
104.2 (101.3–107.2)
104.2 (102.7–107.2)
95.3 (93.8–96.8)
< 0.001
Smoking status
< 0.001
Never
2208 (47.29%)
2048 (48.14%)
160 (37.23%)
Former
1708 (35.37%)
1544 (35.29%)
164 (36.25%)
Current
840 (17.35%)
720 (16.57%)
120 (26.52%)
Drinking status
0.004
Non-drinker
1479 (26.12%)
1313 (25.36%)
166 (34.98%)
1–5 drinks/month
2159 (45.37%)
1966 (45.45%)
193 (44.38%)
5–10 drinks/month
267 (7.09%)
248 (7.34%)
19 (4.13%)
10+ drinks/month
851 (21.42%)
785 (21.84%)
66 (16.51%)
Body mass index level
< 0.001
Normal
1621 (35.08%)
1391 (33.67%)
230 (51.70%)
Obese
1215 (25.82%)
1120 (26.17%)
95 (21.72%)
Overweight
1920 (39.10%)
1801 (40.16%)
119 (26.58%)
Total cholesterol, mg/dL
199.0 (172.0–227.0)
201.0 (173.0–229.0)
183.0 (156.0–214.0)
< 0.001
High-density lipoprotein cholesterol, mg/dL
54.0 (44.0–67.0)
54.0 (44.0–66.0)
55.0 (44.0–68.0)
0.297
Severity of osteoporosis
< 0.001
Osteopenia
3981 (85.16%)
3676 (86.63%)
305 (67.83%)
Osteoporosis
775 (14.84%)
636 (13.37%)
139 (32.17%)
Diabetes mellitus
0.114
Yes
1034 (16.15%)
931 (15.86%)
103 (19.51%)
No
3722 (83.85%)
3381 (84.14%)
341 (80.49%)
Hypertension
> 0.9
Yes
2908 (55.71%)
2638 (55.68%)
270 (56.06%)
No
1848 (44.29%)
1674 (44.32%)
174 (43.94%)
Chronic kidney disease
< 0.001
Yes
1278 (21.42%)
1104 (20.29%)
174 (34.79%)
No
3478 (78.58%)
3208 (79.71%)
270 (65.21%)
Congestive heart failure
0.002
Yes
230 (3.90%)
196 (3.61%)
34 (7.32%)
No
4526 (96.10%)
4116 (96.39%)
410 (92.68%)
Coronary heart disease
0.682
Yes
384 (6.95%)
344 (6.90%)
40 (7.56%)
No
4372 (93.05%)
404 (93.10%)
3968 (92.44%)
Categorical variables were presented as unweighted numbers (weighted percentages). Continuous variables were presented as weighted medians (weighted interquartile ranges). GNRI: geriatric nutritional risk index.
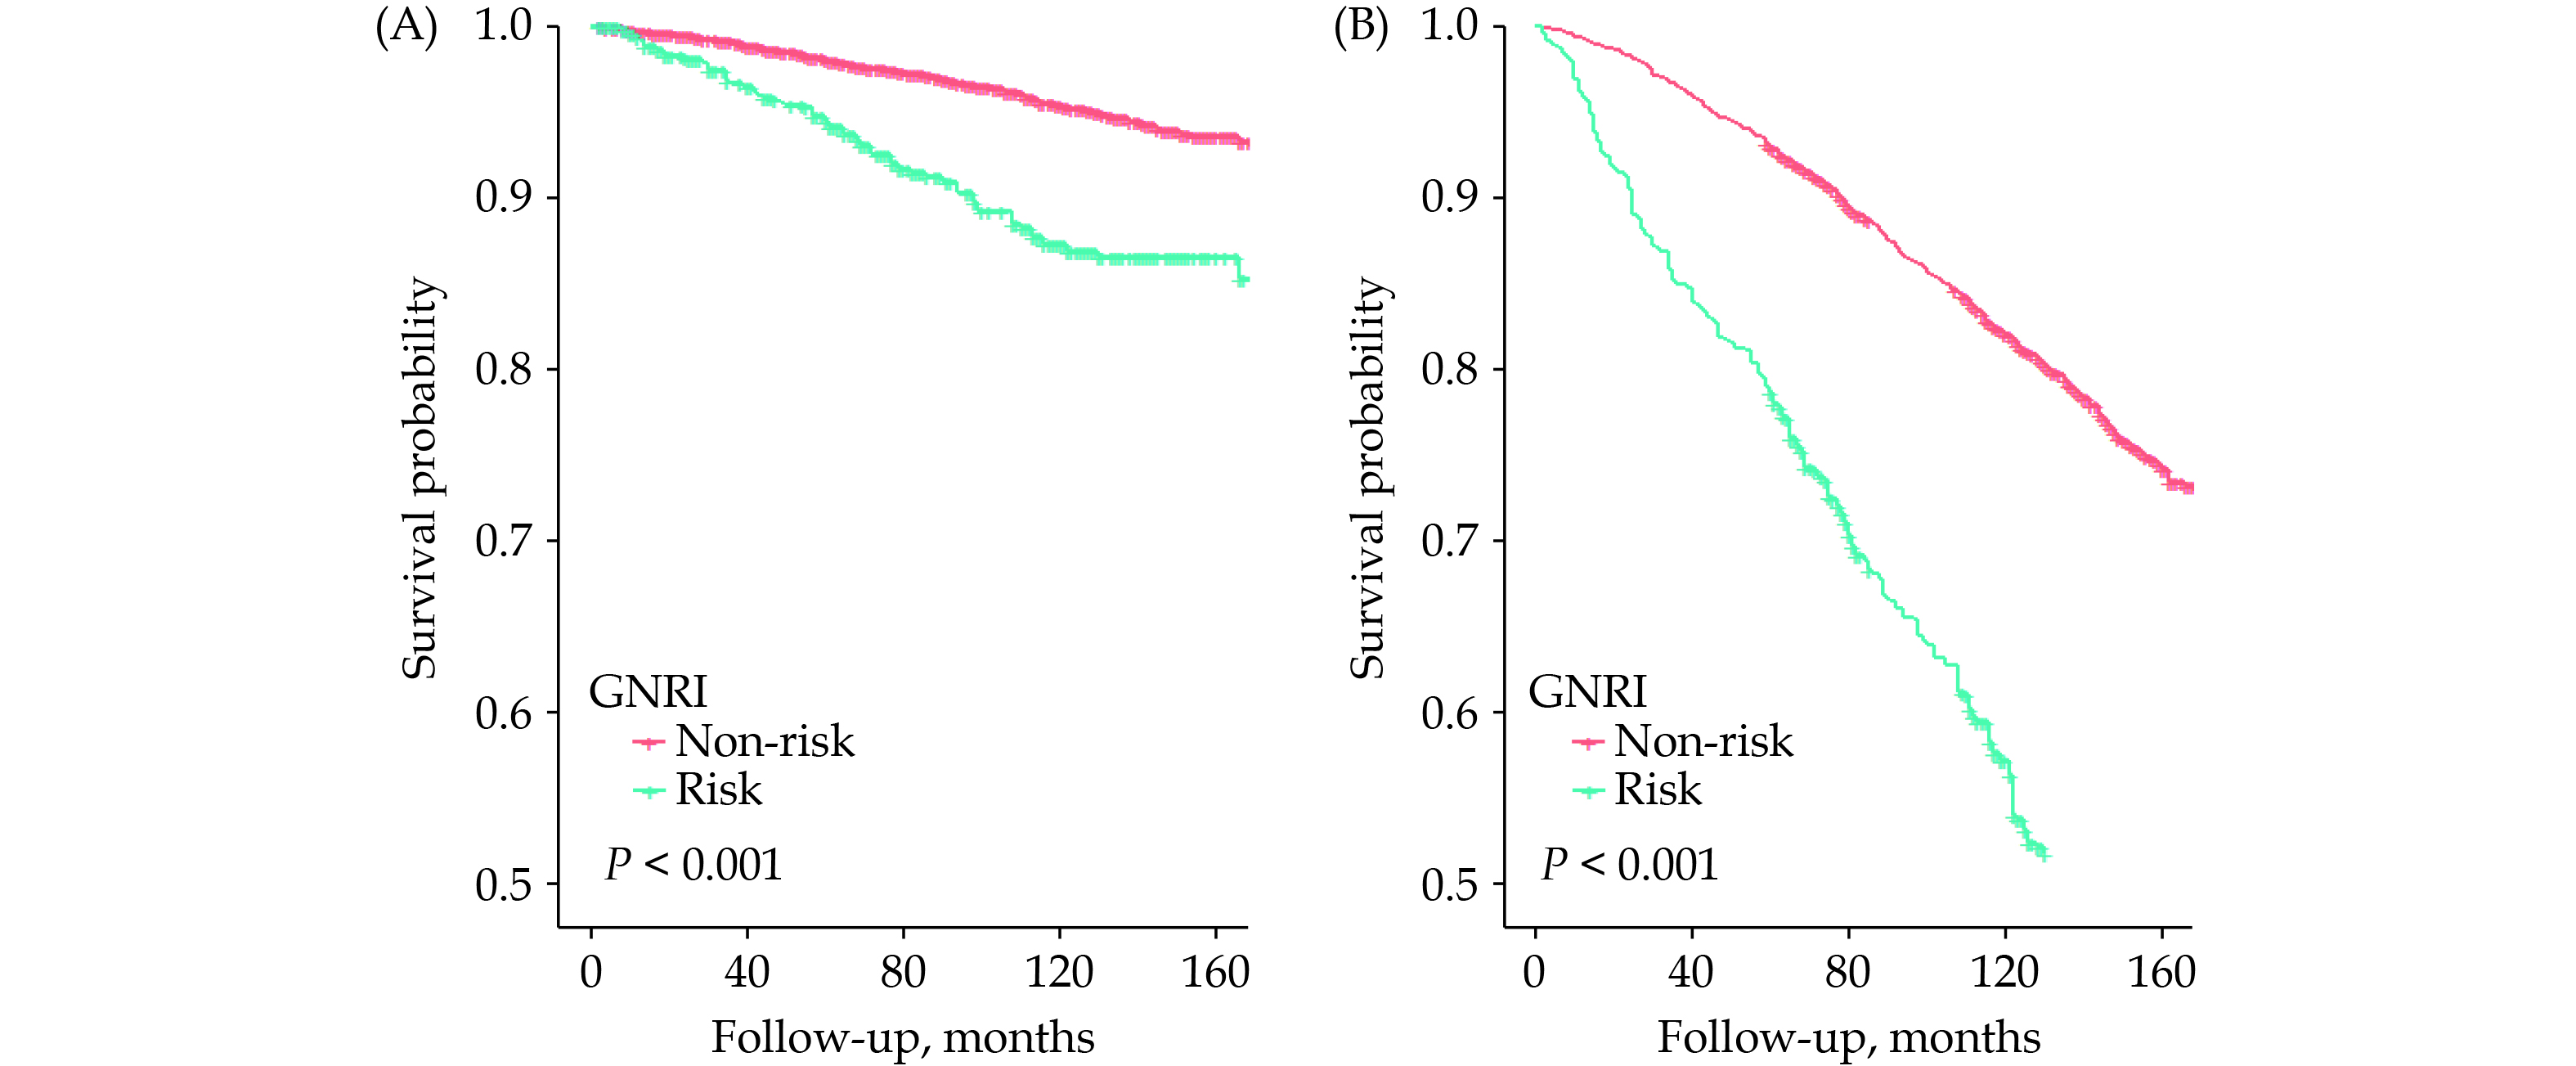
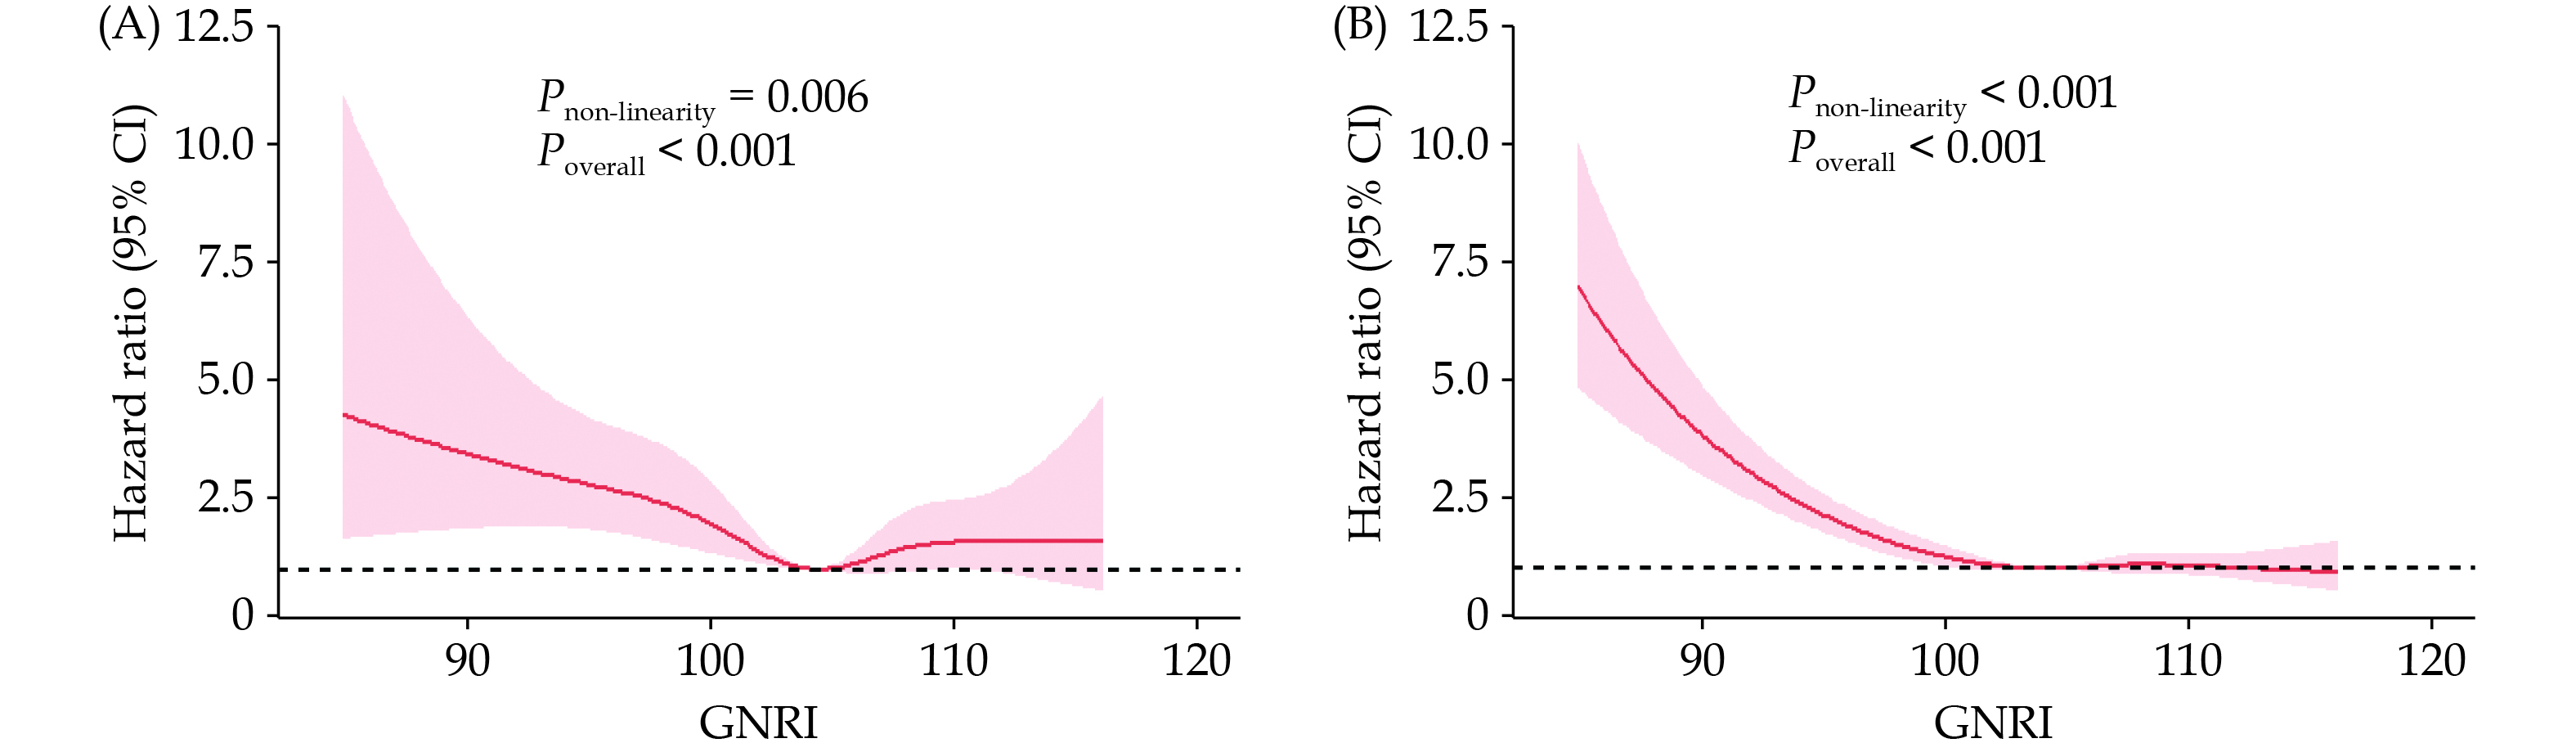
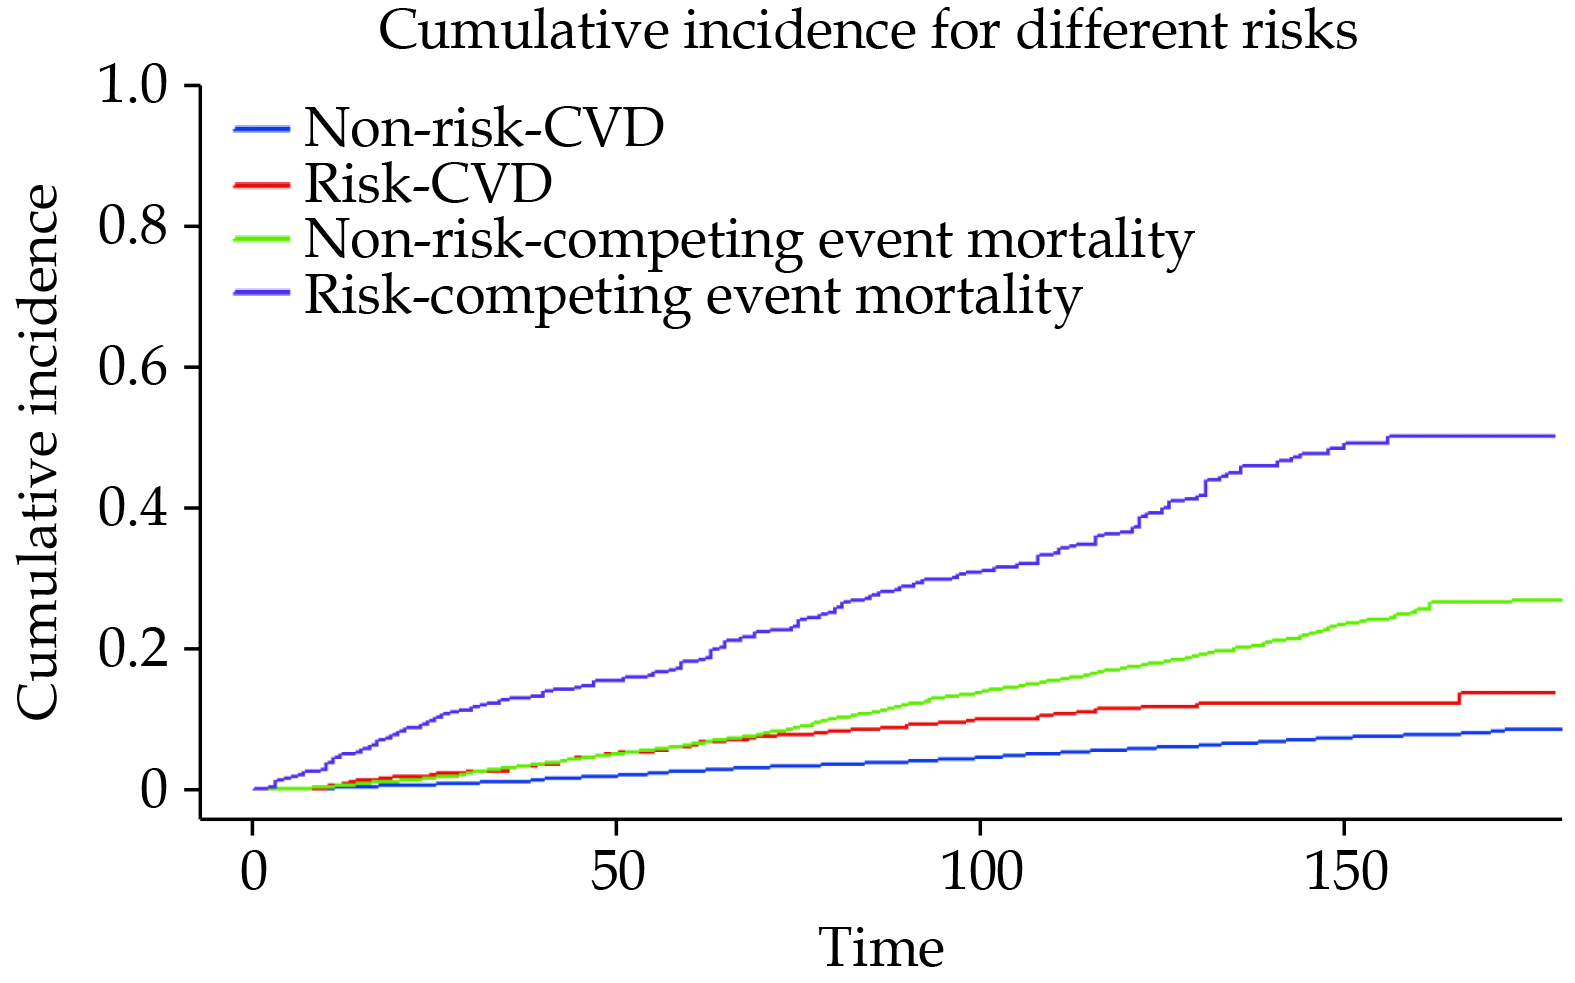
During a median follow-up of 114 months, a total of 300 patients (6.31%) died due to CVD causes. The Kaplan-Meier curve in Figure 2A indicates a significant difference in CVD mortality rates between the risk group and the non-risk group (log-rank P < 0.001). Table 2 presents the results of the multivariable Cox regression models. In Model 1, adjusted for age, the CVD mortality risk in the risk group was 1.85 (95% CI: 1.31–2.61) compared to the non-risk group. In Model 2, adjusted for variables in Model 1 plus the sex, race, education level, and marital status, the CVD mortality risk ratio between the risk group and the non-risk group was 1.88 (95% CI: 1.32–2.68). Model 3 further adjusted for variables in Model 2 plus the total cholesterol, high-density lipoprotein cholesterol, smoking status, alcohol consumption, BMI level, hypertension, DM, CKD, CHF, and CHD. In Model 3, the CVD mortality risk ratio for the risk group compared to the non-risk group was 1.88 (95% CI: 1.30–2.71). The dose-response relationship between GNRI and CVD mortality risk exhibited a non-linear (Pnon-linearity < 0.001) association (Figure 3A). We also plotted the cumulative risk curves for CVD mortality and competing events (Figure 4), which indicated that both CVD mortality risk and competing event mortality risk were higher in the risk group compared to the non-risk group. Further competing risk analysis based on Model 3 showed that the CVD mortality risk ratio for the risk group compared to the non-risk group was 1.39 (95% CI: 1.02–1.91).
Figure
2.
Weighted cumulative hazards of cardiovascular disease mortality (A) and all-cause mortality (B).
Table
2.
The relationships between GNRI (category) and mortality in osteopenia and osteoporosis.
Model 1
Model 2
Model 3
HR (95% CI)
P-value
HR (95% CI)
P-value
HR (95% CI)
P-value
All-cause mortality
GNRI category
Non-risk
Reference
Reference
Reference
Risk
2.32 (1.99–2.71)
< 0.001
2.30 (1.96–2.70)
< 0.001
2.05 (1.74–2.40)
< 0.001
CVD mortality
GNRI category
Non-risk
Reference
Reference
Reference
Risk
1.85 (1.31–2.61)
< 0.001
1.88 (1.32–2.68)
< 0.001
1.88 (1.30–2.71)
< 0.001
Model 1: adjusted for age. Model 2: adjusted for variables in Model 1 plus the sex, race, marital status, and education level. Model 3: adjusted for variables in Model 2 plus the total cholesterol, high-density lipoprotein cholesterol, smoking status, alcohol consumption, body mass index level, hypertension, diabetes mellitus, chronic kidney disease, congestive heart failure, and coronary heart disease. CVD: cardiovascular disease; GNRI: geriatric nutritional risk index.
Figure
4.
Cumulative risk curves for CVD death and competing events.
The blue line represents CVD mortality in individuals without nutritional risk, the red line represents CVD mortality in individuals with nutritional risk, the green line represents non-CVD cause mortality in individuals without nutritional risk, and the purple line represents non-CVD cause mortality in individuals with nutritional risk. CVD: cardiovascular disease.
During the follow-up period, there were a total of 1241 deaths (26.09%). In the univariate analysis, the all-cause mortality risk was significantly higher in the risk group compared to the non-risk group (log-rank P < 0.001). The Kaplan-Meier curve is shown in Figure 2B. Table 2 shows that from Model 1 to Model 3, the all-cause mortality risk ratios for the risk group compared to the non-risk group were 2.32 (95% CI: 1.99–2.71), 2.30 (95% CI: 1.96–2.70) and 2.05 (95% CI: 1.74–2.40), respectively. The restricted cubic spline plot (Figure 3B) indicated a significant negative association between GNRI and all-cause mortality; however, this relationship was also non-linear (Pnon-linearity < 0.001).
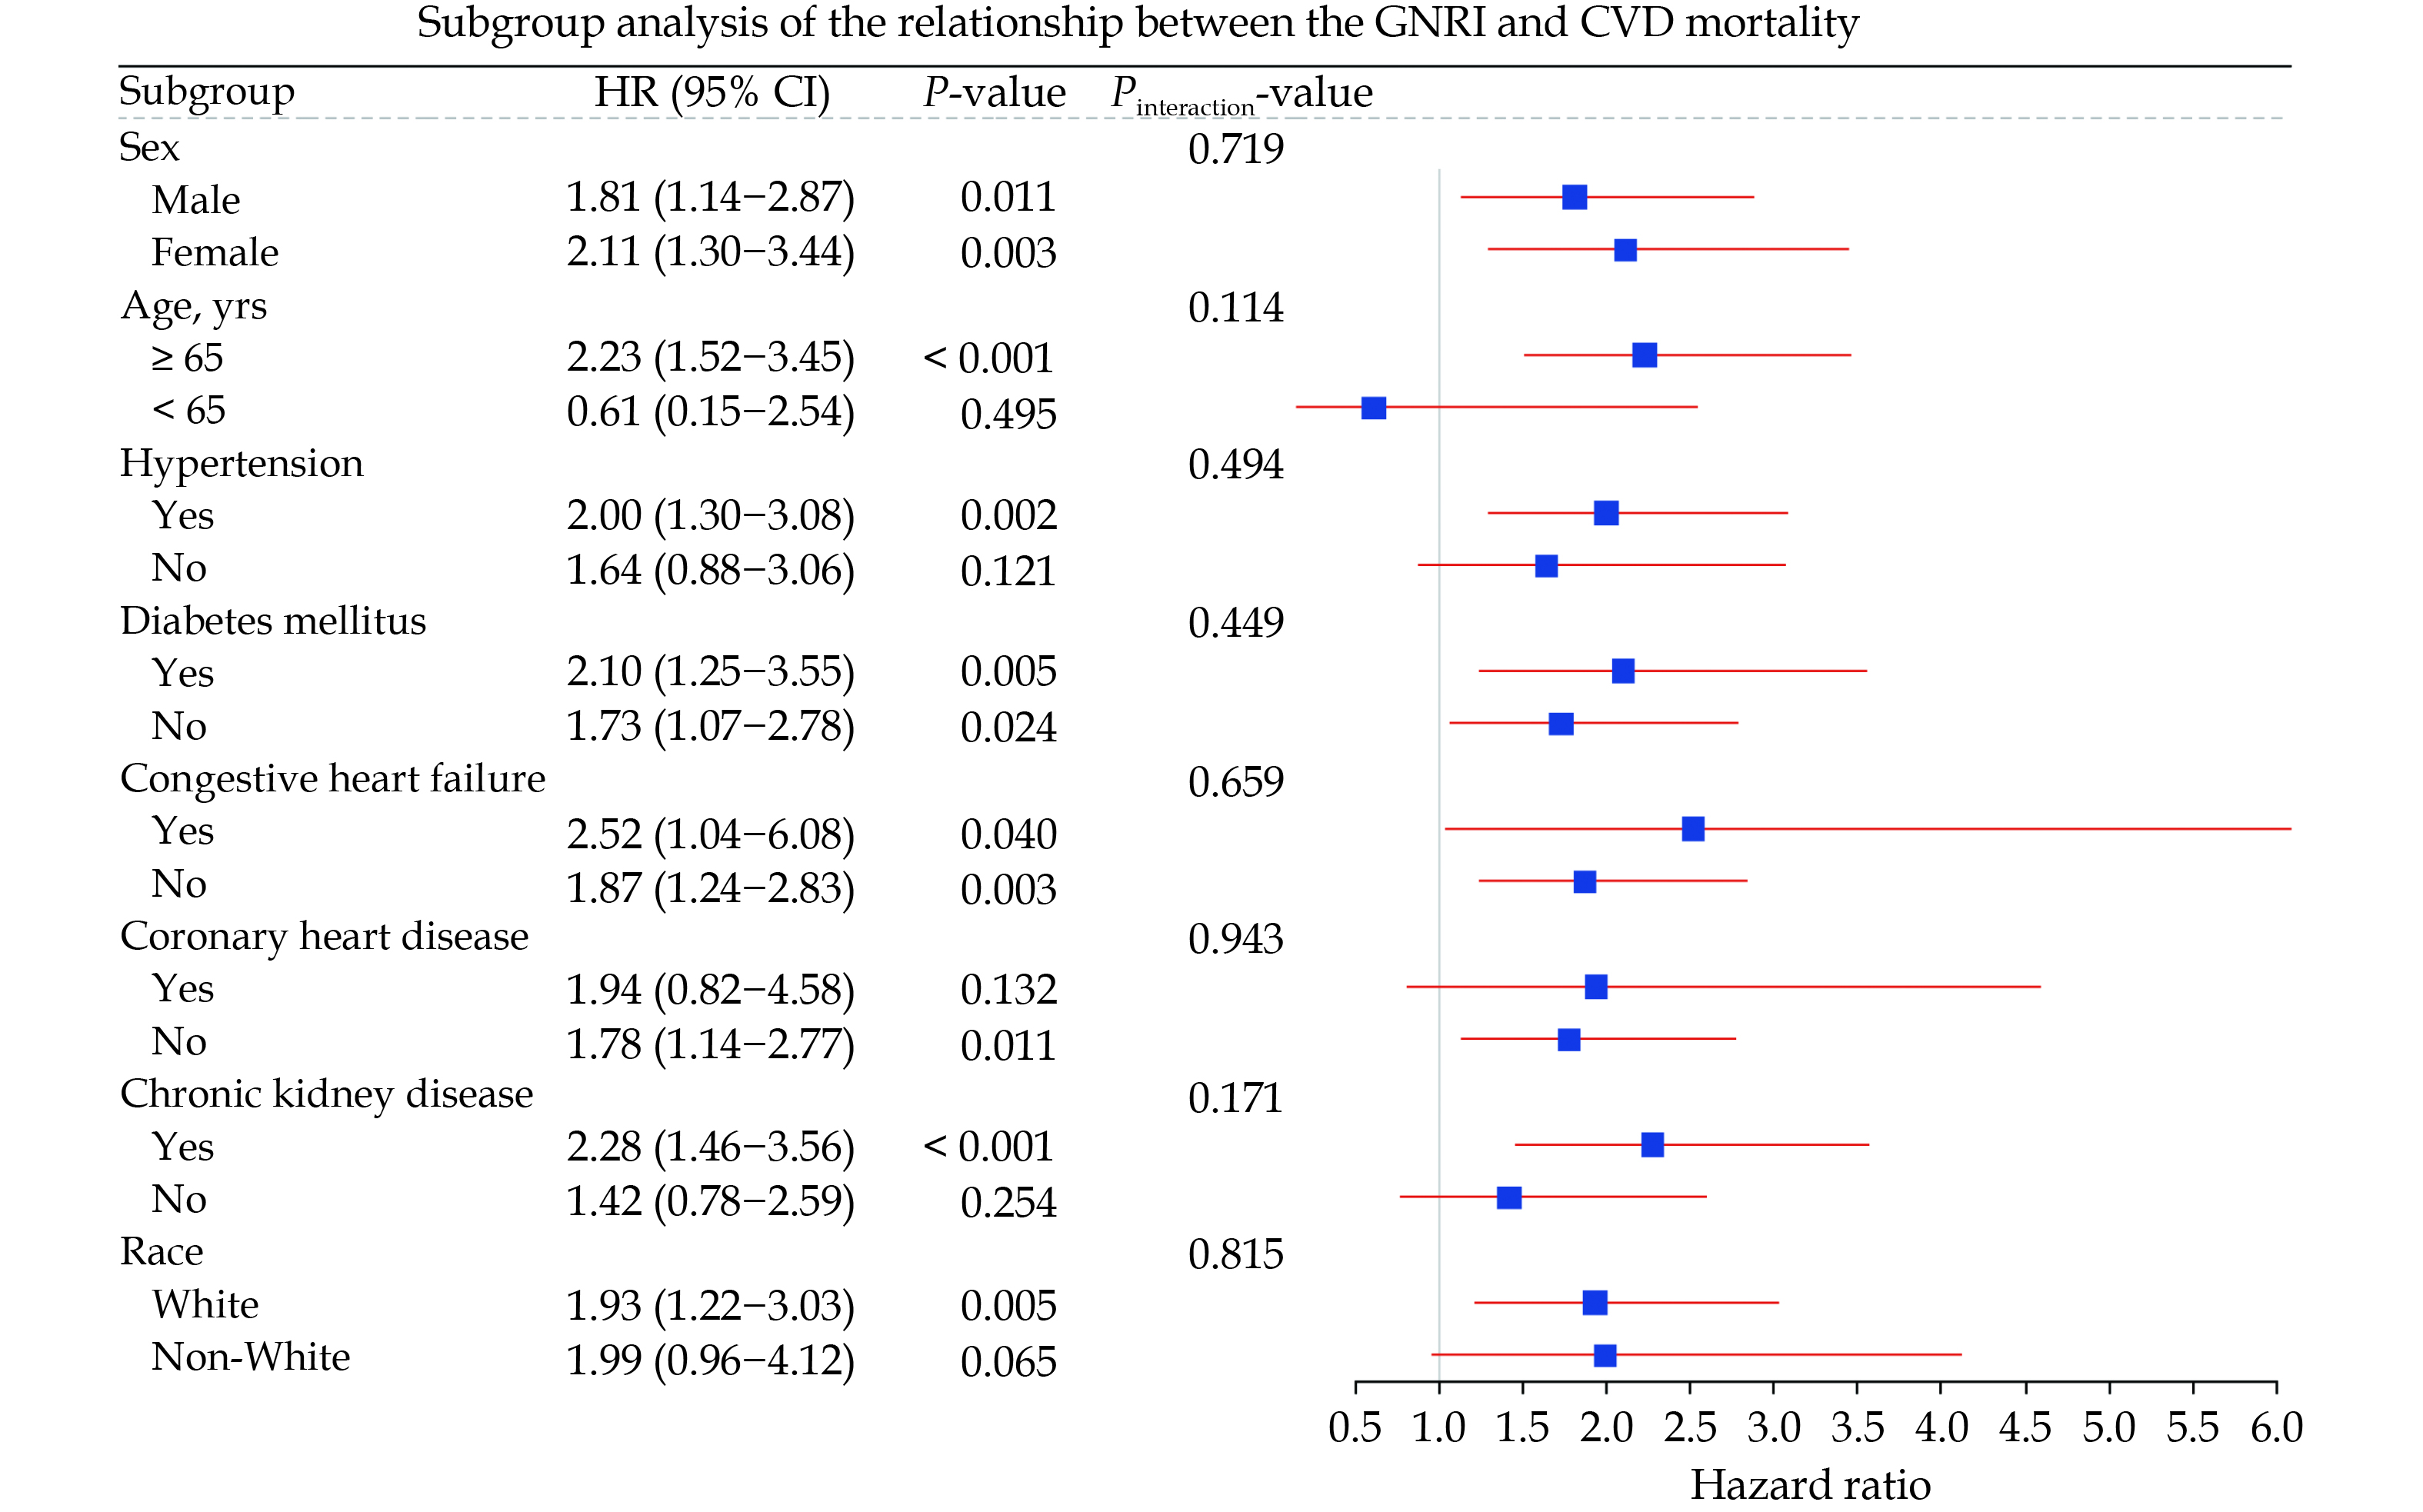
Subgroup Analyses
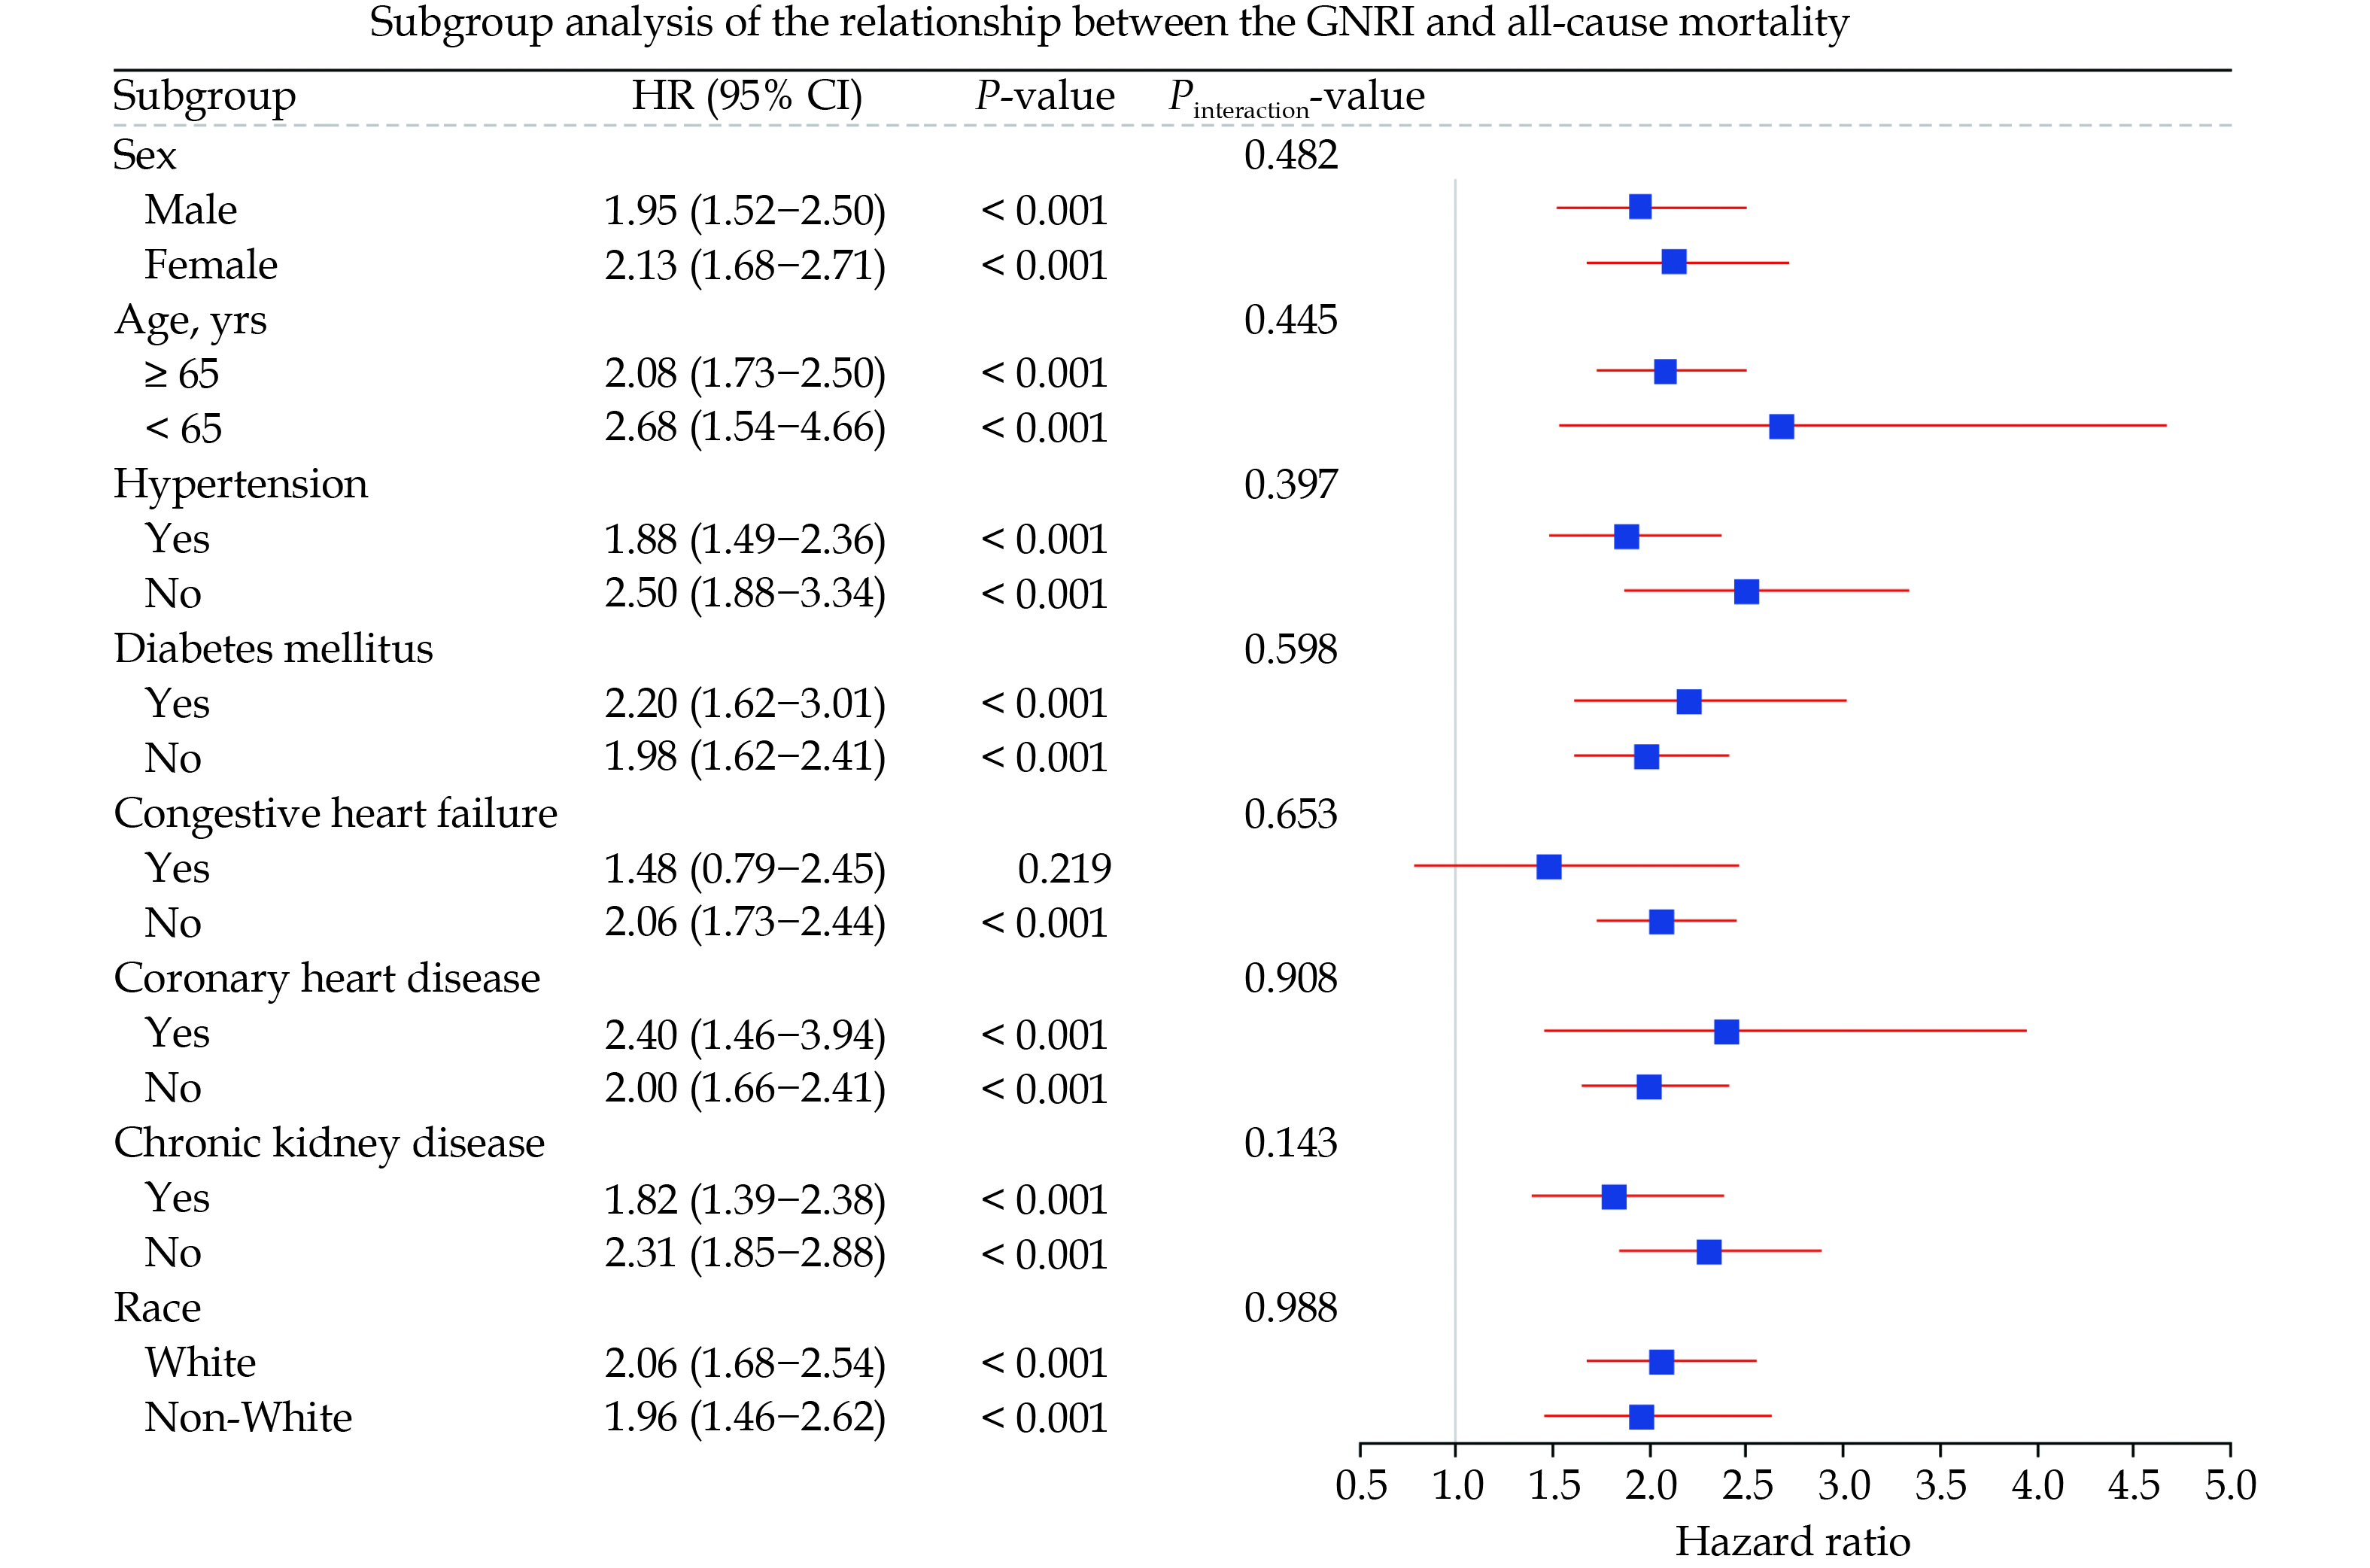
We presented the subgroup analysis results of GNRI with all-cause mortality and CVD mortality risk in the form of forest plots (Figures 5 & 6). Figure 5 indicates that, except for the CHF subgroup, the all-cause mortality risk in the risk group is significantly higher than that in the non-risk group across all other subgroups. Meanwhile, we did not find any interaction between different subgroups and nutritional risk. In Figure 6, the effect of nutritional risk on CVD mortality was not significant in the five subgroups of individuals aged under 65 years, non-White, non-CKD, non-hypertensive, and CHD, whereas a positive correlation between nutritional risk and CVD mortality was significant in all other subgroups. Similarly, we did not observe any interaction between subgroups and nutritional risk.
Figure
5.
Association of GNRI (category) with risk of all-cause mortality in subgroups.
All hazard ratios were adjusted for age, sex, race, marital status, education level, total cholesterol, high-density lipoprotein cholesterol, smoking status, alcohol consumption, body mass index level, hypertension, diabetes mellitus, chronic kidney disease, congestive heart failure, and coronary heart disease, except the stratification factor itself. GNRI: geriatric nutritional risk index.
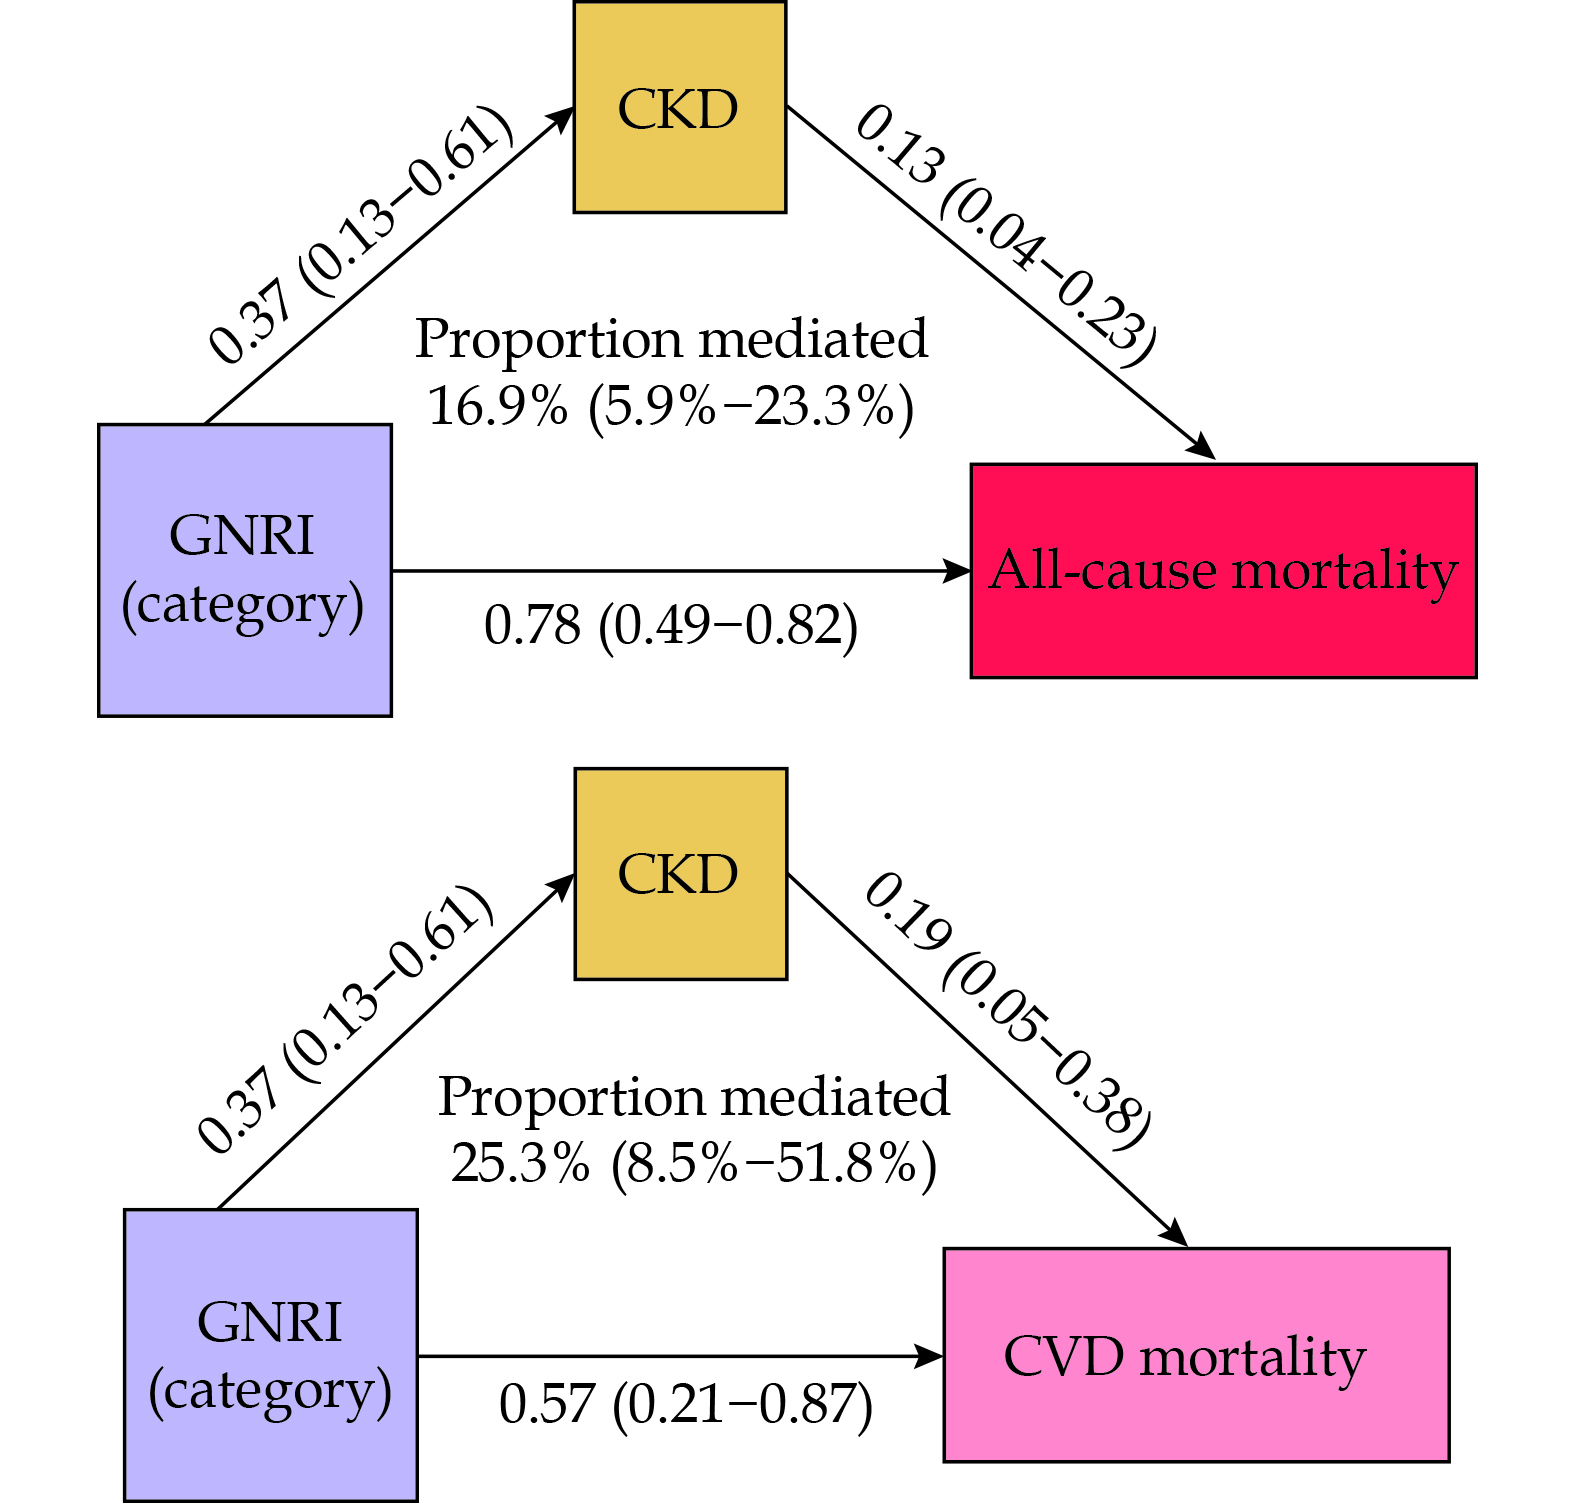
Mediation Analysis of GNRI for All-cause and CVD Mortality
Mediation analysis explored the mediating role of CKD in the impact of nutritional risk on all-cause and CVD mortality risk. The results indicate that nutritional risk is positively correlated with CKD (β = 0.37, 95% CI: 0.13–0.61), and CKD is positively correlated with CVD mortality (β = 0.19, 95% CI: 0.05–0.38) and all-cause mortality (β = 0.13, 95% CI: 0.04–0.23). Ultimately, 25.3% (95% CI: 8.5%–51.8%) and 16.9% (95% CI: 5.9%–23.3%) of the associations between GNRI and CVD and all-cause mortality risk are mediated by CKD (Figure 7).
Figure
7.
The mediating effect of CKD on the relationship between GNRI (category) and all-cause mortality (brown rectangle) or CVD mortality (pink rectangle).
Adjusted for age, sex, race, marital status, education level, total cholesterol, high-density lipoprotein cholesterol, smoking status, alcohol consumption, body mass index level, hypertension, diabetes mellitus, CKD, congestive heart failure, and coronary heart disease. CKD: chronic kidney disease; CVD: cardiovascular disease; GNRI: geriatric nutritional risk index.
To our knowledge, this is the first study to explore the association between the GNRI and the risk of all-cause and CVD mortality in elderly patients with osteoporosis or osteopenia. We analyzed the all-cause and CVD mortality rates of the two nutritional statuses using the Kaplan-Meier curves. The Cox regression model demonstrated that GNRI could serve as a novel indicator for assessing the prognosis of elderly patients with osteopenia and osteoporosis. Due to potential competing risks from other causes of death related to CVD mortality, we also performed a competing risk analysis of the relationship between GNRI and CVD mortality, and the results remained significant. Restricted cubic spline plots also indicated that the dose-response relationships between GNRI and both mortality rates are non-linear. In the subgroup analysis, the aforementioned results remained stable across most subgroups, with no significant interaction between different subgroups and GNRI; only a small portion of subgroups showed non-significant effect sizes. Finally, the mediation analysis results suggest that CKD plays a mediating role in the relationship between GNRI and both mortality rates, which may partially reveal the underlying mechanisms linking GNRI to mortality.
GNRI can be obtained by blood sampling, physical examination and simple calculation, which is better tolerated by the elderly and easier to follow up in the long term. A large number of studies have demonstrated that the GNRI is a reliable indicator of prognosis for a variety of diseases in elderly patients.[25,29–31] Previous studies have shown that GNRI is more effective in assessing prognosis than albumin or BMI alone,[32] and a study by Yenibertiz, et al.[33] in elderly patients with respiratory failure showed that GNRI was the best predictor of mortality risk compared to nutritional measures such as OPNI, NRS 2002, Nutric Scores, and others. Dialysis patients also concluded that GNRI was a better predictor of death compared to creatinine index.[34] In conclusion, GNRI is a simple and effective tool to assess the prognosis of elderly patients. However, the prognostic value of GNRI in elderly patients with osteoporosis or decreased bone mass is unclear.
A recent study by Huang, et al.[35] showed that GNRI is positively associated with BMD and is an independent protective factor against osteoporosis in older adults. On the one hand, it has been shown that high protein intake is beneficial in preventing the development of osteoporosis, while low protein levels are associated with reduced BMD.[36] On the other hand, BMI also plays a positive role on the skeleton in the elderly, and a recent study has shown that a high BMI favors the prevention of osteoporosis in the elderly.[37] In our study, people in the risk group had more severe osteoporosis compared to the non-risk group, which supports Huang’s findings. In addition, the risk group had a higher proportion of characteristics such as female, advanced age, non-Hispanic Blacks, low BMI, current smoking, and CKD, all of which were similar to Huang’s study. This difference is that the ratio of the number of people in the risk group to the number of people in the non-risk group was higher in our study, which may be related to the fact that the population of our study was itself elderly patients with bone loss. In addition, we found that the risk group had a higher percentage of patients with CHF. This highlights that nutritional management of patients with osteopenia should be accompanied by simultaneous control of comorbidities such as CKD and CHF. In addition, compared to a recent NHANES study[26] also on risk of death in elderly patients with osteoporosis, our study population had a higher mortality rate (26.09% vs. 21.75%, P < 0.05), which we hypothesized may be related to population selection bias. The restricted cubic spline showed a GNRI of less than 105, and a significant negative correlation between the GNRI and both all-cause and CVD mortality all showed a significant negative correlation, and with GNRI more than 105, the risk curve of all-cause death tended to be smooth, while the curve associated with the risk of CVD death tended to increase. This is similar to the results of a previous study.[31] This suggests that high GNRI exacerbates the risk of CVD death, and the underlying mechanisms may be related to overweight and overnutrition.
Decreased bone density is a chronic inflammation-related condition; inflammation contributes to bone loss while also promoting pathological processes such as atherosclerosis.[38] A high-risk GNRI score often indicates chronic inflammation and immune dysfunction, thereby facilitating the progression of the aforementioned pathological processes.[39] Additionally, individuals with poor bone health tend to engage in less physical activity, particularly those with fractures; prolonged bed rest significantly increases the risk of CVD.[8] Studies have shown that GNRI is an independent risk factor for fractures in elderly patients with osteoporosis, and there is evidence linking lower GNRI score to sarcopenia.[40] These factors can lead to limited physical capability, thereby increasing the risk of mortality.[41] Additionally, GNRI is often associated with various conditions in elderly individuals, including depression, cognitive decline, post-traumatic infections, CKD, and CVDs, exerting a synergistic effect.[22,42–45] This can further exacerbate the adverse outcome associated with malnutrition. In our study, we found that CKD mediates 17% and 25% of the effects of GNRI on all-cause and CVD mortality risk, respectively. In CKD, the consumption of protein and energy is part of the natural disease course, attributed to factors such as anorexia, declining renal function, the presence of uremic toxins, and various metabolic abnormalities in patients with renal insufficiency. Moreover, the malnutrition can, in turn, promote the further progression of CKD.[46] A recent study from Jilin University indicated that GNRI can better predict the progression of immunoglobulin A nephropathy to end-stage renal failure compared to other nutritional assessment systems.[47] The study suggests that GNRI is not merely a tool for assessing malnutrition but is also associated with systemic inflammatory responses. This may provide an alternative explanation for the higher risk of renal insufficiency in patients with low GNRI scores. Bone remodeling and vascular calcification involve many similar mechanisms, which partly explains the correlation between reduced bone mass and CVDs.[18] CKD accelerates these two pathological processes, promoting the further deterioration of osteoporosis and vascular calcification.[48] Furthermore, the immune dysfunction, oxidative stress, increased fluid overload, activation of the renin-angiotensin-aldosterone system, metabolic disorders, and the effects of uremic toxins associated with CKD further exacerbate the mortality risk and CVD mortality risk in the elderly population with reduced bone mass.
STRENGTH AND LIMITATION
Several advantages of this study are as follows: (1) firstly, it is the first to explore the correlation between GNRI and prognosis in patient with osteoporosis or reduced bone mass, providing a new indicator for the prognostic assessment of elderly patients with reduced bone mass; (2) secondly, in our multivariate regression model, we adjusted for as many influencing factors as possible and conducted competing risk and subgroup analyses to validate the reliability of the results; and (3) thirdly, we identified a mediating effect of renal insufficiency in the impact of GNRI on mortality through mediation analysis. However, this study also has several limitations. Firstly, the GNRI was obtained from a single measurement, which may not fully ensure the accuracy of the GNRI data. Secondly, there may be confounding variables affecting the outcomes that we did not account for, potentially introducing bias into the final results. Last but not least, the absence of necessary data for certain years and the exclusion of some participants due to incomplete data may have introduced selection bias, impacting the reliability of the results.
CONCLUSIONS
This study demonstrates that lower GNRI scores are associated with an increased risk of all-cause mortality and CVD mortality in elderly patients with osteoporosis or osteopenia. Both daily life and clinical attention should be paid to assessing nutritional status and maintaining balanced nutritional intake in elderly patients with osteoporosis or osteopenia.
ACKNOWLEDGMENTS
All authors had no conflicts of interest to disclose. The authors thank the NHANES and participants.
Harris K, Zagar CA, Lawrence KV. Osteoporosis: common questions and answers. Am Fam Physician 2023; 107: 238−246.
[2]
Johnston CB, Dagar M. Osteoporosis in older adults. Med Clin North Am 2020; 104: 873−884. doi: 10.1016/j.mcna.2020.06.004
[3]
Gutzwiller JP, Richterich JP, Stanga Z, et al. Osteoporosis, diabetes, and hypertension are major risk factors for mortality in older adults: an intermediate report on a prospective survey of 1467 community-dwelling elderly healthy pensioners in Switzerland. BMC Geriatr 2018; 18: 115.
[4]
Sweet MG, Sweet JM, Jeremiah MP, et al. Diagnosis and treatment of osteoporosis. Am Fam Physician 2009; 79: 193−200.
[5]
Ala M, Jafari RM, Dehpour AR. Diabetes mellitus and osteoporosis correlation: challenges and hopes. Curr Diabetes Rev 2020; 16: 984−1001.
[6]
Hyun YY, Lee KB, Han SH, et al. Risk factors and renal outcomes of low bone mineral density in patients with non-dialysis chronic kidney disease. Osteoporos Int 2020; 31: 2373−2382. doi: 10.1007/s00198-020-05531-9
[7]
Huang JF, Tan QC, Bai H, et al. Bone mineral density, osteopenia and osteoporosis among US adults with cancer. QJM 2022; 115: 653−660.
[8]
Yang Y, Huang Y. Association between bone mineral density and cardiovascular disease in older adults. Front Public Health 2023; 11: 1103403.
[9]
den Uyl D, Nurmohamed MT, van Tuyl LH, et al. (Sub)clinical cardiovascular disease is associated with increased bone loss and fracture risk; a systematic review of the association between cardiovascular disease and osteoporosis. Arthritis Res Ther 2011; 13: R5.
[10]
Corcoran C, Murphy C, Culligan EP, et al. Malnutrition in the elderly. Sci Prog 2019; 102: 171−180. doi: 10.1177/0036850419854290
[11]
Norman K, Haß U, Pirlich M. Malnutrition in older adults-recent advances and remaining challenges. Nutrients 2021; 13: 2764. doi: 10.3390/nu13082764
[12]
Kaegi-Braun N, Mueller M, Schuetz P, et al. Evaluation of nutritional support and in-hospital mortality in patient with malnutrition. JAMA Netw Open 2021; 4: e2033433. doi: 10.1001/jamanetworkopen.2020.33433
[13]
Fielding RA, Landi F, Smoyer KE, et al. Association of anorexia/appetite loss with malnutrition and mortality in older populations: a systematic literature review. J Cachexia Sarcopenia Muscle 2023; 14: 706−729. doi: 10.1002/jcsm.13186
[14]
de Sire A, Ferrillo M, Lippi L, et al. Sarcopenic dysphagia, malnutrition, and oral frailty in elderly: a comprehensive review. Nutrients 2022; 14: 982. doi: 10.3390/nu14050982
[15]
Chien SC, Chandramouli C, Lo CI, et al. Associations of obesity and malnutrition with cardiac remodeling and cardiovascular outcomes in Asian adults: a cohort study. PLoS Med 2021; 18: e1003661. doi: 10.1371/journal.pmed.1003661
[16]
Han TS, Yeong K, Lisk R, et al. Prevalence and consequences of malnutrition and malnourishment in older individual admitted to hospital with a hip fracture. Eur J Clin Nutr 2021; 75: 645−652. doi: 10.1038/s41430-020-00774-5
[17]
Shangguan X, Xiong J, Shi S, et al. Impact of the malnutrition on mortality in patients with osteoporosis: a cohort study from NHANES 2005-2010. Front Nutr 2022; 9: 868166. doi: 10.3389/fnut.2022.868166
[18]
Azeez TA. Osteoporosis and cardiovascular disease: a review. Mol Biol Rep 2023; 50: 1753−1763. doi: 10.1007/s11033-022-08088-4
[19]
Shimabukuro M. IGF-1 and cardiovascular and non-cardiovascular mortality risk in patients with chronic kidney disease: a model of “Malnutrition-Inflammation-Atherosclerosis Syndrome”. J Atheroscler Thromb 2022; 29: 1138−1139. doi: 10.5551/jat.ED197
[20]
Chen Z, Hao Q, Sun R, et al. Predictive value of the geriatric nutrition risk index for postoperative delirium in elderly patients undergoing cardiac surgery. CNS Neurosci Ther 2024; 30: e14343. doi: 10.1111/cns.14343
[21]
Xiong J, Wang M, Wang J, et al. Geriatric nutrition risk index is associated with renal progression, cardiovascular events and all-cause mortality in chronic kidney disease. J Nephrol 2020; 33: 783−793. doi: 10.1007/s40620-019-00676-1
[22]
Kregel HR, Murphy PB, Attia M, et al. The geriatric nutritional risk index as a predictor of complications in geriatric trauma patients. J Trauma Acute Care Surg 2022; 93: 195−199. doi: 10.1097/TA.0000000000003588
[23]
Shen R, Guo X, Zou T, et al. Associations of cardiovascular health assessed by life’s essential 8 with diabetic retinopathy and mortality in type 2 diabetes. Prim Care Diabetes 2023; 17: 420−428. doi: 10.1016/j.pcd.2023.08.001
[24]
Hou W, Chen S, Zhu C, et al. Associations between smoke exposure and osteoporosis or osteopenia in a US NHANES population of elderly individuals. Front Endocrinol (Lausanne) 2023; 14: 1074574. doi: 10.3389/fendo.2023.1074574
[25]
Cheng K, Zhang J, Ye LY, et al. Geriatric nutrition risk index in the prediction of all-cause and cardiovascular mortality in older adults with hyperlipidemia: NHANES 1999-2018. BMC Geriatr 2024; 24: 634. doi: 10.1186/s12877-024-05232-6
[26]
Liang Z, Lan J, Sun X, et al. Physical activity attenuates the excess mortality risk from prolonged sitting time among adults with osteoporosis or osteopenia. Endocrine 2024; 85: 1365−1378. doi: 10.1007/s12020-024-03871-8
[27]
Inker LA, Astor BC, Fox CH, et al. KDOQI US commentary on the 2012 KDIGO clinical practice guideline for the evaluation and management of CKD. Am J Kidney Dis 2014; 63: 713−735. doi: 10.1053/j.ajkd.2014.01.416
[28]
Levey AS, Stevens LA, Schmid CH, et al. A new equation to estimate glomerular filtration rate. Ann Intern Med 2009; 150: 604−612. doi: 10.7326/0003-4819-150-9-200905050-00006
[29]
Liu L, Chen Y, Xie J. Association of GNRI, NLR, and FT3 with the clinical prognosis of older patients with heart failure. Int Heart J 2022; 63: 1048−1054. doi: 10.1536/ihj.22-306
[30]
Zhao D, Zhou D, Li T, et al. The relationship between geriatric nutritional risk index (GNRI) and in-hospital mortality in critically ill patients with acute kidney injury (AKI). BMC Anesthesiol 2024; 24: 313. doi: 10.1186/s12871-024-02689-1
[31]
Shen X, Yang L, Gu X, et al. Geriatric nutrition risk index as predictor of cardiovascular and all-cause mortality in older Americans with diabetes. Diabetol Metab Syndr 2023; 15: 89. doi: 10.1186/s13098-023-01060-7
[32]
Bouillanne O, Morineau G, Dupont C, et al. Geriatric nutritional risk index: a new index for evaluating at-risk elderly medical patients. Am J Clin Nutr 2005; 82: 777−783. doi: 10.1093/ajcn/82.4.777
[33]
Yenibertiz D, Cirik MO. The comparison of GNRI and other nutritional indexes on the short-term survival in geriatric patient treated for respiratory failure. Aging Clin Exp Res2021; 33: 611−617. doi: 10.1007/s40520-020-01740-8
[34]
Yamada S, Yamamoto S, Fukuma S, et al. Geriatric nutritional risk index (GNRI) and creatinine index equally predict the risk of mortality in hemodialysis patients: J-DOPPS. Sci Rep 2020; 10: 5756. doi: 10.1038/s41598-020-62720-6
[35]
Huang W, Xiao Y, Wang H, et al. Association of geriatric nutritional risk index with the risk of osteoporosis in the elderly population in the NHANES. Front Endocrinol (Lausanne) 2022; 13: 965487. doi: 10.3389/fendo.2022.965487
[36]
Afshinnia F, Wong KK, Sundaram B, et al. Hypoalbuminemia and osteoporosis: reappraisal of a controversy. J Clin Endocrinol Metab 2016; 101: 167−175. doi: 10.1210/jc.2015-3212
[37]
Han H, Li R, Fu D, et al. Correlation between bone density, bone metabolism markers with lipid metabolism markers and body mass index. BMC Musculoskelet Disord 2024; 25: 162. doi: 10.1186/s12891-024-07284-6
[38]
Qu X, Huang X, Jin F, et al. Bone mineral density and all-cause, cardiovascular and stroke mortality: a meta-analysis of prospective cohort studies. Int J Cardiol 2013; 166: 385−393. doi: 10.1016/j.ijcard.2011.10.114
[39]
Iddir M, Brito A, Dingeo G, et al. Strengthening the immune system and reducing inflammation and oxidative stress through diet and nutrition: considerations during the COVID-19 crisis. Nutrients 2020; 12: 1562. doi: 10.3390/nu12061562
[40]
Shiroma K, Tanabe H, Takiguchi Y, et al. A nutritional assessment tool, GNRI, predicts sarcopenia and its components in type 2 diabetes mellitus: a Japanese cross-sectional study. Front Nutr 2023; 10: 1087471. doi: 10.3389/fnut.2023.1087471
[41]
Wang P, Cui H, Wang Z, et al. The association of nutritional status and physical activity on osteoporotic refractures among older adults. Geriatr Nurs 2024; 55: 130−135. doi: 10.1016/j.gerinurse.2023.10.018
[42]
Li Z, Zhang L, Yang Q, et al. Association between geriatric nutritional risk index and depression prevalence in the elderly population in NHANES. BMC Public Health 2024; 24: 469. doi: 10.1186/s12889-024-17925-z
[43]
Xu X, Li D, Zhang S. Retrospective study for correlation analysis of nutritional statu with osteoporosis, sarcopenia and cognitive impairment in elderly patients with coronary heart disease. Front Cardiovasc Med 2024; 10: 1335572. doi: 10.3389/fcvm.2023.1335572
[44]
Nakagawa N, Maruyama K, Hasebe N. Utility of geriatric nutritional risk index in patients with chronic kidney disease: a mini-review. Nutrients 2021; 13: 3688. doi: 10.3390/nu13113688
[45]
Li H, Cen K, Sun W, et al. Prognostic value of geriatric nutritional risk index in elderly patients with heart failure: a meta-analysis. Aging Clin Exp Res 2021; 33: 1477−1486. doi: 10.1007/s40520-020-01656-3
[46]
Kim EJ, Cho A, Kim DH, et al. Geriatric nutritional risk index as a prognostic factors for renal progression in patients with type 2 diabetes mellitus. Nutrients 2023; 15: 4636.
[47]
Qian C, Li H, Hou Y, et al. Clinical implications of four different nutritional indexes in patients with IgA nephropathy. Front Nutr 2024; 11: 1431910.
[48]
Seifert ME, Hruska KA. The kidney-vascular-bone axis in the chronic kidney disease-mineral bone disorder. Transplantation 2016; 100: 497−505.
Table
2.
The relationships between GNRI (category) and mortality in osteopenia and osteoporosis.
Model 1
Model 2
Model 3
HR (95% CI)
P-value
HR (95% CI)
P-value
HR (95% CI)
P-value
All-cause mortality
GNRI category
Non-risk
Reference
Reference
Reference
Risk
2.32 (1.99–2.71)
< 0.001
2.30 (1.96–2.70)
< 0.001
2.05 (1.74–2.40)
< 0.001
CVD mortality
GNRI category
Non-risk
Reference
Reference
Reference
Risk
1.85 (1.31–2.61)
< 0.001
1.88 (1.32–2.68)
< 0.001
1.88 (1.30–2.71)
< 0.001
Model 1: adjusted for age. Model 2: adjusted for variables in Model 1 plus the sex, race, marital status, and education level. Model 3: adjusted for variables in Model 2 plus the total cholesterol, high-density lipoprotein cholesterol, smoking status, alcohol consumption, body mass index level, hypertension, diabetes mellitus, chronic kidney disease, congestive heart failure, and coronary heart disease. CVD: cardiovascular disease; GNRI: geriatric nutritional risk index.


 DownLoad: