Please cite this article as: CUI JG, TIAN F, MIAO YH, JIN QH, SHI YJ, LI L, SHEN MJ, XIE XM, ZHANG S L, CHEN YD. Accurate diagnosis of severe coronary stenosis based on resting magnetocardiography: a prospective, single-center, cross-sectional analysis. J Geriatr Cardiol 2024; 21(4): 407−420. DOI: 10.26599/1671-5411.2024.04.006.
Citation:
Please cite this article as: CUI JG, TIAN F, MIAO YH, JIN QH, SHI YJ, LI L, SHEN MJ, XIE XM, ZHANG S L, CHEN YD. Accurate diagnosis of severe coronary stenosis based on resting magnetocardiography: a prospective, single-center, cross-sectional analysis. J Geriatr Cardiol 2024; 21(4): 407−420. DOI: 10.26599/1671-5411.2024.04.006.
Please cite this article as: CUI JG, TIAN F, MIAO YH, JIN QH, SHI YJ, LI L, SHEN MJ, XIE XM, ZHANG S L, CHEN YD. Accurate diagnosis of severe coronary stenosis based on resting magnetocardiography: a prospective, single-center, cross-sectional analysis. J Geriatr Cardiol 2024; 21(4): 407−420. DOI: 10.26599/1671-5411.2024.04.006.
Citation:
Please cite this article as: CUI JG, TIAN F, MIAO YH, JIN QH, SHI YJ, LI L, SHEN MJ, XIE XM, ZHANG S L, CHEN YD. Accurate diagnosis of severe coronary stenosis based on resting magnetocardiography: a prospective, single-center, cross-sectional analysis. J Geriatr Cardiol 2024; 21(4): 407−420. DOI: 10.26599/1671-5411.2024.04.006.
To evaluate the role of resting magnetocardiography in identifying severe coronary artery stenosis in patients with suspected coronary artery disease.
METHODS
A total of 513 patients with angina symptoms were included and divided into two groups based on the extent of coronary artery disease determined by angiography: the non-severe coronary stenosis group (< 70% stenosis) and the severe coronary stenosis group (≥ 70% stenosis). The diagnostic model was constructed using magnetic field map (MFM) parameters, either individually or in combination with clinical indicators. The performance of the models was evaluated using receiver operating characteristic curves, accuracy, sensitivity, specificity, positive predictive value (PPV) and negative predictive value (NPV). Calibration plots and decision curve analysis were performed to investigate the clinical utility and performance of the models, respectively.
RESULTS
In the severe coronary stenosis group, QR_MCTDd, S_MDp, and TT_MAC50 were significantly higher than those in the non-severe coronary stenosis group (10.46 ± 10.66 vs. 5.11 ± 6.07, P < 0.001; 7.2 ± 8.64 vs. 4.68 ± 6.95, P = 0.003; 0.32 ± 57.29 vs. 0.26 ± 57.29, P < 0.001). While, QR_MVamp, R_MA, and T_MA in the severe coronary stenosis group were lower (0.23 ± 0.16 vs. 0.28 ± 0.16, P < 0.001; 55.06 ± 48.68 vs. 59.24 ± 53.01, P < 0.001; 51.67 ± 39.32 vs. 60.45 ± 51.33, P < 0.001). Seven MFM parameters were integrated into the model, resulting in an area under the curve of 0.810 (95% CI: 0.765–0.855). The sensitivity, specificity, PPV, NPV, and accuracy were 71.7%, 80.4%, 93.3%, 42.8%, and 73.5%; respectively. The combined model exhibited an area under the curve of 0.845 (95% CI: 0.798–0.892). The sensitivity, specificity, PPV, NPV, and accuracy were 84.3%, 73.8%, 92.6%, 54.6%, and 82.1%; respectively. Calibration curves demonstrated excellent agreement between the nomogram prediction and actual observation. The decision curve analysis showed that the combined model provided greater net benefit compared to the magnetocardiography model.
CONCLUSIONS
The novel quantitative MFM parameters, whether used individually or in combination with clinical indicators, have been shown to effectively predict the risk of severe coronary stenosis in patients presenting with angina-like symptoms. Magnetocardiography, an emerging non-invasive diagnostic tool, warrants further exploration for its potential in diagnosing coronary heart disease.
Coronary artery disease (CAD) stands as a significant and escalating global public health concern, with its prevalence steadily increasing over the years. According to the 2022 report from the National Center for Cardiovascular Disease, CAD affects approximately 330 million individuals and has emerged as a leading cause of mortality among both urban and rural populations in China. Nevertheless, the accurate identification of myocardial ischemia in patients with suspected CAD remains a challenging task in routine clinical evaluation. The multiplicity of symptoms and the absence of conclusive evidence of ischemia considerably heighten the complexity of diagnosing ischemic heart disease.[1] Various methodologies have been explored to address this issue, including myocardial perfusion imaging, coronary computed tomography angiography, and percutaneous coronary angiography (CAG). Cardiac functional assessment and stress testing have traditionally been deemed as non-invasive “gold standards” for the common diagnosis of CAD and the detection of inducible myocardial ischemia. In reality, fewer than half of the patients have undergone non-invasive examinations before undergoing percutaneous coronary intervention (PCI) due to the inherent limitations of non-invasive tests. These limitations encompass low diagnostic accuracy, the risk of radiation exposure, and potential adverse reactions, including allergies or kidney damage stemming from iodine-based contrast agents.[2–4] Therefore, there is an urgent necessity to introduce a non-invasive, radiation-free diagnostic technique that aids cardiologist in accurately identifying CAD patients with myocardial ischemia at an early stage.
Magnetocardiography (MCG) represents a cutting-edge non-invasive, non-contact, radiation-free, and convenient detection technique. MCG employs an array of non-invasive magnetometers to capture and map the magnetic fields generated by cardiac bioelectrical activity.[5–7] Over the past decades, multiple studies have unveiled the diagnostic potential of MCG in distinguishing patients with arrhythmias, cardiovascular diseases, non-ischemic dilated cardiomyopathy, as well as fetal congenital heart diseases, and fetal arrythmias. Notably, one of the primary domains where MCG excels is in the detection of myocardial ischemia. Myocardial ischemia can indirectly induce regional ventricular repolarization abnormalities by modifying the resting membrane potential, reducing membrane excitability, shortening the action potential, decreasing conduction velocity, and extending the refractory period beyond repolarization in the ischemic region.[8,9] These abnormal bioelectric currents in the heart contribute to the heterogeneity of the magnetic field, which can be accurately recorded by MCG.
In the early stages of MCG research, characteristics such as pseudo current density plots,[10] and parameters derived from the magnetic field map (MFM) with a particular focus on the repolarization phase, including the fluctuation fraction of the ST-segment, TT interval, and the peak of T-wave had been extensively employed for myocardial ischemia diagnosis.[11–14] Nonetheless, the diagnostic efficacy of MCG hasn’t been thoroughly realized due to limitations in inclusion criteria, sample size, and the parameters utilized in prior studies.[15] In this study, the novel parameters, innovatively extracted from MFM throughout the integrated cardiac cycle, were employed for a comprehensive analysis. The primary objective was to establish a diagnostic model using MCG technology to identify CAD patients with stenosis exceeding 70%.
METHODS
Study Design and Population
This was a prospective, single-center, double-blind cross-sectional study conducted at a national high-volume tertiary referral center in China. The study was approved by the Ethics Committee of Chinese PLA General Hospital (No.S2022-023-01) and registered in the Chinese Clinical Trail Registry (ChiCTR2300074399). All participants were fully informed about the purpose of the trial and provided written informed consent prior to enrollment.
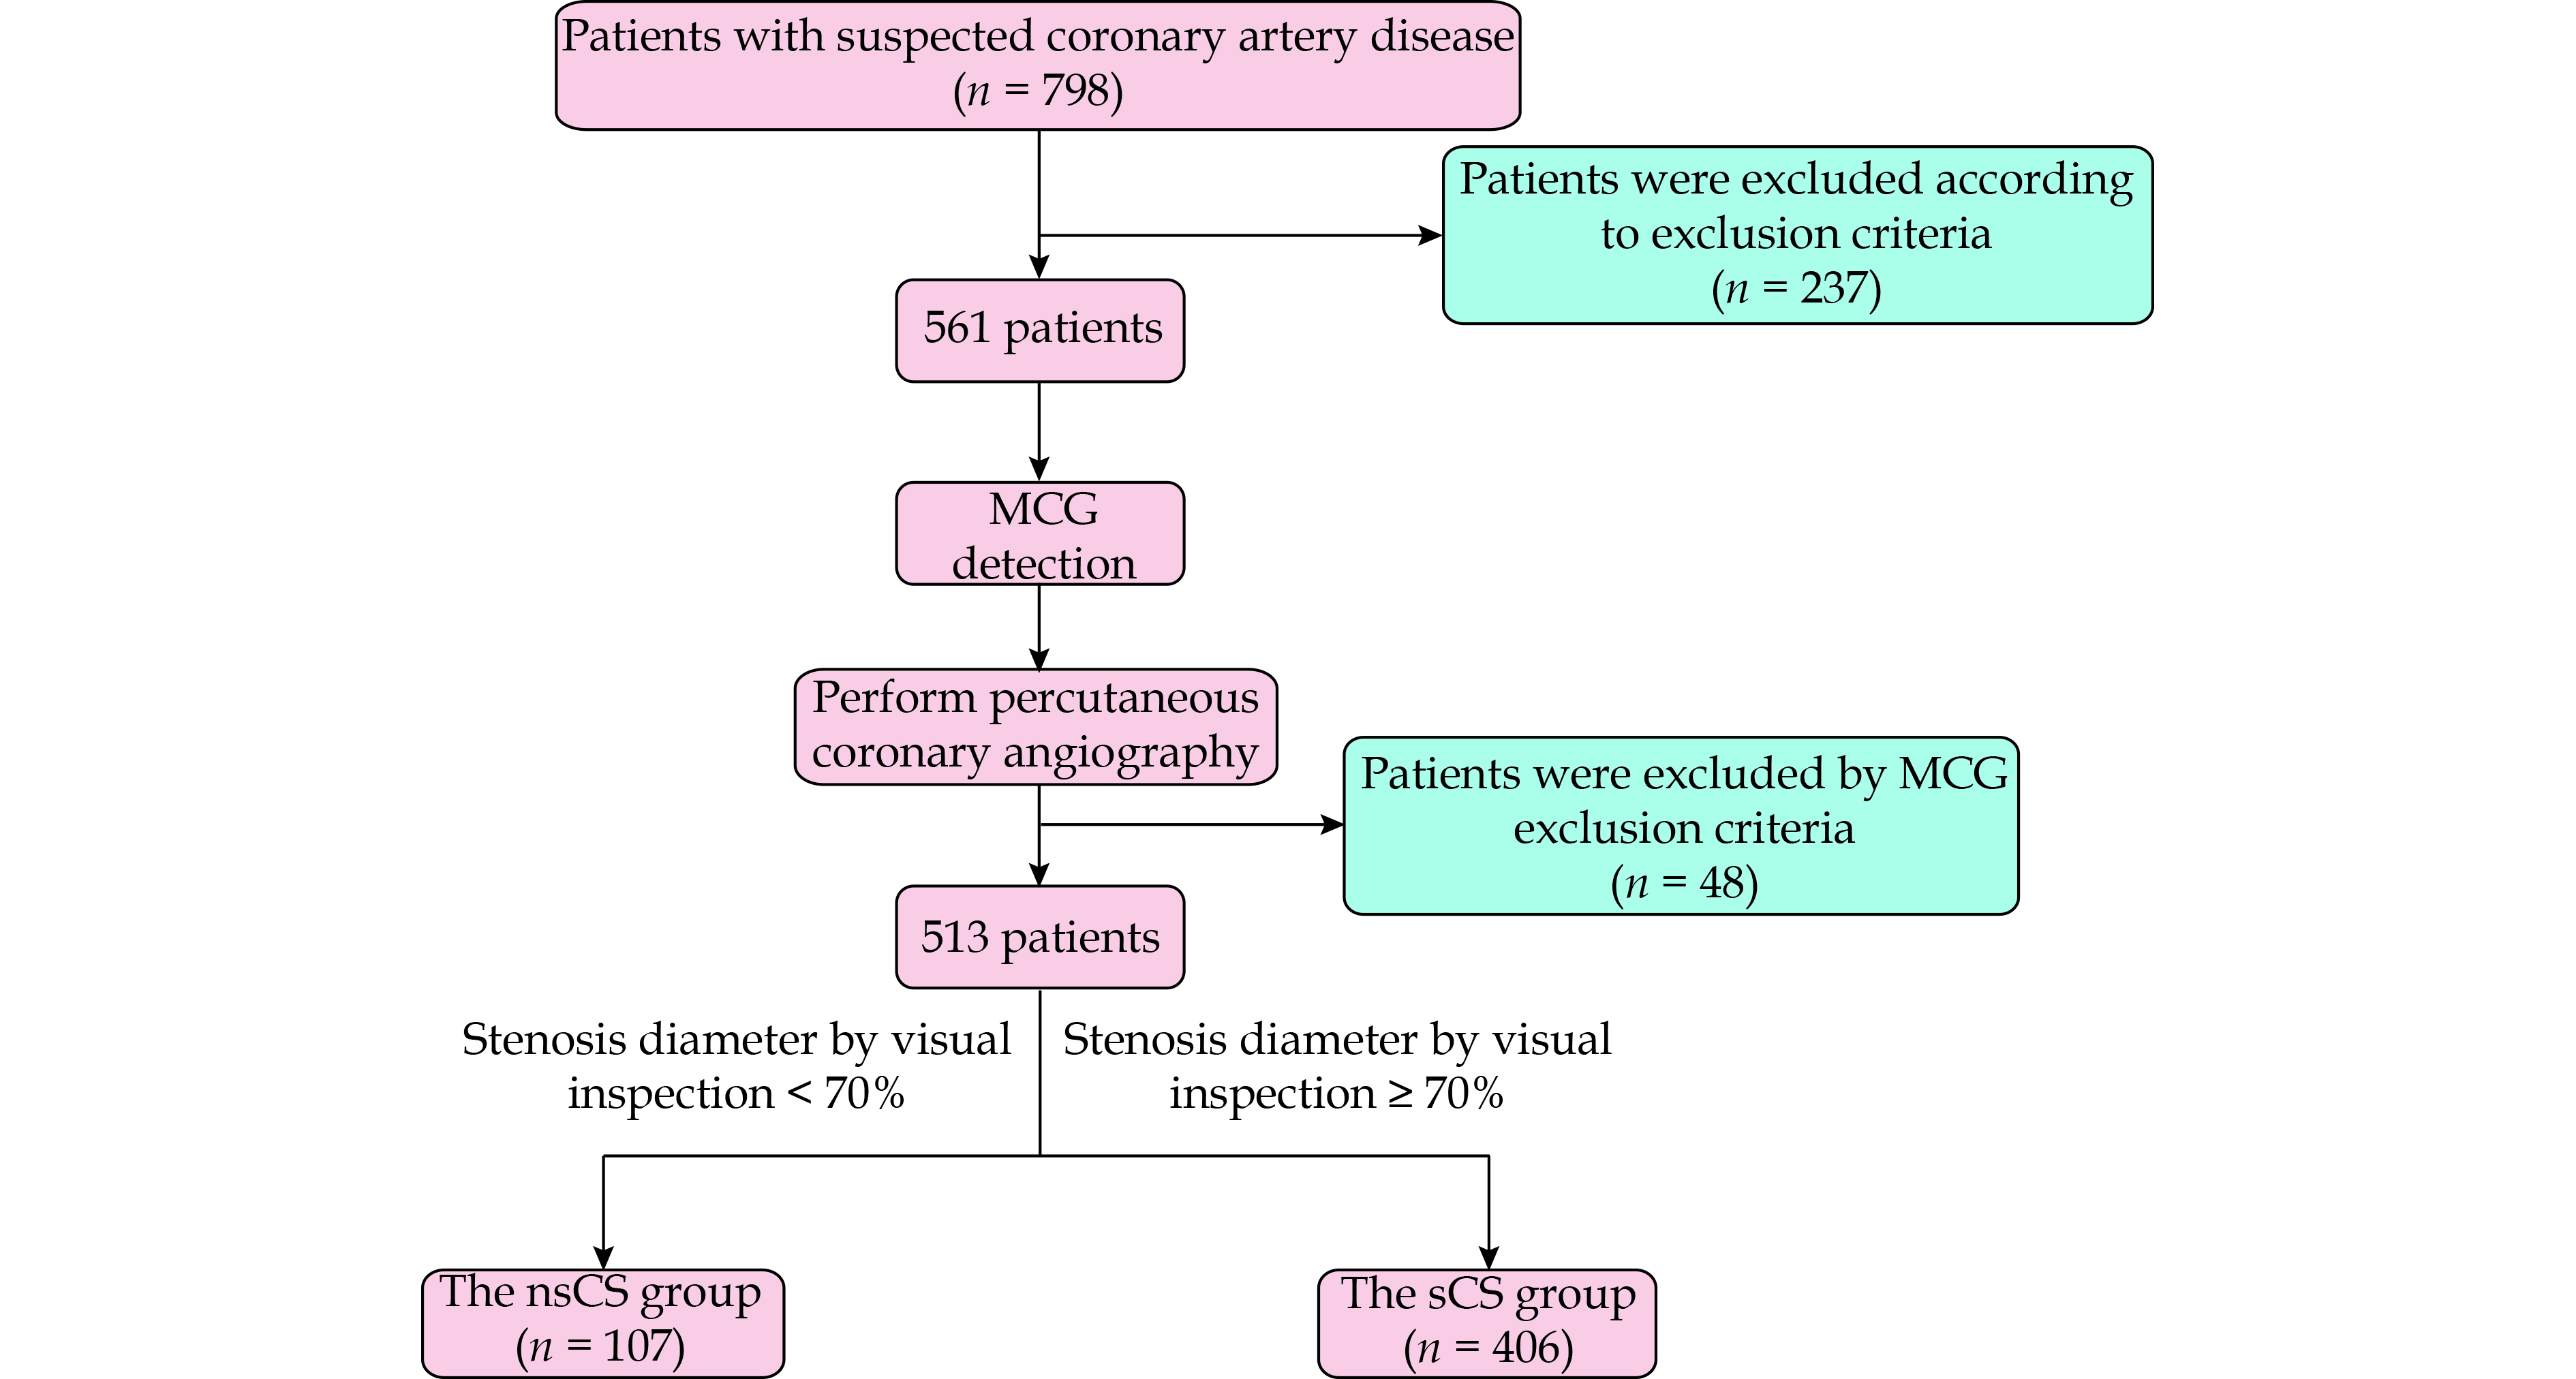
The study consecutively enrolled patients who were admitted to the hospital from September 1, 2022 to September 3, 2023. Inclusion criteria included: (1) aged ≥ 18 years; and (2) patients with chest pain or suspected CAD. Exclusion criteria included: (1) prior acute myocardial infarction; (2) valvular heart diseases; (3) hypertrophic or dilated cardiomyopathies; (4) impaired left ventricular function (left ventricular ejection fraction < 50%); (5) complex arrhythmias such as atrial fibrillation, complete bundle branch block, or frequent ventricular premature contractions; (6) patients with non-removable metal implants that could interfere with MCG signals, such as pacemakers, internal cardiac defibrillators, internal fixation of bone fractures, and metal dentures; and (7) poor image quality of MCG results due to strong noise interference. The flow chart outlining the patient inclusion process is depicted in Figure 1.
Figure
1.
Flowchart of patients enrolled.
MCG: magnetocardiography; nsCS: non-severe coronary stenosis; sCS: severe coronary stenosis.
After enrollment, all patients underwent MCG examinations within 48 h prior to CAG. The MCG data were collected and summarized by an abstractor with three years of training, who was blinded to the outcome of interest.
CAG served as the gold standard for assessing the diagnostic capability of MCG. Based on CAG indicators, patients were categorized into two groups: the non-severe coronary stenosis group (the nsCS group, < 70% stenosis) and the severe coronary stenosis group (the sCS group, ≥ 70% stenosis). Patients with diameter stenosis of 70% or more in at least one major epicardial coronary artery were included in the sCS group, while the remaining patients were enrolled in the nsCS group. The detailed clinical information was obtained from hospital records upon admission. Additional laboratory biochemical indicators and echocardiography were regularly performed using standard methods, and the detailed results were uniformly collected.
MCG Equipment and Examination
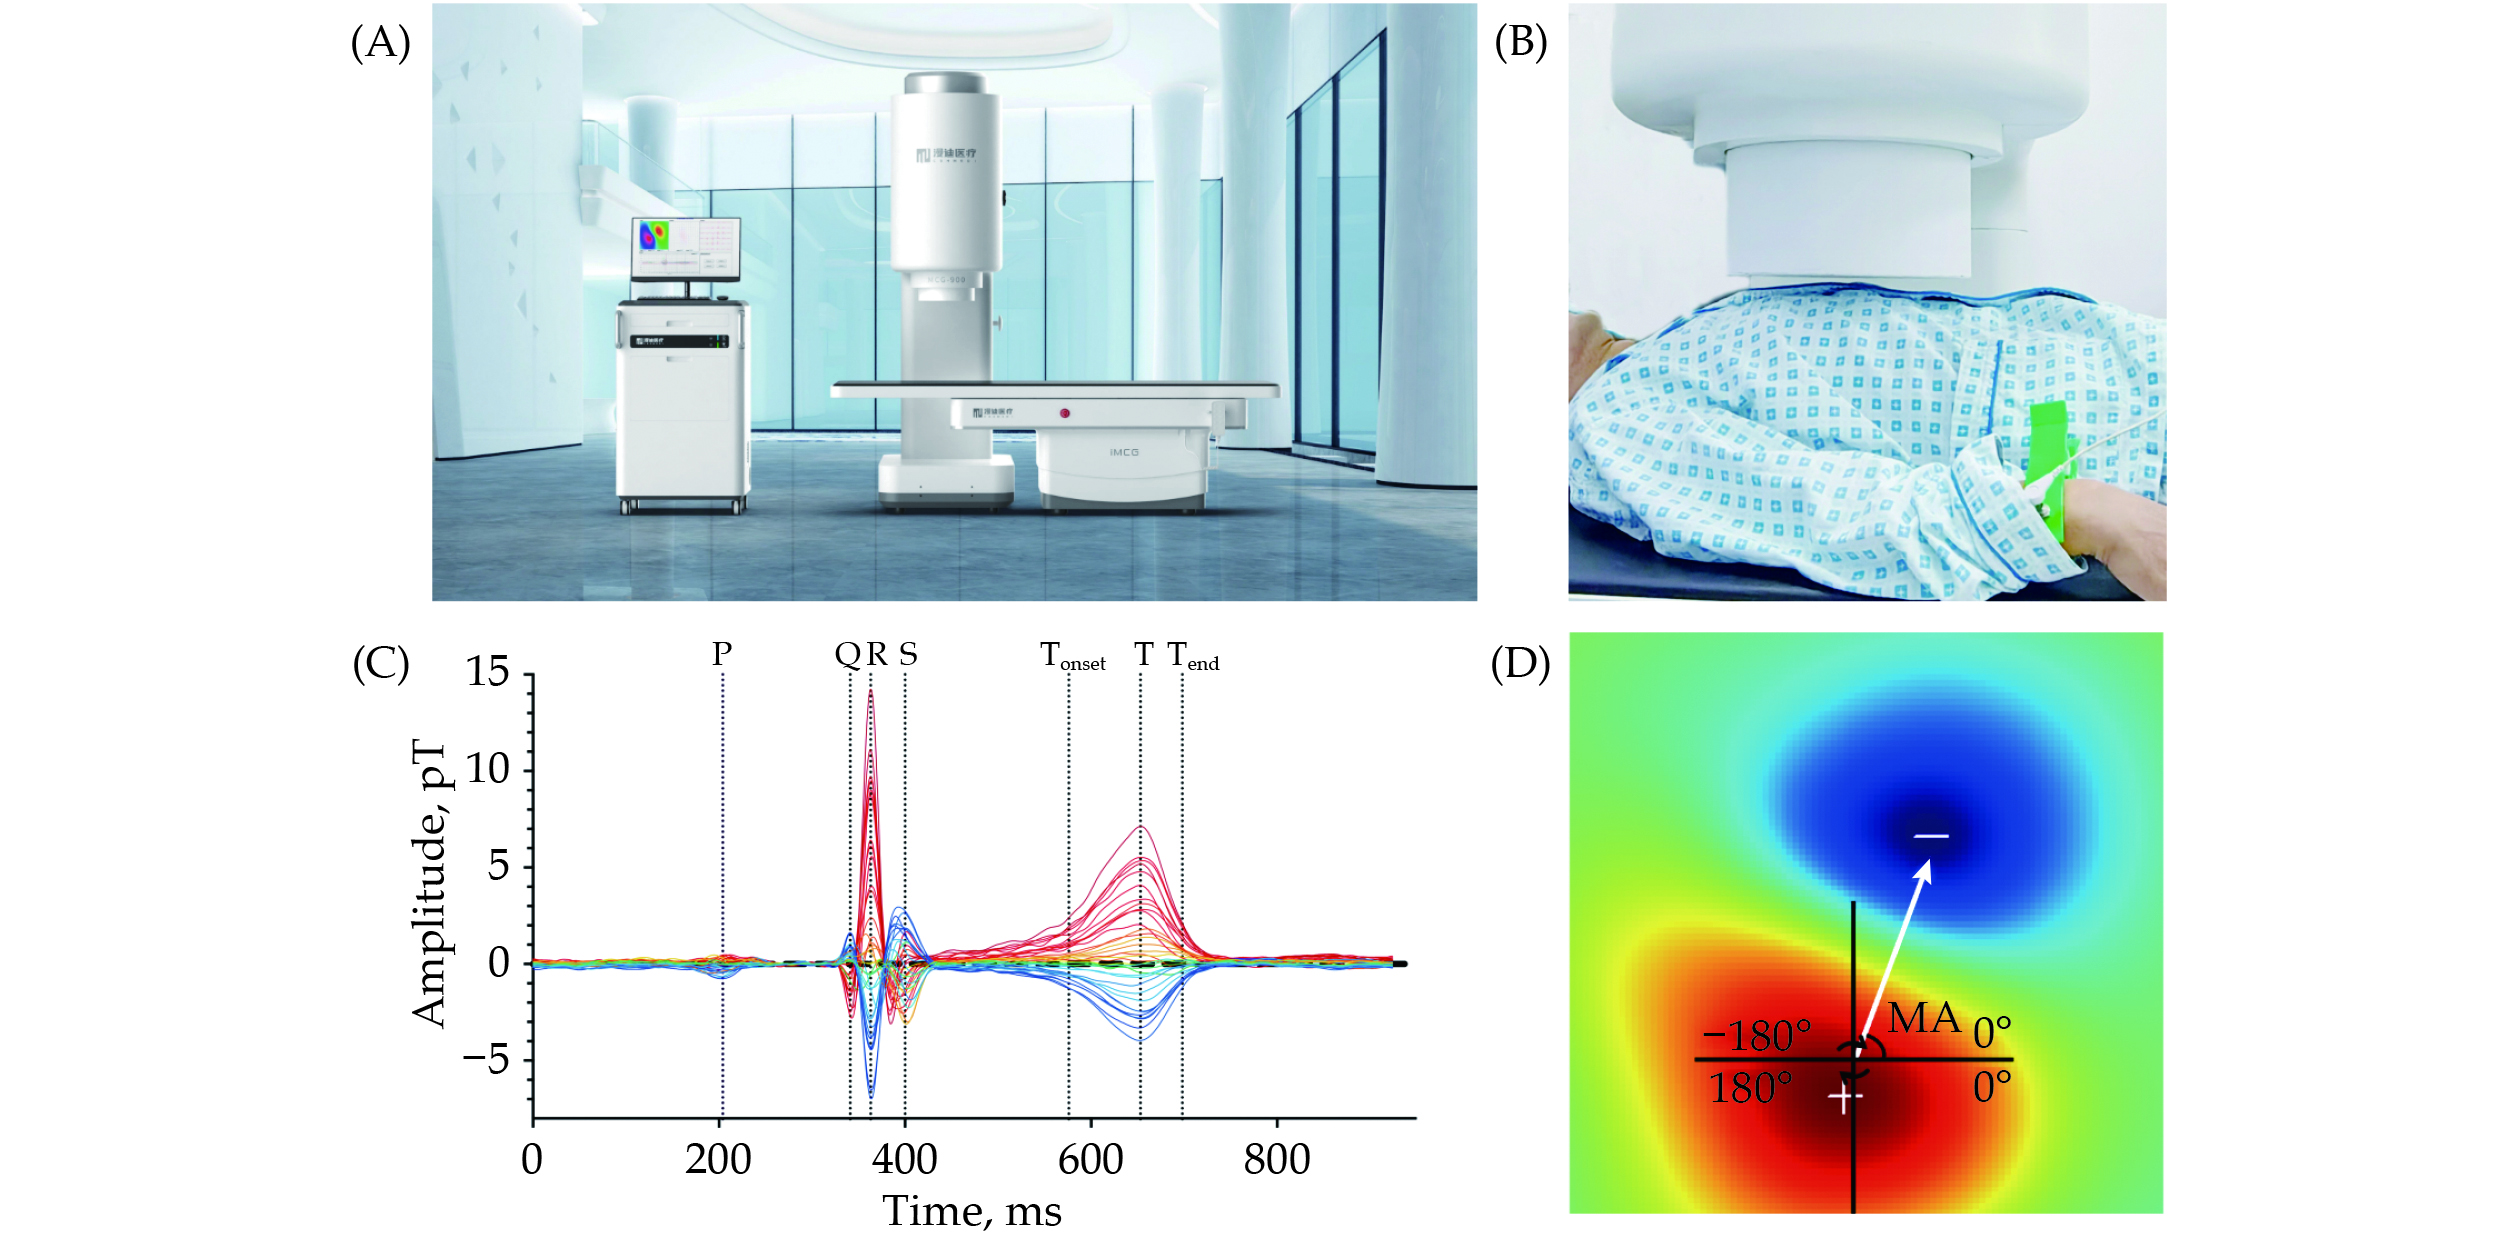
All enrolled patients underwent MCG examinations utilizing an unshielded 9-channel MCG system (MD-U092001, Shanghai MEDI Instruments Ltd., Shanghai, China) as illustrated in Figure 2A. The MCG system comprises nine superconducting quantum interference device sensors, each separated by 4 cm and linked to second-order axial gradiometers, as depicted in supplemental material, Figure 1S.
Figure
2.
MCG equipment, test example and standard images.
(A): Unshielded 9-channel MCG system (MD-U092001, Shanghai MEDI Instruments Ltd., Shanghai, China); (B): schematic representation of the relative position of the Dewar probe to the patient for MCG collection; (C): time curve of magnetic induction intensity; and (D): the definition of magnetic poles angle. MCG: magnetocardiography.
After eliminating any magnetic, electronic, and metallic artifacts, patients underwent four sequential recordings, capturing a total of 36 points in a 6 × 6 rectangular grid (supplemental material, Figure 1S) positioned directly over the precordial area while in a supine resting position (Figure 2B). The sensors were meticulously positioned over the middle of the thorax without physical contact and encompassed an observation area measuring 20 cm × 20 cm.
MCG signals were digitally recorded for approximately 5 min at a sampling rate of 1000 Hz, with simultaneous recording of the electrocardiography (ECG) lead-II as a reference signal. Subsequently, the raw signals were filtered, averaged, and archived for further analysis.
MFM Parameters
The analytical system automatically generated the MFM based on the averaged magnetic field intensity from each channel at every sampling time point, the naming of relevant time points was similar to ECG (Figure 2C). Previous studies have mainly focused on MFM parameters derived from the repolarization period, relying on ECG-based experience for diagnosing myocardial ischemia. This approach could overlook valuable information within the depolarization period. Consequently, we extracted a total of five categories of characteristics, comprising 19 parameters, from the MFM during both the QRS complex and T-wave:
Magnetic pole angle at specific time points
The angular direction was illustrated in Figure 2D. The red magnetic pole in the lower left corner was the positive pole. Corresponding, the blue pole in the upper right corner was the negative pole. The magnetic pole angle was defined as that is from the center point of positive pole to the center point of negative pole in the coordinate.[16]
Median of angle changes
This parameter represented the dynamic rotation of magnetic poles from positive to negative pole in specific intervals, reflecting the property of electrical activity transmission in a particular time period.
Magnetic pole dispersion at specific time points
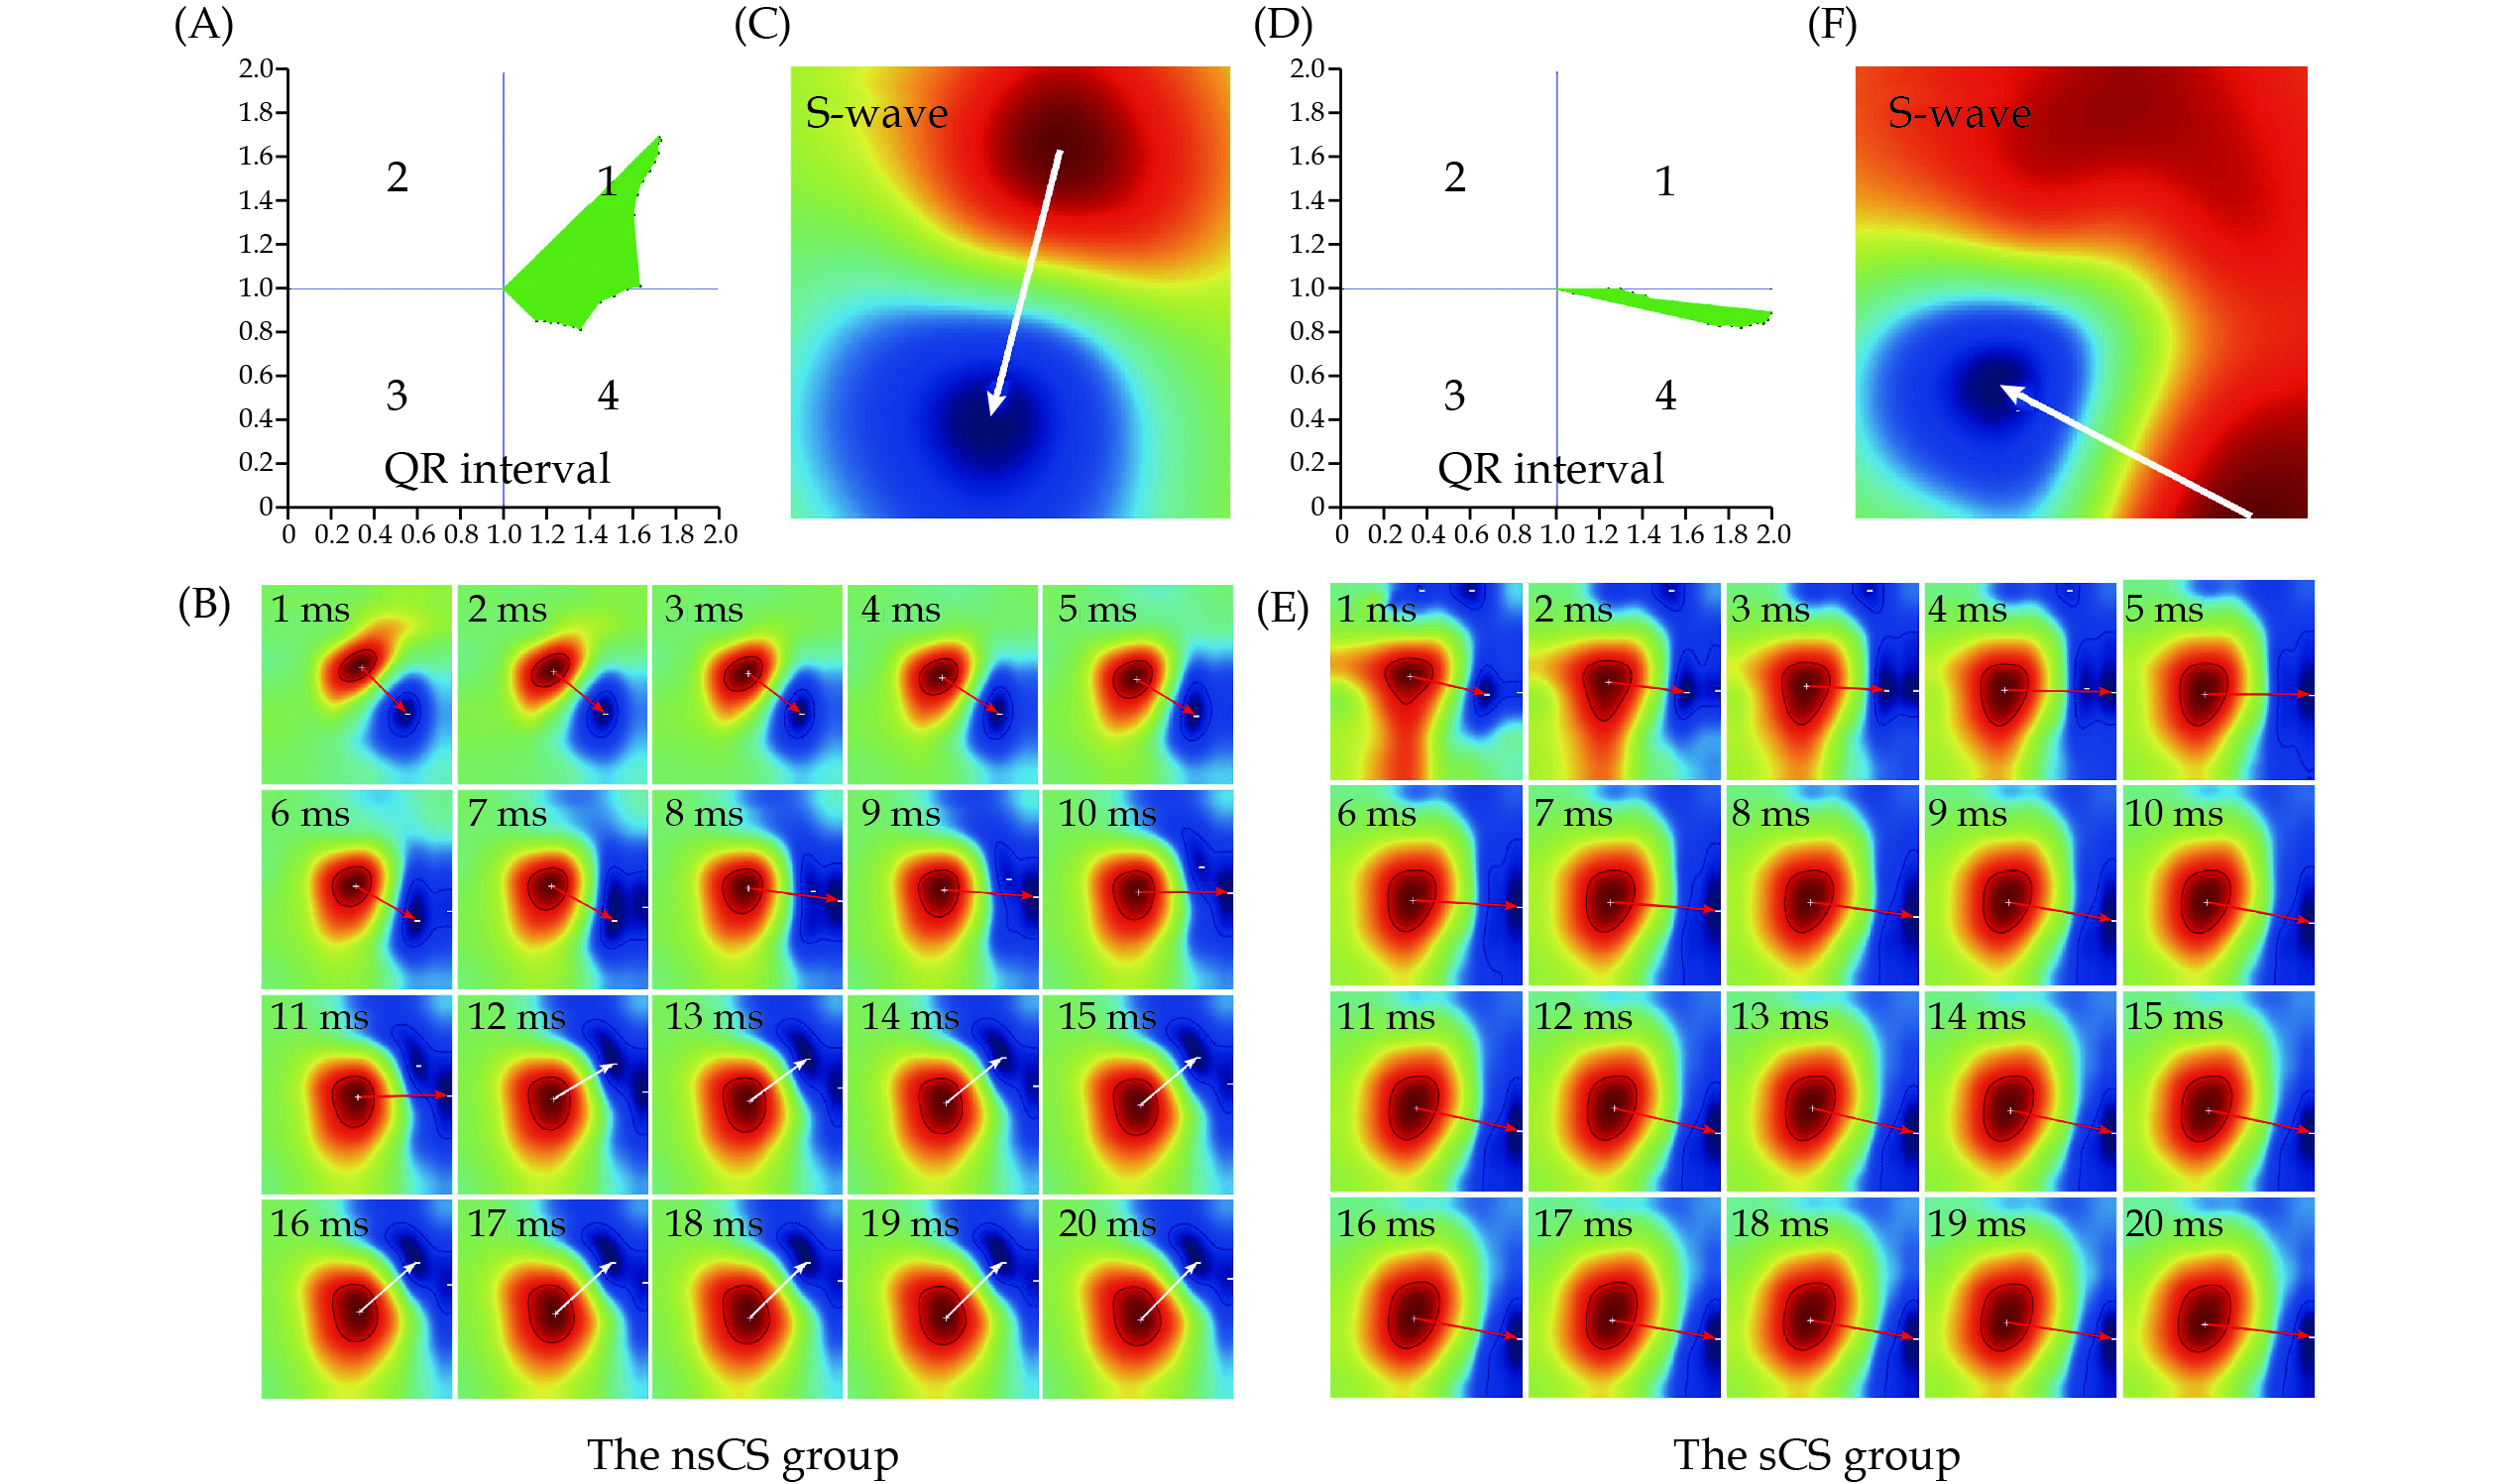
A refined analysis of the characteristics of multiple magnetic poles and their morphology on positive or negative poles. The higher dispersion value between positive and negative poles was selected as the final result, as shown in Figure 3.
Figure
3.
Representative plots of magnetic field map characteristic parameters from typical cases.
(A) & (D): The magnetic vector from positive to negative pole based on amplitude in QR interval of patients from the nsCS group and the sCS group, respectively; (B) & (E): the rotation cine of magnetic dipoles of in QR interval patients from the nsCS group and the sCS group, respectively. There was an obvious jump angle in normal rotation cine of magnetic dipoles in QR interval, happened on 12 ms in this case (as indicated by the white arrow) of the nsCS group (B). However, none jump angle happened in the sCS group (E), which could explain the magnetic vector values of the sCS group were lower than those of the nsCS group; and (C) & (F): the dispersion of magnetic pole at peak of S-wave of patients from the nsCS group and the sCS group, respectively. The morphology feature of positive and negative magnetic poles is quasi-circular, symmetry with a regular contour in the nsCS group (C). There are multiple magnetic poles in positive magnetic pole with irregular boundaries while positive and negative magnetic poles were asymmetric (F). nsCS: non-severe coronary stenosis; sCS: severe coronary stenosis.
This describes the distribution of midpoints between positive and negative magnetic poles throughout cardiac cycles in specific intervals, as indicated in supplemental material, Figure 2S. Higher values suggest a greater likelihood of myocardial ischemia.
Magnetic pole vector based on amplitude
Calculated by establishing all positive poles at the same original point and normalizing by magnetic field intensity amplitude as the pointing length. Smaller values indicate a higher likelihood of myocardial ischemia during the QR interval, as shown in Figure 3. Comprehensive naming rules for these parameters are outlined in Table 1.
Table
1.
Naming rules and meanings of magnetocardiography parameters.
Full name
Abbreviation
Definition
Related parameters
Distribution of magnetic dipole center trajectory
MCTDd
Distribution of magnetic dipole center trajectory in specific interval
QR_MCTDd, RS_MCTDd, QRS_MCTDd, TT_MCTDd
Magnetic pole vector based on amplitude
MVamp
Vector value from positive to negative pole based on amplitude in specific interval
QR_MVamp, RS_MVamp, QRS_MVamp, TT_MVamp
Dispersion of magnetic pole
MDp
Dispersion of magnetic pole morph at specific time point or interval
Q_MDp, R_MDp, S_MDp, T_MDp, QRS_MDp, TT_MDp
Magnetic pole angle
MA
Angle from positive to negative pole at specific time point
Q_MA, R_MA, S_MA, T_MA
Angle changes of magnetic pole
MAC50
Median of angle changes from positive to negative pole in specific interval
All enrolled patients underwent CAG in the catheterization laboratory. Diagnostic CAG was performed on each patient using standard techniques, following pretreatment with intracoronary nitroglycerin to prevent vessel spasm. Multiple projections of the coronary arteries were digitally recorded. Two highly experienced cardiac physicians visually assessed the degree of vascular stenosis and the need for revascularization in each patient. The final label for vascular stenosis was determined by averaging the degree of stenosis provided by these two cardiac physicians. Severe CAD was defined as angiographic maximum lesions ≥ 70% luminal stenosis in at least one of the epicardial coronary arteries. Revascularization procedures adhered to the guidelines of both the American Heart Association and the Chinese guideline for PCI.
Statistical Analysis
Continuous variables were presented as mean ± SD or median (interquartile range). Categorical variables were represented as counts (percentages). Differences between groups were assessed using Mann-Whitney U test or Student’s t-test for continuous variables and the Pearson’s chi-squared test for categorical variables. The Watson-Williams test was employed to assess differences in angular changes between two groups. Binary logistic regression models were built to diagnose CAD using MFM parameters alone and in combination with clinical indicators that exhibited significant differences between the two groups. The model’s self-verification was evaluated for CAD was assessed through receiver operating characteristic curve analysis. The diagnostic metrics considered included sensitivity, specificity, positive predictive value (PPV), negative predictive value (NPV), and accuracy. Due to the periodic nature of angle data, we utilized receiver operating characteristic curves to establish binary classification boundaries for each angle parameter. The upper and lower limits of these parameters, showing the highest diagnostic performance based solely on MFM data from 513 patients, were defined and subsequently incorporated as categorical variables into the model. The area under the curve (AUC) was compared between models using Delong’s test. Calibration was assessed using a calibration plot with 500 resampled bootstraps to depict the goodness of fit between the actual CAD prevalence and the CAD predictions generated from the nomogram. Clinical usefulness and net benefit were estimated with decision curve analysis (DCA). All analyses were performed using SPSS 23.0 (SPSS Inc., IBM, Armonk, NY, USA) and R statistical software 4.2.2 (The R Project for Statistical Computing, Vienna, Austria). Two-sided P-value < 0.05 were considered statistically significant.
RESULTS
Initially, 798 patients with chest pain or suspected CAD were identified. Subsequently, 237 patients were excluded based on specific exclusion criteria, which comprised prior acute myocardial infarction (n = 158), impaired left ventricular function (left ventricular ejection fraction < 50%, n = 44), complete bundle branch block (n = 31), frequent ventricular premature contractions (n = 3), and atrial fibrillation (n = 1). Additionally, 48 patients were excluded due to non-compliance with MCG exclusion criteria. The final analysis included 513 patients, who were categorized into the nsCS group (107 patients, comprising 78 males and 29 females, mean age: 60.7 ± 10.4 years) and the sCS group (406 patients, comprising 316 males and 90 females, mean age: 61.4 ± 9.8 years).
Participant Baseline Characteristics
The baseline demographic and laboratory characteristics of the patients included in this study are presented in Table 2. Apart from type 2 diabetes mellitus (T2DM), there were no significant differences in the demographic and clinical features between the two groups. Notably, the sCS group exhibited a higher prevalence of T2DM compared to the nsCS group (35.7% vs. 23.4%, P = 0.016). Furthermore, several laboratory parameters, including B-type natriuretic peptide, fibrinogen, and D-dimer, were notably elevated in the sCS group compared to the nsCS group (B-type natriuretic peptide: 65.30 (25.20–145.10) pmol/L vs. 55.75 (18.15–95.55) pmol/L, P = 0.013; fibrinogen: 3.19 ± 0.72 g/L vs. 3.02 ± 0.7 g/L, P = 0.012; D-dimer: 0.36 ± 0.62 μg/mL vs. 0.24 ± 0.15 μg/mL, P < 0.001).
Table
2.
Demographic characteristics and clinical indicators of the study patients (n = 513).
Variables
The nsCS group (n = 107)
The sCS group (n = 406)
P-value
Age, yrs
60.7 ± 10.4
61.4 ± 9.8
0.409
Heart rate, beats/min
78.2 ± 10.2
78.1 ± 10.9
0.924
Body mass index, kg/m2
29.0 ± 36.7
25.7 ± 3.1
0.736
Male sex
78 (72.9%)
316 (77.8%)
0.282
Typical symptoms
93 (86.9%)
372 (91.6%)
0.137
Hypertension
62 (57.9%)
268 (66.0%)
0.121
Type 2 diabetes mellitus
25 (23.4%)
145 (35.7%)
0.016
Smoking
36 (33.6%)
151 (37.2%)
0.498
Family history
19 (17.8%)
63 (15.5%)
0.574
Total protein, g/L
67.73 ± 4.87
68.43 ± 4.83
0.269
Serum albumin, g/L
42.07 ± 3.13
41.93 ± 3.47
0.664
Myoglobin, ng/mL
37.58 ± 72.3
37.69 ± 35.62
0.123
Creatine kinase-MB, U/L
1.43 ± 1.15
1.47 ± 1.03
0.533
B-type natriuretic peptide, pmol/L
55.75 (18.15–95.55)*
65.30 (25.20–145.10)*
0.013
Total cholesterol, mmol/L
3.86 ± 1.05
3.7 ± 0.95
0.141
Triglycerides, mmol/L
1.54 ± 1.1
1.62 ± 0.93
0.17
Apoprotein A1, g/L
1.361 ± 0.287
1.255 ± 0.224
0.002
Apoprotein B, g/L
0.674 ± 0.194
0.646 ± 0.187
0.195
High-density lipoprotein, mmol/L
1.18 ± 0.32
1.08 ± 0.27
0.002
Low-density lipoprotein, mmol/L
2.27 ± 0.93
2.19 ± 0.86
0.464
Blood glucose, mmol/L
5.68 ± 1.58
5.84 ± 1.82
0.274
C-reactive protein, mg/dL
0.21 ± 0.4
0.25 ± 0.68
0.072
Interleukin 6, ng/L
2.98 ± 2.93
4.97 ± 14.73
0.052
Fibrinogen, g/L
3.02 ± 0.7
3.19 ± 0.72
0.012
D-dimer, μg/mL
0.24 ± 0.15
0.36 ± 0.62
< 0.001
Data are presented as means ± SD or n (%). *Presented as median (interquartile range). nsCS: non-severe coronary stenosis; sCS: severe coronary stenosis.
Not all patients in the nsCS group were devoid of coronary artery stenosis, as the threshold for diagnosis was a coronary artery diameter stenosis ≥ 70%. Within the nsCS group, 39 patients (36.4%) had diameter stenosis < 30%, 5 patients (4.7%) had diameter stenosis ≥ 30% and < 50%, and 63 patients (58.9%) had diameter stenosis ≥ 50% and < 70%.
Difference of MAG Parameters between nsCS Group and sCS Group
Univariate analysis identified seven out of 19 parameters that exhibited significant differences between the nsCS group and the sCS group, making them potential predictors for CAD, as detailed in Table 3. Specifically, the mean value of the distribution of magnetic dipole center trajectory in the QR interval (QR_MCTDd) was significantly higher in the sCS group compared to the nsCS group (10.46 ± 10.66 vs. 5.11 ± 6.07, P < 0.001). Additionally, the mean value of the magnetic pole vector based on amplitude (QR_MVamp) was notably lower in the sCS group (0.23 ± 0.16 vs. 0.28 ± 0.16, P < 0.001). The quantified dispersion of magnetic poles at the time of the S-wave peak was significantly different between the two groups, with the sCS group exhibiting greater dispersion compared to the nsCS group (7.2 ± 8.64 vs. 4.68 ± 6.95, P = 0.003). Except for the angle changes of magnetic poles at the S-wave peak (S_MA), both the mean values of R_MA and T_MA in the sCS group were lower than those in the nsCS group (R_MA: 55.06 ± 48.68 vs. 59.24 ± 53.01, P < 0.001; T_MA: 51.67 ± 39.32 vs. 60.45 ± 51.33, P < 0.001). Moreover, the sCS group showed a notable increase in the median of angle changes from positive to negative pole during the TT interval (TT_MAC50).
Table
3.
Magnetocardiography parameters values of the nsCS group and the sCS group (n = 513).
Parameters
The nsCS group (n = 107)
The sCS group (n = 406)
P-value
QR_
QR_MCTDd, %
5.11 ± 6.07
10.46 ± 10.66
< 0.001
QR_MVamp
0.28 ± 0.16
0.23 ± 0.16
0.002
RS_
RS_MCTDd, %
6.54 ± 6.71
7.71 ± 6.83
0.065
RS_MVamp
0.24 ± 0.18
0.25 ± 0.18
0.475
QRS_
QRS_MCTDd, %
28.49 ± 9.95
28.75 ± 9.06
0.635
QRS_MDp
13.9 ± 22.23
18.19 ± 28.29
0.236
QRS_MVamp
0.43 ± 0.23
0.41 ± 0.23
0.333
TT_
TT_MCTDd, %
14.44 ± 11.4
16.14 ± 11.71
0.148
TT__MDp
12.01 ± 13.11
11.66 ± 11.23
0.536
TT_MVamp
0.23 ± 0.14
0.23 ± 0.16
0.791
TT_MAC50
0.26 ± 57.29
0.32 ± 57.29
< 0.001
Q-wave
Q_MDp
5.44 ± 6.45
6.89 ± 9.23
0.474
Q_MA
290.9 ± 48.12
296.43 ± 42.33
0.06
R-wave
R_MDp
4.96 ± 6.13
4.38 ± 4.91
0.719
R_MA
59.24 ± 53.01
55.06 ± 48.68
< 0.001
S-wave
S_MDp
4.68 ± 6.95
7.2 ± 8.64
0.003
S_MA
227.57 ± 42.1
233.97 ± 28.85
< 0.001
T-wave
T_MDp
4.93 ± 7.28
4.65 ± 6.38
0.857
T_MA
60.45 ± 51.33
51.67 ± 39.32
< 0.001
Data are presented as means ± SD. nsCS: non-severe coronary stenosis; sCS: severe coronary stenosis.
The Diagnosis Performance of MCG Model and Combined Model with Clinical Parameters
Among the magnetic parameters evaluated, QR_MCTDd exhibited the highest AUC with a value of 0.655. This parameter was effective in distinguishing CAD patients with stenosis exceeding 70% from the nsCS group patients, achieving the results as 70.0%, 53.3%, 85.0% and 31.8% for sensitivity, specificity, PPV, and NPV; respectively. The T_MA displayed exceptional specificity (93.5%) and PPV (95.7%). Additionally, other parameters, including R_MA, S_MA, and QR_MVamp, achieved diagnostic performance levels exceeding 80% in specificity and PPV (R_MA: specificity = 87.9%, PPV = 90.6%; S_MA: specificity = 83.2%, PPV = 88.6%; QR_MVamp: specificity = 85.0%, PPV = 89.7%). The TT_MAC50 demonstrated the highest diagnostic sensitivity (93.1%) for detecting CAD patients with stenosis exceeding 70%. Laboratory indicators that exhibited statistically significant differences between the two groups in the univariate analysis were added to the combined models with 7 MFM parameters and T2DM. The best combined model, including apoprotein A1 (Apo A1), demonstrated the most excellent diagnostic efficiency, as indicated in Table 4.
Table
4.
The effectiveness of magnetocardiography parameter and combined parameters in predictive diagnostic model for detection of coronary artery disease with above 70% stenosis.
Parameters
Reference range
Receiver operating characteristic area (95% CI)
Cutoff
Sensitive
Specificity
PPV
NPV
Diagnostic accuracy
P-value
Magnetocardiography parameters
All magnetocardiography parameters
–
0.81 (0.765–0.855)
0.765
71.7%
80.4%
93.3%
42.8%
73.5%
< 0.001
QR_MCTDd
–
0.655 (0.601–0.709)
0.742
70%
53.3%
85%
31.8%
66.5%
< 0.001
QR_MVamp
–
0.597 (0.539–0.654)
0.823
34.2%
85%
89.7%
25.4%
44.8%
0.001
S_MDp
–
0.591 (0.536–0.647)
0.793
44.3%
76.6%
87.8%
26.6%
51.1%
0.001
T_MA, degree
−90 to −11
0.657 (0.624–0.690)
0.836
37.9%
93.5%
95.7%
28.4%
49.5%
< 0.001
R_MA, degree
−79 to −21
0.594 (0.556–0.633)
0.828
31%
87.9%
90.6%
25.1%
42.9%
< 0.001
S_MA, degree
48 to 173
0.588 (0.546–0.631)
0.818
34.5%
83.2%
88.6%
25.1%
44.6%
< 0.001
TT_MAC50, degree
0.1 to 0.2
0.512 (0.482–0.543)
0.766
93.1%
9.3%
79.6%
26.3%
75.6%
0.805
Combined parameters*
Apoprotein A1
–
0.845 (0.798–0.892)
0.712
84.3%
73.8%
92.6%
54.6%
82.1%
< 0.001
D-dimer
–
0.824 (0.780–0.868)
0.836
64.1%
85.7%
94.5%
38.5%
68.6%
< 0.001
B-type natriuretic peptide
–
0.820 (0.774–0.865)
0.796
70.5%
79.4%
93%
40.9%
72.3%
< 0.001
Fibrinogen
–
0.818 (0.773–0.863)
0.684
83.4%
67.3%
90.6%
51.8%
80%
< 0.001
*Refer to includ magnetocardiography parameters and type 2 diabetes mellitus. NPV: negative predictive value; PPV: positive predictive value.
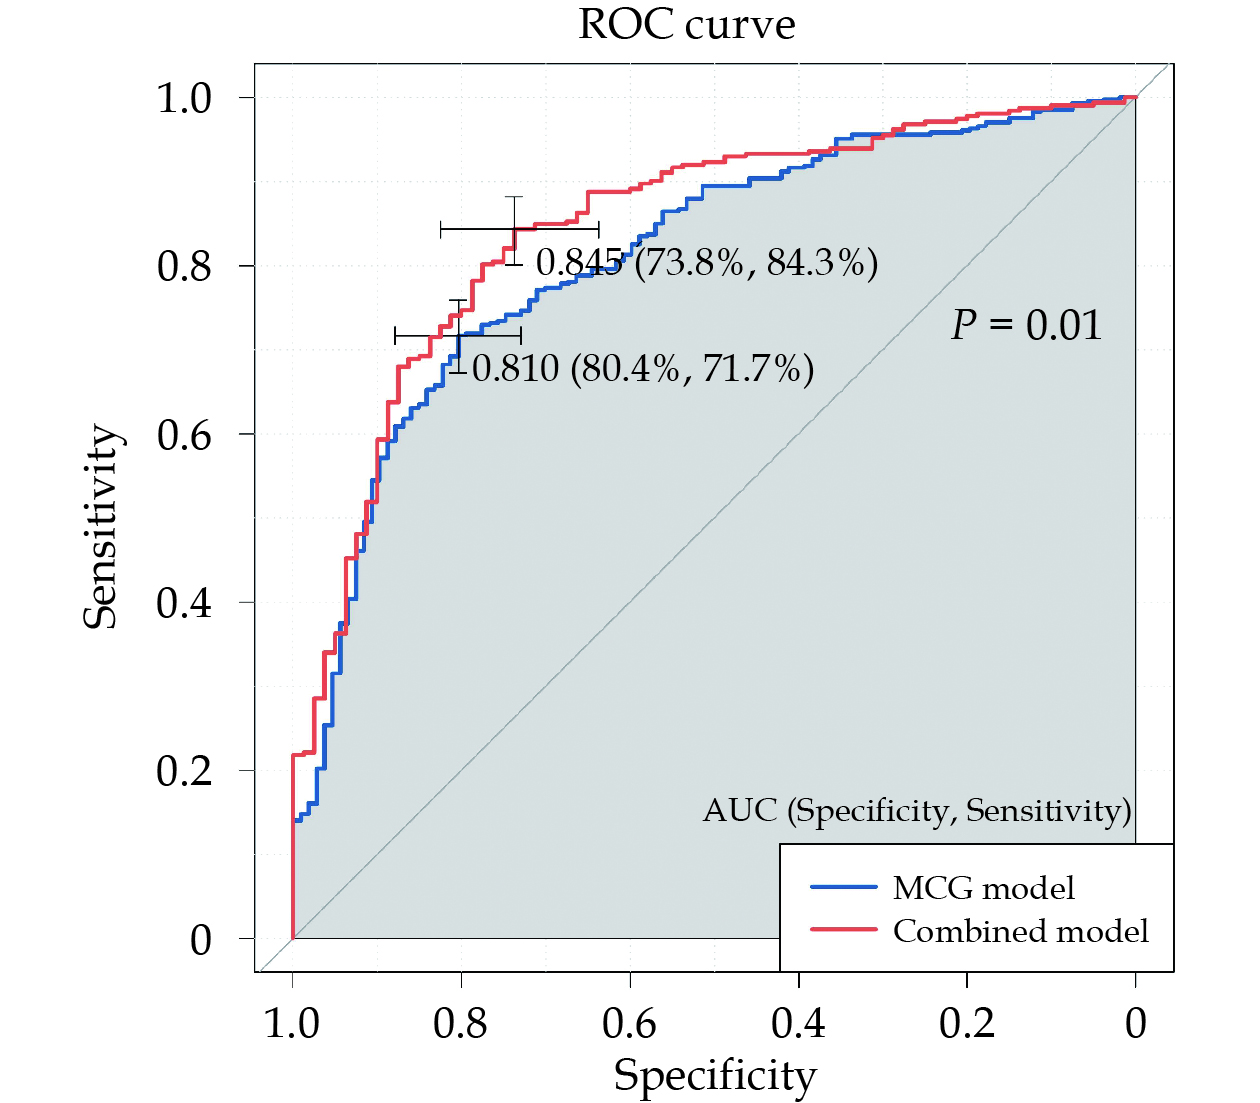
The MCG model incorporating seven parameters displayed a well-balanced diagnostic performance with a cutoff value of 0.765. It achieved a sensitivity of 71.7%, specificity of 80.4%, PPV of 93.3%, and an overall diagnostic accuracy of 73.5%. Notably, when compared with the best combined model, the latter exhibited significantly superior diagnostic efficiency (AUC: 0.845 vs. 0.810, P = 0.01), as illustrated in Figure 4. The multivariate binary logistic regression analysis results of the combined model were listed in Table 5. The QR_MCTDd, T_MA, R_MA, Apo A1, and T2DM performing significance for the final diagnosis of CAD with excessed 70% stenosis were considered as independent predictive factors for CAD. There was a negative relationship between Apo A1 and diagnostic likelihood of CAD. While the QR_MCTDd, T_MA, R_MA, and T2DM were positive related for diagnosing of CAD. In particular, the positive results of T_MA and R_MA mean that the diagnostic likelihood of CAD with stenosis exceeding 70% were 10.20 times and 5.28 times respectively than negative results.
Figure
4.
Performance of predictive value of diagnosis models.
Receiver operating characteristic curves of MCG predictive model and combined model with clinical parameters for diagnosis of coronary artery disease with above 70% stenosis. AUC = 0.810 for MCG model and AUC = 0.845 for combined model. AUC: area under the curve; MCG: magnetocardiography.
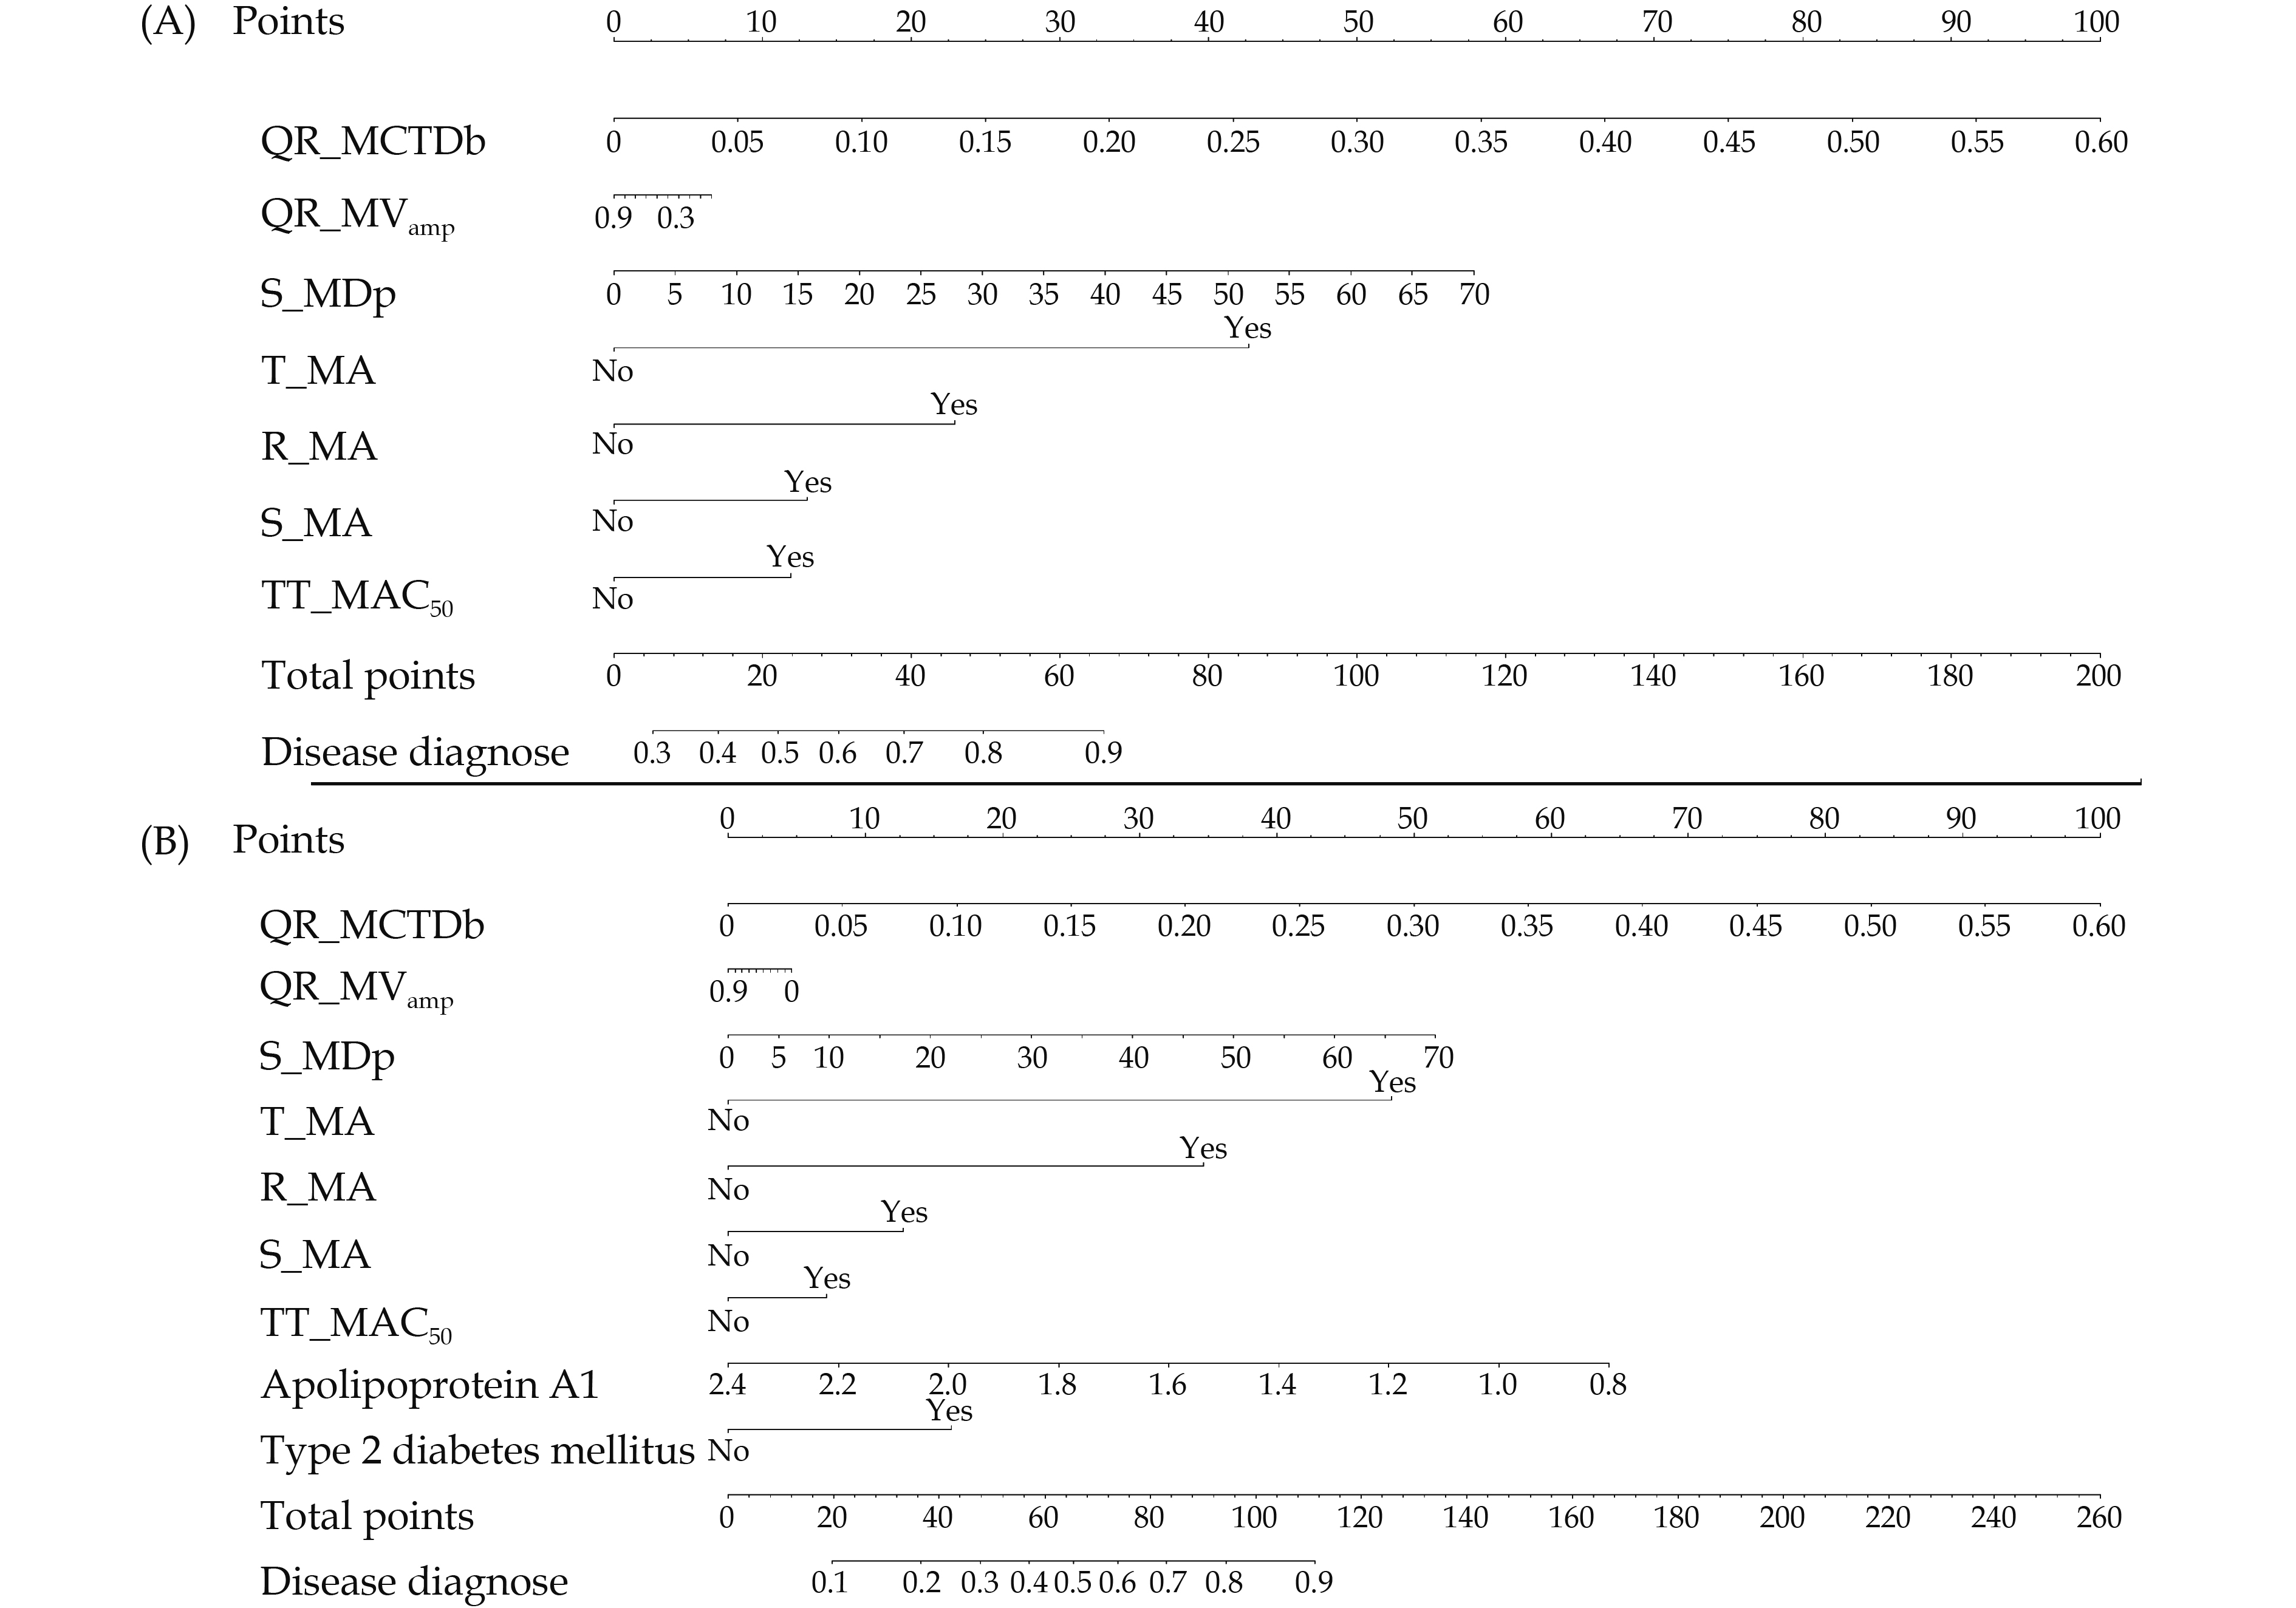
A nomogram was constructed to assess the risk of severe coronary stenosis, where higher total points, calculated based on the sum of assigned points for each predictor, indicated an increased risk of severe coronary stenosis (Figure 5). For example, within the MCG model, a patient with QR_MCTDd = 5%, QR_MVamp = 0.3, S_MDp = 5, normal T_MA and R_MA, and abnormal S_MA and TT_MAC50 would accumulate a total of 41 points (8 points for QR_MCTDd, 4 points for QR_MVamp, 4 points for S_MDp, 0 points for T_MA and R_MA, 13 points for S_MA, 12 points for TT_MAC50). Consequently, the predicted probability of suffering from severe coronary stenosis for this patient is 73.0%.
Figure
5.
Nomogram construction.
Nomogram of magnetocardiography model (A) and combined model (B). Points were assigned for QR_MCTDb, QR_MVamp, S_MDp, T_MA, R_MA, S_MA, TT_MAC50, type 2 diabetes mellitus, and apolipoprotein A1 by drawing a line upward from the corresponding values to the “points line” in two models, respectively. The “total points” are calculated as the sum of the individual score of each variable included in the nomogram.
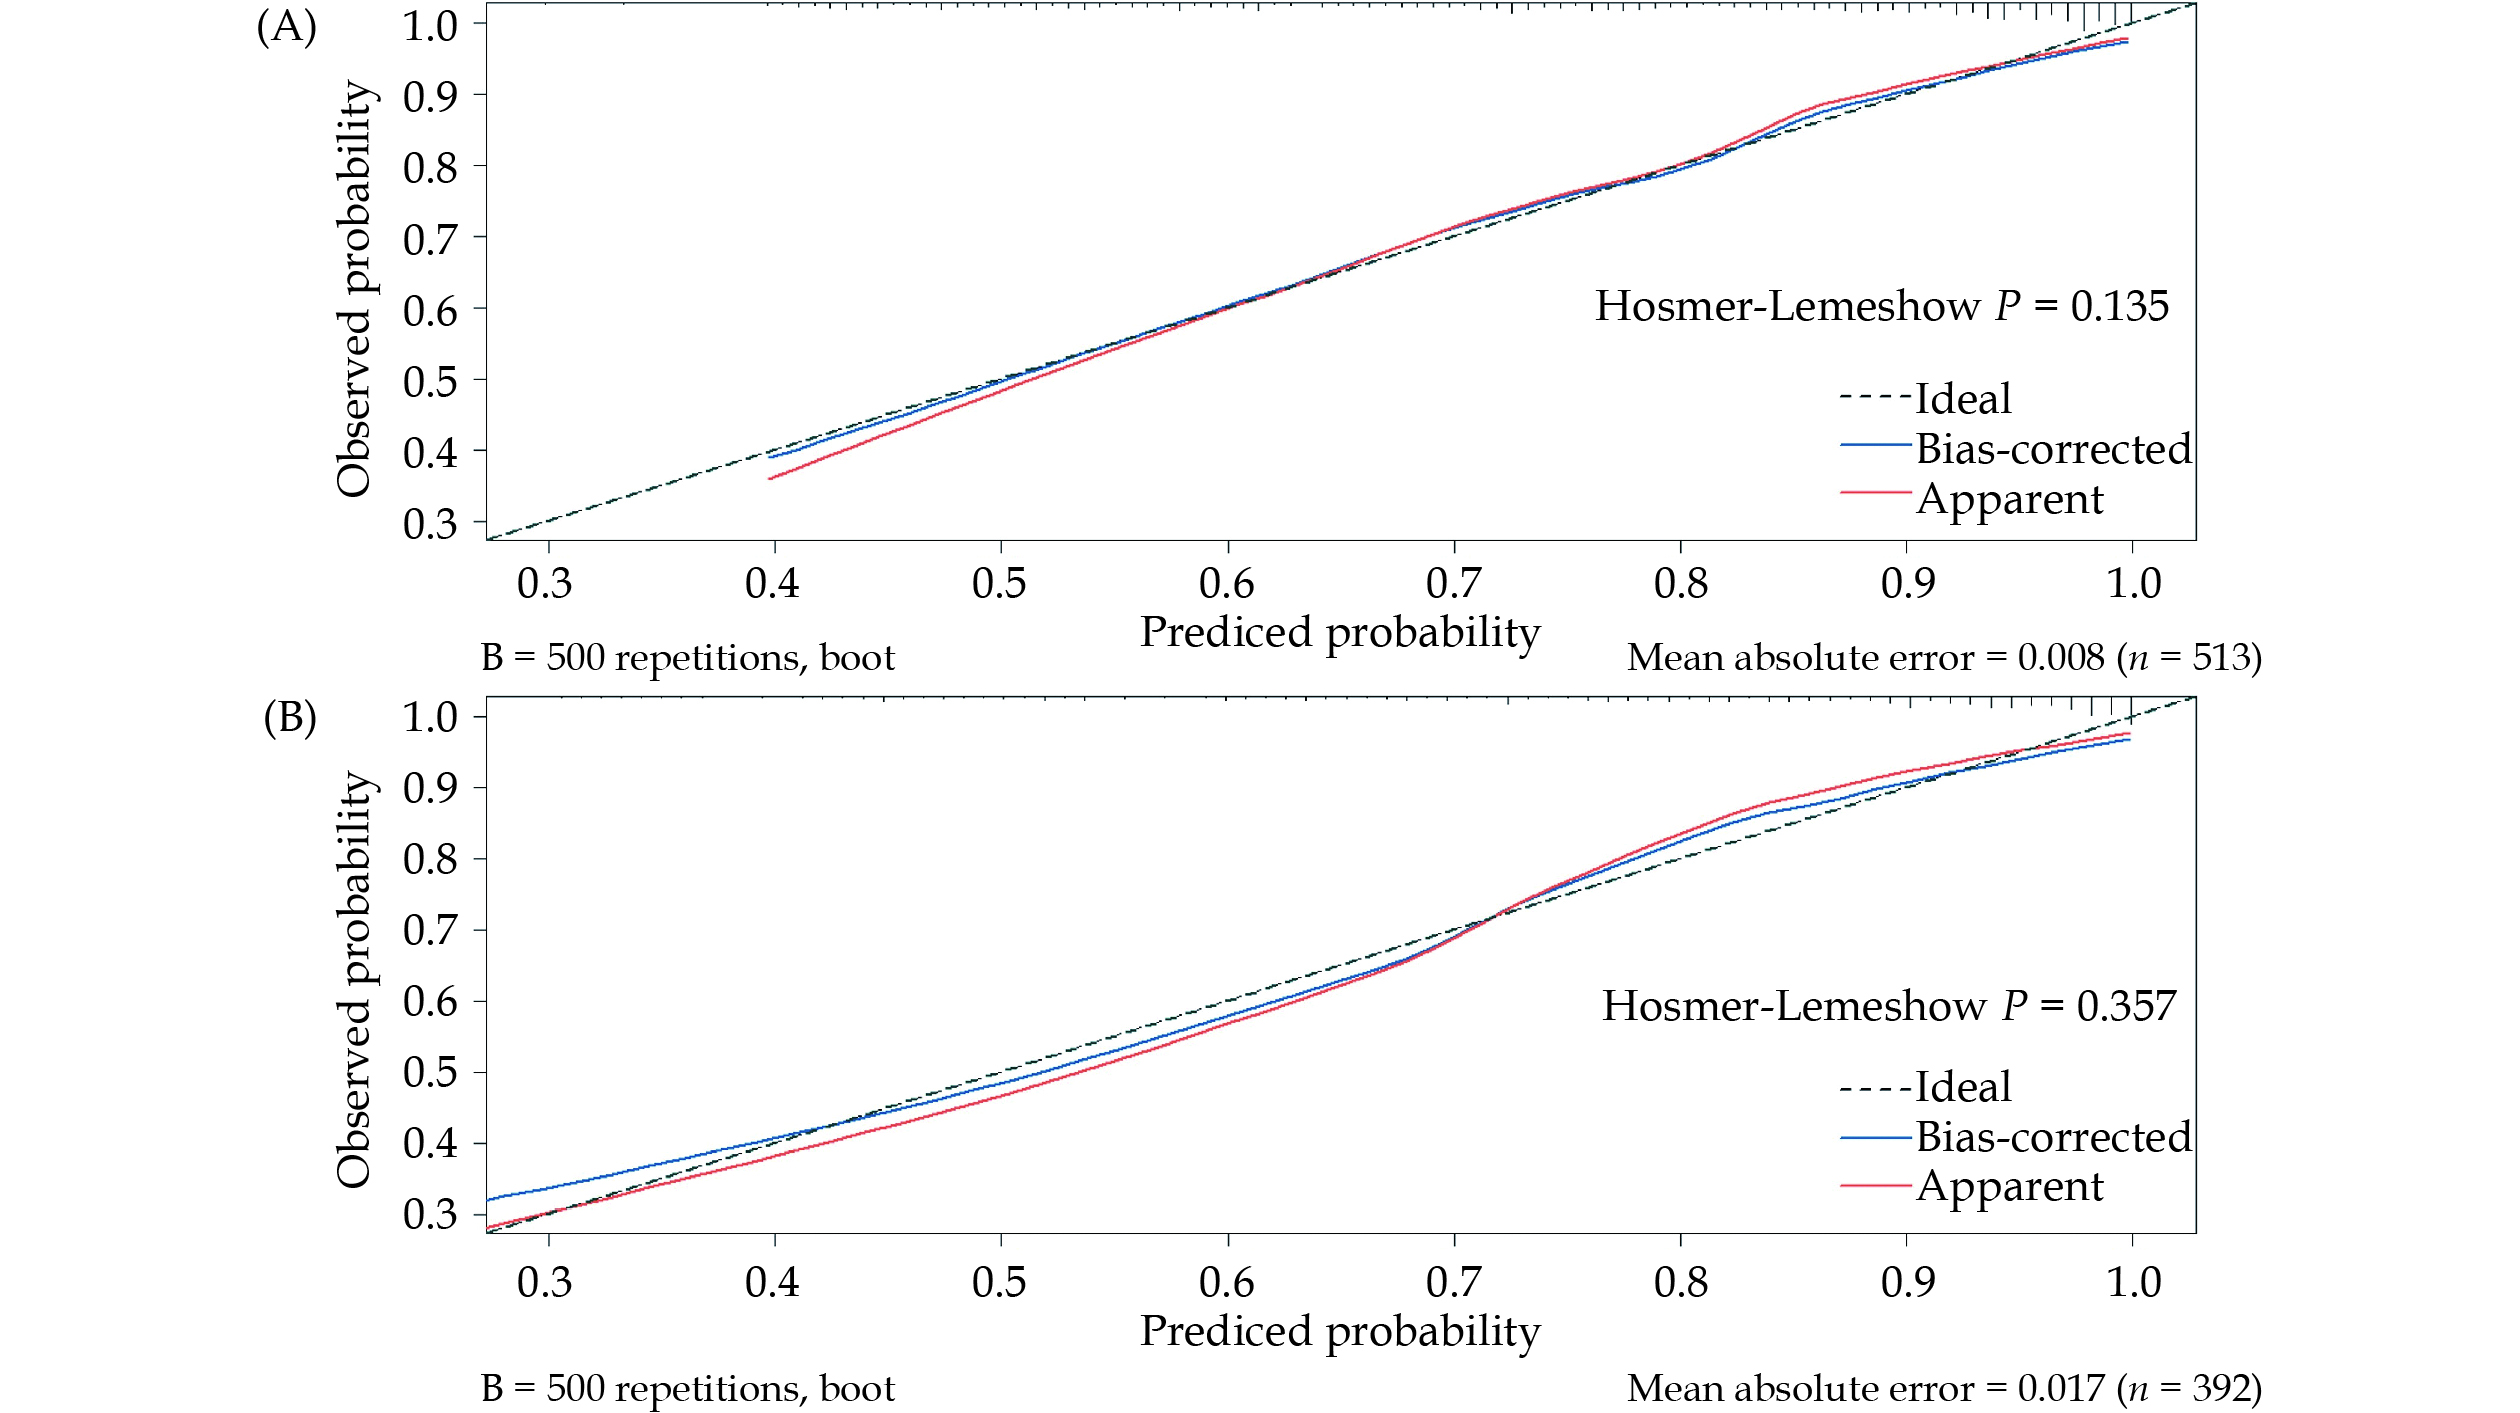
Calibration plots of both the MCG model and the best combined model were presented in Figure 6. These plots compared the predicted probability of severe coronary stenosis between the nomogram prediction and actual observations. Importantly, both P-values of the Hosmer-Lemeshow test were > 0.05, indicating the good predictive accuracy of the nomograms.
Figure
6.
Calibration curve of the nomogram.
Calibration plot of the nomogram in the magnetocardiography model (A) and combined model (B). The calibration curves depict the calibration of the nomogram in terms of the agreement between the predicted risk and the observed risk of severe coronary stenosis, both P-values of the Hosmer-Lemeshow test were > 0.05. The dotted line represents the performance of the nomogram, whereas the solid line corrects for any bias in the nomogram. The dashed line represents the reference line where an ideal nomogram would lie.
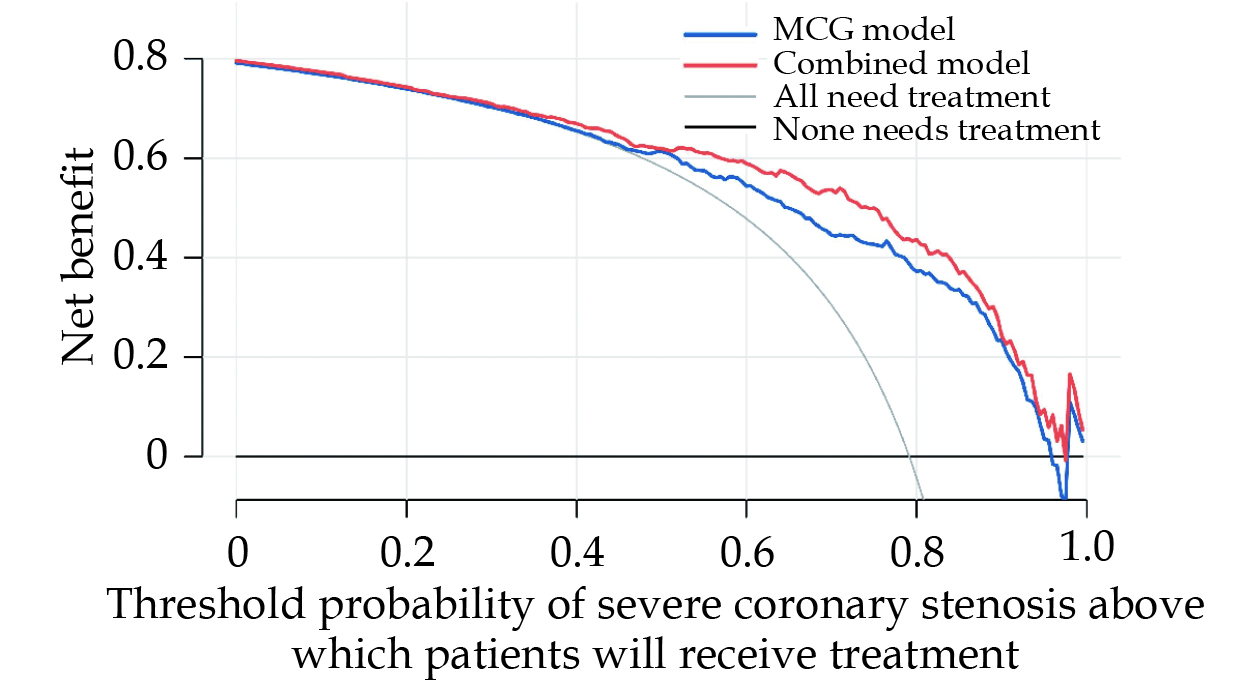
Finally, DCA was used to facilitate the comparison between MCG model and combined model. As seen in Figure 7, the DCA graphically showed the clinical usefulness of each model based on some probability threshold for CAD risk (x-axis) and corresponding the net benefit of using the model to risk stratify patients with severe coronary stenosis (y-axis). In this analysis, the combined model provided a larger net benefit across the range of risk compared with MCG model. For instance, at a threshold of 60% risk for CAD with severe coronary stenosis, the net benefit of combined model was 59.9% which was higher than that of MCG model (56.5%).
Figure
7.
Decision curve analysis for the nomogram.
Decision curve analysis for the MCG model (blue line) and combined model (red line). The MCG model showed a promise net benefit and the combined model provided a larger net benefit across the range of severe coronary stenosis risk compared with MCG model. MCG: magnetocardiography.
To the best of our knowledge, this is the first study assessing diagnostic performance of the model based on MFM parameters worldwide. We leveraged the MFM data obtained during the integrated cardiac period at resting to extract new parameters, allowing for a quantitative assessment of MFM characteristics. Seven of these MFM parameters exhibited significant differences between the two groups and were subsequently utilized to develop a predictive diagnostic model for distinguishing CAD patients with stenosis exceeding 70% from the nsCS group. Additionally, we incorporated clinical indicators such as T2DM and Apo A1 into the combined model to predict the probability of severe stenosis and validate its diagnostic value. The key findings of this study are as follows: (1) the parameter describing the distribution of magnetic dipole center trajectory innovatively extracted for the first time was validated with predictive value for severe coronary stenosis; (2) apart from ventricular repolarization, we found that the variation in the depolarization process can also be induced by myocardial ischemia, which is difficult to detect using ECG. However, we demonstrated that MFM parameters during ventricular depolarization (QR_MCTDd, QR_MVamp, S_MDp, and S_MA) can serve as predictors for the diagnosis of severe coronary stenosis; (3) the diagnostic efficacy of the resting MCG model was excellent; and (4) the combined model incorporating clinical parameters significantly improved the diagnostic accuracy, providing greater benefit for patients.
Myocardial ischemia often leads to regional ventricular repolarization abnormalities, which can be identified through ECG markers such as shifts in the ST interval or inversions of the T-wave.[17] Consequently, numerous studies have explored the predictive potential of MFM characteristics and repolarization currents as early diagnostic tools for ischemic heart disease.[18,19] Several MFM parameters calculated over the ST interval and T-wave have consistently shown abnormalities at rest in patients with CAD and have proven to be highly sensitive diagnostic indicators.[20,21] In our study, we not only reaffirmed the diagnostic validity of repolarization phase parameters at rest, including T_MA and TT_MAC50, but also introduced novel MFM characteristic parameters related to the depolarization phase. Specifically, we examined the distribution of the magnetic dipole center trajectory (MCTDb) and the magnetic pole vector based on amplitude (MVamp). MCTDb exhibited distinct patterns in patients with and without significant coronary stenosis, allowing us to create an atlas of MCTDb profiles for both healthy individuals and those with myocardial ischemia. Our analysis pinpointed QR_MCTDd as the parameter with the highest diagnostic performance. When assessing suspected patients, if their QR_MCTDd values predominantly fall within the range associated with a high probability of ischemia, it suggests a greater likelihood of significant coronary stenosis that may require further revascularization. MVamp, which quantifies the area of magnetic dipole rotation during specific intervals based on amplitude, exhibited significant statistical differences between controls and patients with CAD exhibiting stenosis above 70%. When incorporated into the diagnostic model, QR_MVamp demonstrated strong specificity and a PPV. This indicates that these parameters have the potential to be widely used in the future for the diagnosis of myocardial ischemia.
In a previous study, we explored repolarization heterogeneity by conducting bivariate correlation analysis between T-waves and developed a logistic regression model to distinguish CAD patients with stenosis above 70% from non-CAD patients. While the model achieved sensitivity, specificity, PPV, NPV, and accuracy of 72.9%, 65.9%, 74.8%, 63.6%, and 69.9%; respectively,[17] it became evident that misdiagnosis rates in clinical practice were relatively high. This study aims to address this concern by improving the specificity, PPV, and accuracy of the diagnostic model. To achieve this, additional MFM characteristic parameters in the depolarization phase were included. It is widely recognized that MCG is a highly sensitive yet less specific diagnostic tool, which is supported by previous research.[17,22–25] Consequently, the diagnostic model developed in this study exhibited lower sensitivity compared to specificity. This can be attributed, in part, to the incorporation of more MFM parameters during the ventricular depolarization phase, which inherently have low sensitivity but high specificity.
As we all known, all complications associated with T2DM are of clinical significance, particularly for CAD, which remains the leading cause of morbidity and mortality.[26,27] The results of univariate analysis in this study showed a significant difference in the prevalence of T2DM between the two groups. The inclusion of T2DM in the predictive model significantly improved diagnostic accuracy.
In the combined model, Apo A1 also emerged as an important predictive factor for CAD. This finding is consistent with previous studies that have reported a strong association between Apo A1 and the presence and severity of coronary artery stenosis in CAD patients but not in non-CAD patients.[28–30] Apolipoproteins are key structural proteins for lipoprotein particles, responsible for guiding lipid transport and facilitating lipid uptake and deposition in tissues, thereby playing a central role in cholesterol metabolism.[31] Recent research has emphasized the relationship between high apolipoprotein B levels, low Apo A1 levels, and an increased risk of cardiovascular disease, metabolic syndrome, and ischemic stroke.[30,32,33] Our study further confirmed the importance of Apo A1 in sensitively identifying severe coronary stenosis.
In clinical practice, determining the necessity of PCI by assessing the degree of vascular stenosis through CAG often poses challenges for cardiologists. Due to concerns for conservative management, cardiologists may tend to overestimate the severity of vascular stenosis. The precise nomograms of the MFM model and the combined model demonstrated excellent discrimination and calibration. DCA proved the model to be valuable in clinical decision-making. MCG is a non-invasive, radiation-free and time-saving method which just need 10 min to finish evaluating the risk of myocardial ischemia. It could be added into the clinical diagnostic pathway before CAG surgery with the nomogram predicting whether patients need revascularization or not. On the other hand, it can also reduce unnecessary invasive CAG and achieve accurate diagnosis and optimal treatment for patients, while bringing great economic value to the society.
LIMITATIONS
Several limitations should be acknowledged when interpreting the results of this study. Firstly, it is important to note that this study was conducted at a single center, and therefore, the effectiveness and generalizability of the predictive models need to be confirmed through large-scale multi-center clinical trials. Secondly, the limited number of patients in the nsCS group had a significant impact on the NPV, which did not meet the expected threshold. Thirdly, it is worth mentioning that the nsCS group included patients with varying degrees of stenosis, rather than solely consisting of heart-healthy patients. Additionally, it is important to consider that cardiologists often tend to overestimate the severity of vascular stenosis during CAG surgery, which could potentially affect the specificity of MCG detection. Therefore, the inclusion of coronary functional indicators such as coronary flow reserve and fractional flow reserve is crucial for a more comprehensive assessment of ischemia, and this remains an important focus for our future research. Last but not least, it is important to note that this study only collected resting-state MFM data from patients. Many patients may not exhibit ischemic symptoms during rest, such as microcirculation dysfunction. Therefore, it is essential to incorporate MFM parameters obtained during exercise and stress tests, whether induced by drugs or physical activity, in order to more accurately assess myocardial ischemia and its severity.
CONCLUSIONS
The novel quantitative MFM parameters, QR_MCTDd, T_MA, and R_MA, demonstrate promising predictive capabilities with robust diagnostic performance. The developed MCG model and combined model exhibit improved discrimination between patients with severe and mild to moderate coronary stenosis, while also displaying good calibration between expected and observed risk. Upon evaluation, these models demonstrate valuable clinical application and can assist patients and doctors in making informed clinical decisions. These findings present promising new avenues for research and warrant further exploration. Future revisions or validations should involve large-scale and multi-center-based studies.
ACKNOWLEDGMENTS
This study was supported by the National Key Research and Development Program (No.2022YFC2407001). All authors had no conflicts of interest to disclose. The authors express their gratitude to all the researchers and patients who participated in this study.
Her AY, Dischl D, Kim YH, et al. Magnetocardiography for the detection of myocardial ischemia. Front Cardiova sc Med 2023; 10: 1242215. doi: 10.3389/fcvm.2023.1242215
[2]
Lin GA, Dudley RA, Lucas FL, et al. Frequency of stress testing to document ischemia prior to elective percutaneous coronary intervention. JAMA 2008; 300: 1765−1773. doi: 10.1001/jama.300.15.1765
[3]
Lin GA, Lucas FL, Malenka DJ, et al. Mortality in Medicare patients undergoing elective percutaneous coronary intervention with or without antecedent stress testing. Circ Cardiovasc Qual Outcomes 2013; 6: 309−314. doi: 10.1161/CIRCOUTCOMES.113.000138
[4]
Park JW, Shin ES, Ann SH, et al. Validation of magnetocardiography versus fractional flow reserve for detection of coronary artery disease. Clin Hemorheol Microcirc 2015; 59: 267−281. doi: 10.3233/CH-141912
[5]
Pena ME, Pearson CL, Goulet MP, et al. A 90-second magnetocardiogram using a novel analysis system to assess for coronary artery stenosis in Emergency department observation unit chest pain patients. Int J Cardiol Heart Vasc 2020; 26: 100466. doi: 10.1016/j.ijcha.2019.100466
[6]
Beadle R, McDonnell D, Ghasemi-Roudsari S, et al. Assessing heart disease using a novel magnetocardiography device. Biomed Phys Eng Express 2021; 7. doi: 10.1088/2057-1976/abe5c5
[7]
Park JW, Hill PM, Chung N, et al. Magnetocardiography predicts coronary artery disease in patients with acute chest pain. Ann Noninvasive Electrocardiol 2005; 10: 312−323. doi: 10.1111/j.1542-474X.2005.00634.x
[8]
Xue J, Li J, Sun D, et al. Functional evaluation of intermediate coronary lesions with integrated computed tomography angiography and invasive angiography in patients with stable coronary artery disease. J Transl Int Med 2022; 10: 255−263. doi: 10.2478/jtim-2022-0018
[9]
Stinstra JG, Shome S, Hopenfeld B, et al. Modelling passive cardiac conductivity during ischaemia. Med Biol Eng Comput 2005; 43: 776−782. doi: 10.1007/BF02430957
[10]
Lim HK, Chung N, Kim K, et al. Can magnetocardiography detect patients with non-ST-segment elevation myocardial infarction? Ann Med 2007; 39: 617–627. doi: 10.1080/07853890701538040
[11]
Shin ES, Chung JH, Park SG, et al. Comparison of exercise electrocardiography and magnetocardiography for detection of coronary artery disease using ST-segment fluctuation score. Clin Hemorheol Microcirc 2019; 73: 283−291. doi: 10.3233/CH-180485
[12]
Shin ES, Park JW, Lim DS. Magnetocardiography for the diagnosis of non-obstructive coronary artery disease. Clin Hemorheol Microcirc 2018; 69: 9−11. doi: 10.3233/CH-189106
[13]
Liu Z, Huang Y, Li H, et al. A generalized deep learning model for heart failure diagnosis using dynamic and static ultrasound. J Transl Int Med 2023; 11: 138−144. doi: 10.2478/jtim-2023-0088
[14]
Kwon H, Kim K, Lee YH, et al. Non-invasive magnetocardiography for the early diagnosis of coronary artery disease in patients presenting with acute chest pain. Circ J 2010; 74: 1424−1430. doi: 10.1253/circj.CJ-09-0975
[15]
Agarwal R, Saini A, Alyousef T, et al. Magnetocardiography for the diagnosis of coronary artery disease: a systematic review and meta-analysis. Ann Noninvasive Electr ocardiol 2012; 17: 291−298. doi: 10.1111/j.1542-474X.2012.00538.x
[16]
Tang FK, Li JX, Li YL, et al. [Diagnostic requirements for magnetocardiagram of myocardial ischemia in clinical application]. Chin Heart J 2023; 35: 621−628. [In Chinese]. doi: 10.12125/j.chj.202305008
[17]
Huang X, Hua N, Tang F, et al. Effectiveness of magnetocardiography to identify patients in need of coronary artery revascularization: a cross-sectional study. Cardiovasc Diagn Ther 2020; 10: 831−840. doi: 10.21037/cdt-20-121
[18]
Li Y, Che Z, Quan W, et al. Diagnostic outcomes of magnetocardiography in patients with coronary artery disease. Int J Clin Exp Med 2015; 8: 2441−2446.
[19]
Lim HK, Kwon H, Chung N, et al. Usefulness of magnetocardiogram to detect unstable angina pectoris and non-ST elevation myocardial infarction. Am J Cardiol 2009; 103: 448−454. doi: 10.1016/j.amjcard.2008.10.013
[20]
Shin ES, Lam YY, Her AY, et al. Incremental diagnostic value of combined quantitative and qualitative parameters of magnetocardiography to detect coronary artery disease. Int J Cardiol 2017; 228: 948−952. doi: 10.1016/j.ijcard.2016.11.165
[21]
Bang WD, Kim K, Lee YH, et al. Repolarization heterogeneity of magnetocardiography predicts long-term prognosis in patients with acute myocardial infarction. Yonsei Med J 2016; 57: 1339−1346. doi: 10.3349/ymj.2016.57.6.1339
[22]
Kangwanariyakul Y, Nantasenamat C, Tantimongcolwat T, et al. Data mining of magnetocardiograms for prediction of ischemic heart disease. EXCLI J 2010; 9: 82−95.
[23]
Steinberg BA, Roguin A, Watkins SP 3rd, et al. Magnetocardiogram recordings in a nonshielded environment--reproducibility and ischemia detection. Ann Noninvasive El ectrocardiol 2005; 10: 152–160. doi: 10.1111/j.1542-474X.2005.05611.x
[24]
Goernig M, Liehr M, Tute C, et al. Magnetocardiography based spatiotemporal correlation analysis is superior to conventional ECG analysis for identifying myocardial injury. Ann Biomed Eng 2009; 37: 107−111. doi: 10.1007/s10439-008-9598-5
[25]
Wu YW, Lin LC, Tseng WK, et al. QTc heterogeneity in rest magnetocardiography is sensitive to detect coronary artery disease: in comparison with stress myocardial perfusion imaging. Acta Cardiol Sin 2014; 30: 445−454.
[26]
Arnold SV, Bhatt DL, Barsness GW, et al. Clinical management of stable coronary artery disease in patients with type 2 diabetes mellitus: a scientific statement from the American Heart Association. Circulation 2020; 141: e779−e806. doi: 10.1161/CIR.0000000000000766
[27]
Cavender MA, Steg PG, Smith SC Jr, et al. Impact of diabetes mellitus on hospitalization for heart failure, cardiovascular events, and death: outcomes at 4 years from the Reduction of Atherothrombosis for Continued Health registry. Circulation 2015; 132: 923−931. doi: 10.1161/CIRCULATIONAHA.114.014796
[28]
Hua R, Li Y, Li W, et al. Apolipoprotein B/A1 ratio is associated with severity of coronary artery stenosis in CAD patients but not in non-CAD patients undergoing percutaneous coronary intervention. Dis Markers 2021; 2021: 8959019. doi: 10.1155/2021/8959019
[29]
Bodde MC, Hermans MPJ, Jukema JW, et al. Apolipoproteins A1, B, and apoB/apoA1 ratio are associated with first ST-segment elevation myocardial infarction but not with recurrent events during long-term follow-up. Clin Res Cardiol 2019; 108: 520−538. doi: 10.1007/s00392-018-1381-5
[30]
Dong H, Chen W, Wang X, et al. Apolipoprotein A1, B levels, and their ratio and the risk of a first stroke: a meta-analysis and case-control study. Metab Brain Dis 2015; 30: 1319−1330. doi: 10.1007/s11011-015-9732-7
[31]
Bolanos-Garcia VM, Miguel RN. On the structure and function of apolipoproteins: more than a family of lipid-binding proteins. Prog Biophys Mol Biol 2003; 83: 47−68. doi: 10.1016/S0079-6107(03)00028-2
[32]
Walldius G, Jungner I. The apoB/apoA-I ratio: a strong, new risk factor for cardiovascular disease and a target for lipid-lowering therapy: a review of the evidence. J Intern Med 2006; 259: 493−519. doi: 10.1111/j.1365-2796.2006.01643.x
[33]
Jung CH, Hwang JY, Yu JH, et al. The value of apolipoprotein B/A1 ratio in the diagnosis of metabolic syndrome in a Korean population. Clin Endocrinol (Oxf) 2012; 77: 699−706. doi: 10.1111/j.1365-2265.2012.04329.x
Wu T, Zhao X, Feng L, et al. Comparison of magnetocardiography and coronary computed tomographic angiography for detection of coronary artery stenosis and the influence of calcium. Eur Radiol, 2025.
DOI:10.1007/s00330-025-11389-4. Online ahead of print
2.
Fenici R, Picerni M, Fenici P, et al. An advanced vision of magnetocardiography as an unrivalled method for a more comprehensive non-invasive clinical electrophysiological assessment. Am Heart J Plus, 2025, 52: 100514.
DOI:10.1016/j.ahjo.2025.100514
Table
2.
Demographic characteristics and clinical indicators of the study patients (n = 513).
Variables
The nsCS group (n = 107)
The sCS group (n = 406)
P-value
Age, yrs
60.7 ± 10.4
61.4 ± 9.8
0.409
Heart rate, beats/min
78.2 ± 10.2
78.1 ± 10.9
0.924
Body mass index, kg/m2
29.0 ± 36.7
25.7 ± 3.1
0.736
Male sex
78 (72.9%)
316 (77.8%)
0.282
Typical symptoms
93 (86.9%)
372 (91.6%)
0.137
Hypertension
62 (57.9%)
268 (66.0%)
0.121
Type 2 diabetes mellitus
25 (23.4%)
145 (35.7%)
0.016
Smoking
36 (33.6%)
151 (37.2%)
0.498
Family history
19 (17.8%)
63 (15.5%)
0.574
Total protein, g/L
67.73 ± 4.87
68.43 ± 4.83
0.269
Serum albumin, g/L
42.07 ± 3.13
41.93 ± 3.47
0.664
Myoglobin, ng/mL
37.58 ± 72.3
37.69 ± 35.62
0.123
Creatine kinase-MB, U/L
1.43 ± 1.15
1.47 ± 1.03
0.533
B-type natriuretic peptide, pmol/L
55.75 (18.15–95.55)*
65.30 (25.20–145.10)*
0.013
Total cholesterol, mmol/L
3.86 ± 1.05
3.7 ± 0.95
0.141
Triglycerides, mmol/L
1.54 ± 1.1
1.62 ± 0.93
0.17
Apoprotein A1, g/L
1.361 ± 0.287
1.255 ± 0.224
0.002
Apoprotein B, g/L
0.674 ± 0.194
0.646 ± 0.187
0.195
High-density lipoprotein, mmol/L
1.18 ± 0.32
1.08 ± 0.27
0.002
Low-density lipoprotein, mmol/L
2.27 ± 0.93
2.19 ± 0.86
0.464
Blood glucose, mmol/L
5.68 ± 1.58
5.84 ± 1.82
0.274
C-reactive protein, mg/dL
0.21 ± 0.4
0.25 ± 0.68
0.072
Interleukin 6, ng/L
2.98 ± 2.93
4.97 ± 14.73
0.052
Fibrinogen, g/L
3.02 ± 0.7
3.19 ± 0.72
0.012
D-dimer, μg/mL
0.24 ± 0.15
0.36 ± 0.62
< 0.001
Data are presented as means ± SD or n (%). *Presented as median (interquartile range). nsCS: non-severe coronary stenosis; sCS: severe coronary stenosis.
Table
4.
The effectiveness of magnetocardiography parameter and combined parameters in predictive diagnostic model for detection of coronary artery disease with above 70% stenosis.
Parameters
Reference range
Receiver operating characteristic area (95% CI)
Cutoff
Sensitive
Specificity
PPV
NPV
Diagnostic accuracy
P-value
Magnetocardiography parameters
All magnetocardiography parameters
–
0.81 (0.765–0.855)
0.765
71.7%
80.4%
93.3%
42.8%
73.5%
< 0.001
QR_MCTDd
–
0.655 (0.601–0.709)
0.742
70%
53.3%
85%
31.8%
66.5%
< 0.001
QR_MVamp
–
0.597 (0.539–0.654)
0.823
34.2%
85%
89.7%
25.4%
44.8%
0.001
S_MDp
–
0.591 (0.536–0.647)
0.793
44.3%
76.6%
87.8%
26.6%
51.1%
0.001
T_MA, degree
−90 to −11
0.657 (0.624–0.690)
0.836
37.9%
93.5%
95.7%
28.4%
49.5%
< 0.001
R_MA, degree
−79 to −21
0.594 (0.556–0.633)
0.828
31%
87.9%
90.6%
25.1%
42.9%
< 0.001
S_MA, degree
48 to 173
0.588 (0.546–0.631)
0.818
34.5%
83.2%
88.6%
25.1%
44.6%
< 0.001
TT_MAC50, degree
0.1 to 0.2
0.512 (0.482–0.543)
0.766
93.1%
9.3%
79.6%
26.3%
75.6%
0.805
Combined parameters*
Apoprotein A1
–
0.845 (0.798–0.892)
0.712
84.3%
73.8%
92.6%
54.6%
82.1%
< 0.001
D-dimer
–
0.824 (0.780–0.868)
0.836
64.1%
85.7%
94.5%
38.5%
68.6%
< 0.001
B-type natriuretic peptide
–
0.820 (0.774–0.865)
0.796
70.5%
79.4%
93%
40.9%
72.3%
< 0.001
Fibrinogen
–
0.818 (0.773–0.863)
0.684
83.4%
67.3%
90.6%
51.8%
80%
< 0.001
*Refer to includ magnetocardiography parameters and type 2 diabetes mellitus. NPV: negative predictive value; PPV: positive predictive value.


 DownLoad: