Figure
1.
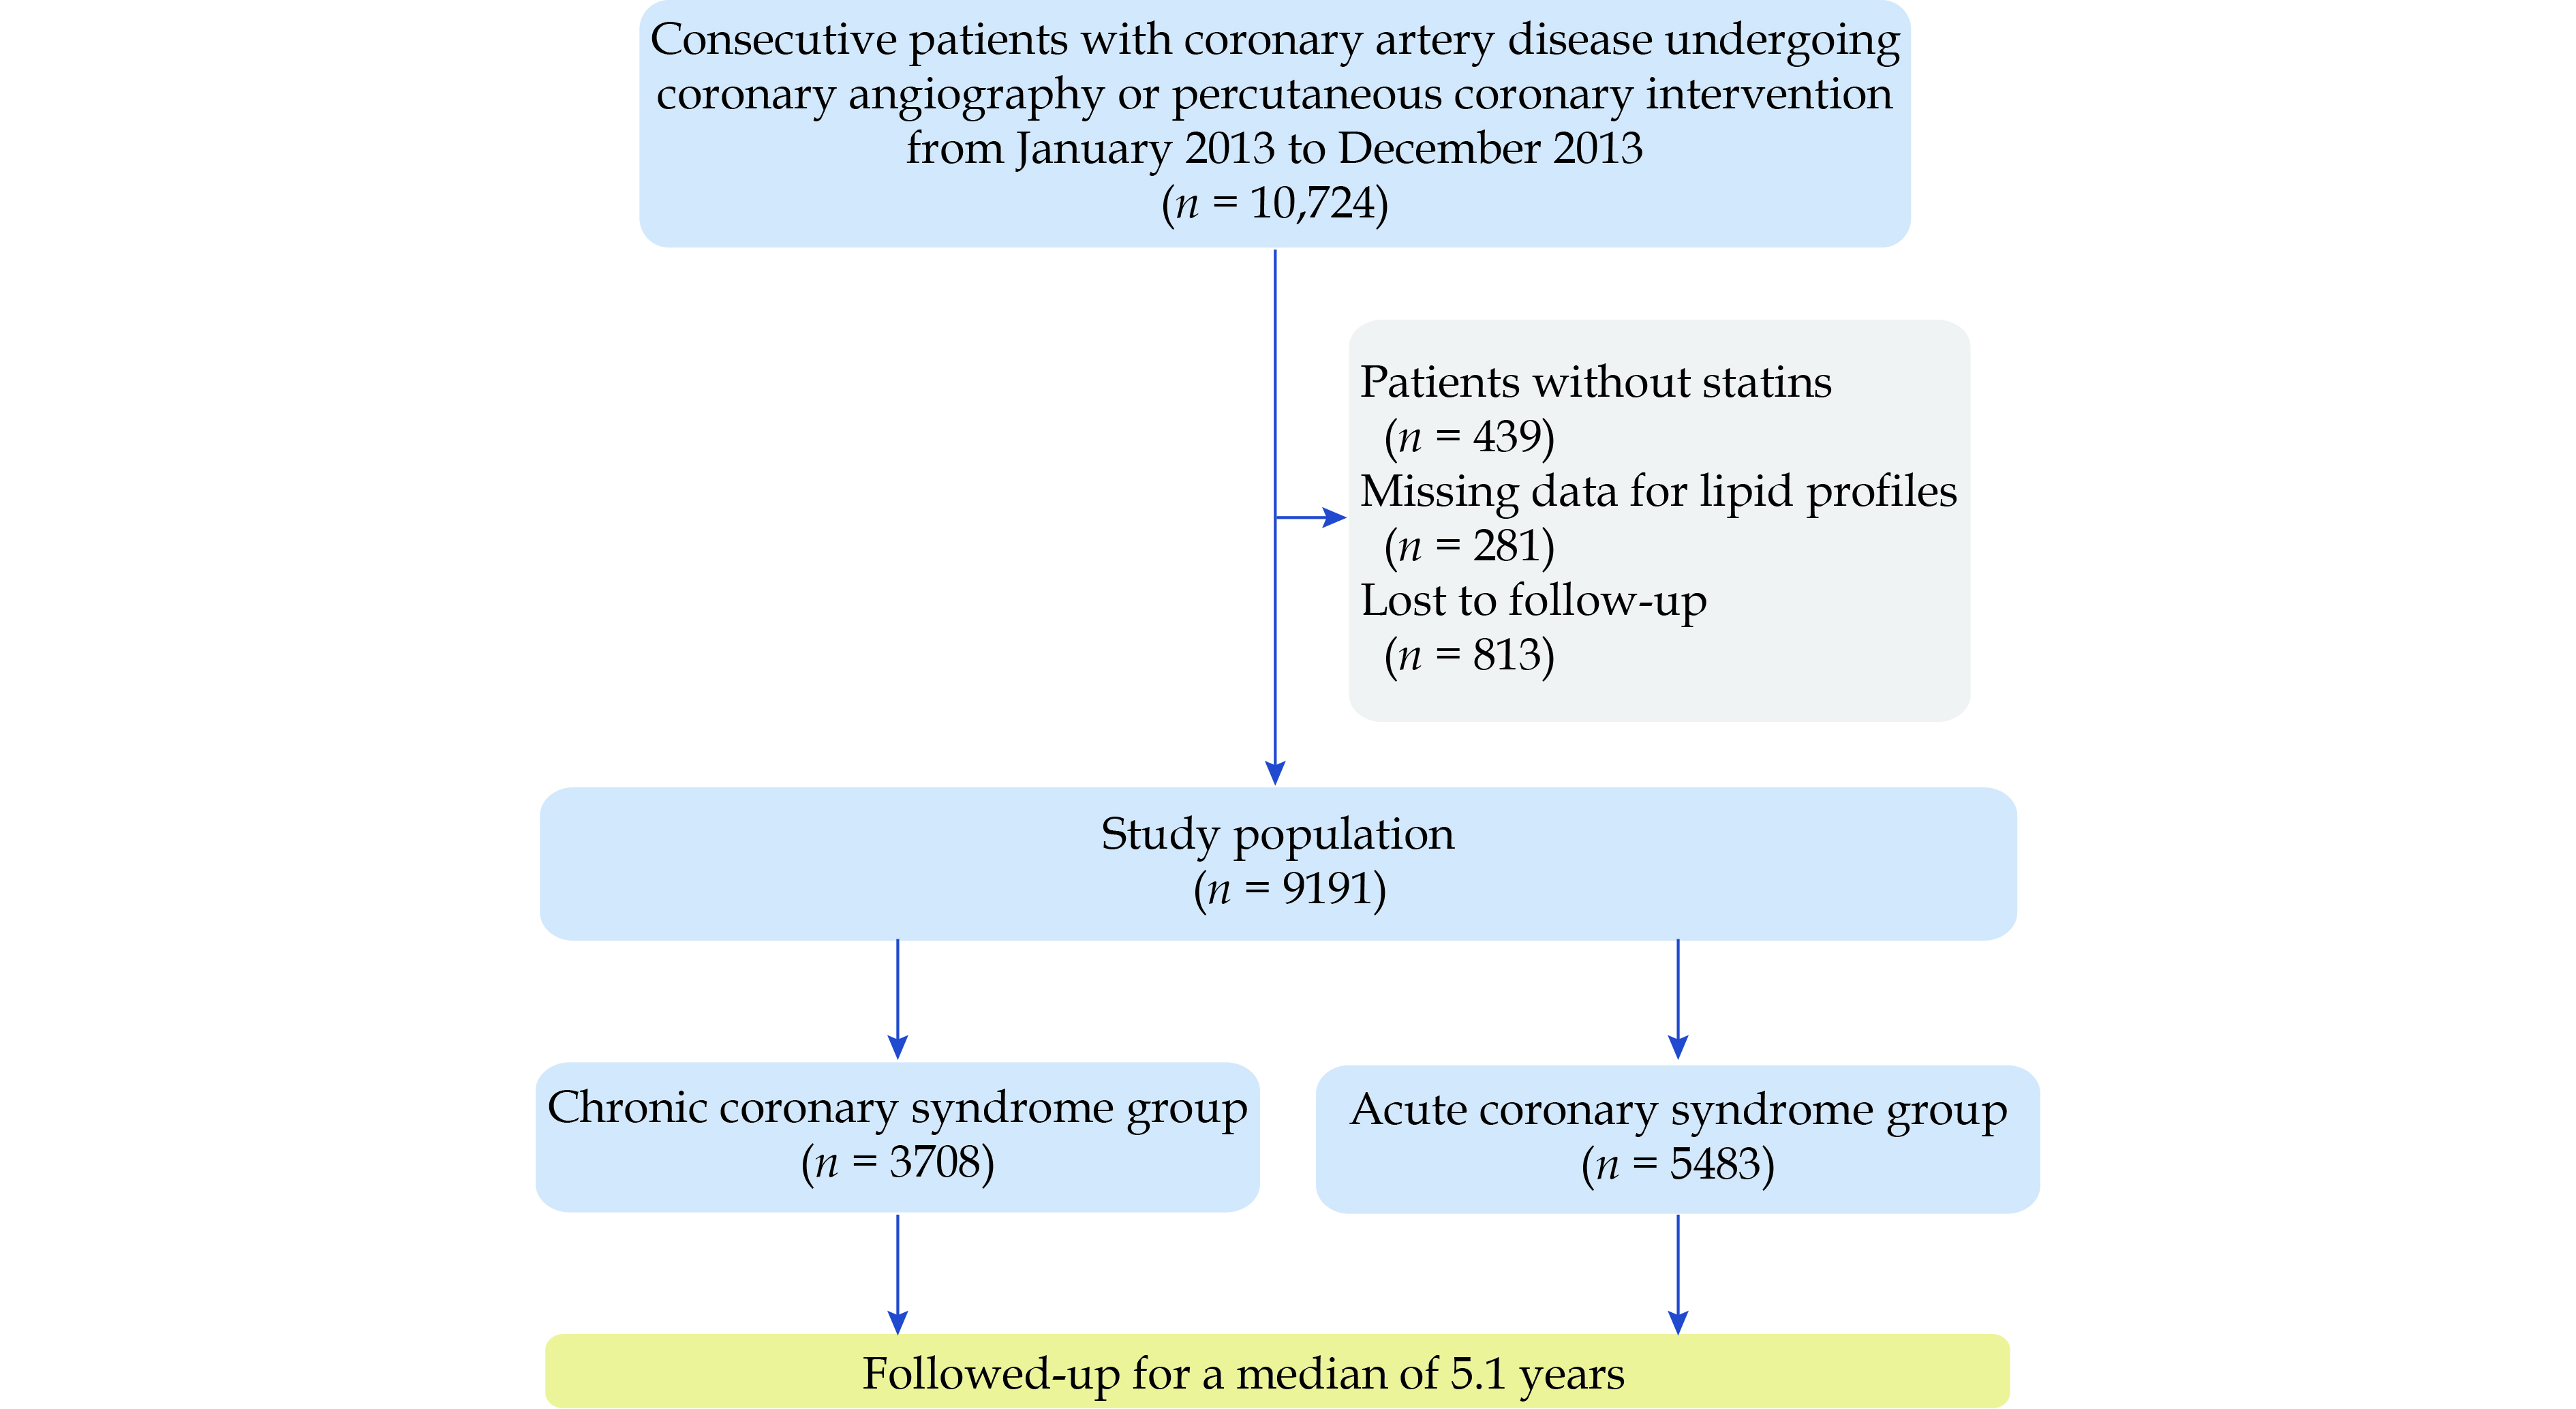
Study flowchart.

| Citation: |
Please cite this article as: LI TY, ZHU P, SONG Y, TANG XF, GAO Z, GAO RL, YUAN JQ. Discordance analysis for apolipoprotein and lipid measures for predicting myocardial infarction in statin-treated patients with coronary artery disease: a cohort study. J Geriatr Cardiol 2023; 20(12): 845−854. DOI: 10.26599/1671-5411.2023.12.001.

|
Statins are the most commonly used lipid-lowering drugs for the secondary prevention of coronary artery disease (CAD) as they effectively lower low-density lipoprotein cholesterol (LDL-C) levels. Nevertheless, even when statin therapy achieves ideal LDL-C levels, CAD patients still encounter cardiovascular events due to elevated levels of other atherogenic particles, notably non-high-density lipoprotein cholesterol (non-HDL-C) and apolipoprotein B (apoB).[1] The selection of the optimal lipid or apolipoprotein measures for identifying statin-treated CAD patients at residual risk of cardiovascular events remains an unresolved issue.
Non-HDL-C represents the total cholesterol content within atherogenic particles, including intermediate-density lipoprotein, low-density lipoprotein, very LDL-C, lipoprotein (a), chylomicrons, and chylomicron remnants. On the other hand, apoB represents the total number of these atherogenic particles. The ratios of non-HDL-C/HDL-C and apoB/apolipoprotein A-1 (apoA-1) reflect the balance between atherogenic and anti-atherogenic factors. Discordance analysis is superior to conventional methods for these biologically linked markers because it enables a direct comparison of which marker contributes more to the risk in the discordance groups, avoiding the influence of the correlation between the markers in the concordance groups.[2] Previous discordance analysis studies have compared the predictive powers of different apolipoprotein and lipid measures for cardiovascular disease in healthy populations[3,4] and statin-treated patients with hypercholesterolemia.[5] However, to our knowledge, no studies have compared the predictive powers of different apolipoprotein and lipid measures for residual cardiovascular events in statin-treated CAD patients from the secondary prevention perspective. The objective of this study is to address this gap in the existing literature and provide valuable insights into this area of research.
The cohort study consecutively recruited 10,724 CAD patients undergoing percutaneous coronary intervention at Fuwai Hospital, Chinese Academy of Medical Sciences and Peking Union Medical College, Beijing, China, from January 2013 to December 2013. Details on the catheterization procedure were previously described.[6] Baseline information was extracted from the electronic medical records. All participants were followed up by an independent group of clinical research coordinators through telephone interviews or clinic visits at five time points (one-month, six-month, twelve-month, two-year, and five-year after discharge). Two independent cardiologists adjudicated endpoint events, and any disagreement was resolved by consensus. The study complied with the Declaration of Helsinki. The Review Board of Fuwai Hospital, Chinese Academy of Medical Sciences and Peking Union Medical College (No.2013-449) in Beijing, China approved the study protocol before enrolment. All participants provided written informed consents before intervention.
This post-hoc analysis used discordance analysis to compare apoB, non-HDL-C, LDL-C, apoB/apoA-1, and non-HDL-C/HDL-C in predicting myocardial infarction (MI) in statin-treated CAD patients. Patients without statins, missing data on lipid profiles, and those who lost to follow-up were excluded from this analysis. The study population was then classified into two groups according to the clinical presentation of CAD [chronic coronary syndrome (CCS) and acute coronary syndrome (ACS)].
Venous blood samples were obtained after fasting for at least 12 h and tested within 24 h after admission. Lipid profiles were assayed using an automatic biochemistry analyzer (Hitachi 7150, Tokyo, Japan). In detail, concentrations of apoB and apoA-1 were measured by an immunoturbidimetric method, and concentrations of total cholesterol, LDL-C, and HDL-C were measured by an enzymatic method. The concentration of non-HDL-C was calculated as total cholesterol minus HDL-C.
All participants without documented contraindications received statins and dual anti-platelet therapy with aspirin plus clopidogrel. Other cardiovascular medications, such as beta-blockers, angiotensin-converting enzyme inhibitors, or angiotensin receptor blockers, were prescribed according to patients’ conditions and contemporary guidelines.
The study endpoint was MI diagnosed according to the Third Universal Definition of Myocardial Infarction. Body mass index ≥ 30 kg/m2 was considered obesity. Diabetes mellitus (DM) was defined as glycated hemoglobin > 6.5% or self-reported DM. Hypertension was defined as mean blood pressure ≥ 140/90 mmHg or self-reported hypertension.
Baseline characteristics between the CCS and ACS groups and among concordance/discordance groups of each pair of measures were compared using the Pearson’s chi-squared test, the Kruskal-Wallis test, or the Mann-Whitney U test, as appropriate. Categorical variables are shown as counts (percentages). Continuous variables are expressed as medians (interquartile range). Covariables for adjustment included sex, age (continuous), current smoking, hypertension, previous revascularization, previous MI, and high-sensitivity C-reactive protein.
The relation between MI and each measure on a continuous scale was visualized with a restricted cubic spline with four knots. The lowest concentration of each measure was set as the reference. The hazard ratio (HR) with 95% CI for MI per 1-standard deviation increase in each measure were estimated by Cox proportional hazards regression.
Discordance analysis was performed to compare the associations of the following pairs of measures with the MI: apoB versus non-HDL-C, apoB versus LDL-C, non-HDL-C versus LDL-C, apoB/apoA-1 versus apoB, non-HDL-C/HDL-C versus non-HDL-C, and apoB/apoA-1 versus non-HDL-C/HDL-C. Lipid and apolipoprotein measures were categorized according to medians. Concordance was defined as both measures being less than or equal to the medians or greater. Discordance was defined as one measure being less than or equal to the median while another was greater. Event-free survival rates among concordance/discordance groups were plotted using the Kaplan-Meier survival curves. The HR with 95% CI was estimated by Cox proportional hazards regression.
DM and obesity affect lipid profiles through metabolic pathways; thus, discordance analysis was repeated in patients stratified by glycemic status and body mass index category as a sensitivity analysis instead of adjusting the two variables as confounders.
All analyses were performed using the R statistical software 3.6.3 (R Core Team 2020, Vienna, Austria; http://www.r-project.org). Figures were created by GraphPad Prism software 8.0.2 (GraphPad Software, San Diego, California, USA; http://www.graphpad.com). Two-sided P-value < 0.05 were considered statistically significant.
After excluding 439 patients without statins, 281 patients with missing data for lipid profiles, and 813 patients who lost to five-year follow-up, the study included 9191 statin-treated CAD patients, with 3708 patients in the CCS group and 5483 patients in the ACS group (Figure 1). A total of 538 MIs (5.85%) occurred during a median follow-up period of 5.1 years (interquartile range: 5.1–5.1 years), with 216 MIs (5.83%) in CCS patients and 322 MIs (5.87%) in ACS patients.
Baseline characteristics of the study population and patients in the CCS and ACS groups are shown in Table 1. The mean age of the study population was 59 years (interquartile range: 18–91 years), and 22.66% of patients were women. Median values of the apolipoprotein and lipid measures for the study population were 0.80 g/L for apoB, 3.01 mmol/L for non-HDL-C, 2.35 mmol/L for LDL-C, 0.61 for apoB/apoA-1 and 3.04 for non-HDL-C/HDL-C. ACS patients were more likely to be current smokers and had higher high-sensitivity C-reactive protein levels. CCS patients were more likely to have comorbidities (hypertension, DM, and peripheral artery disease), previous MI, and previous revascularization. Compared with the ACS group, the median values of apoB and apoB/apoA-1 were slightly but significantly lower in the CCS group. The median values of non-HDL-C, LDL-C, and non-HDL-C/HDL-C were higher in the ACS group than in the CCS group. Baseline characteristics among concordance/discordance groups between each pair of measures are shown in supplemental material, Table 1S–Table 6S.
| Characteristics | All participants (n = 9191) |
Chronic coronary syndrome group (n = 3708) |
Acute coronary syndrome group (n = 5483) |
P-value |
| Women | 2083 (22.66%) | 821 (22.14%) | 1262 (23.02%) | 0.325 |
| Age, yrs | 59 (51–65) | 59 (51–65) | 59 (51–66) | 0.944 |
| ≥ 65 yrs | 2545 (27.69%) | 1010 (27.24%) | 1535 (28.00%) | 0.426 |
| Body mass index, kg/m2 | 25.91 (23.88–27.77) | 25.95 (24.03–27.77) | 25.85 (23.81–27.76) | 0.040 |
| ≥ 30 kg/m2 | 921 (10.02%) | 400 (10.79%) | 521 (9.50%) | 0.044 |
| Current smoking | 5247 (57.09%) | 2050 (55.29%) | 3197 (58.31%) | 0.004 |
| Diabetes mellitus | 3684 (40.08%) | 1583 (42.69%) | 2101 (38.32%) | < 0.001 |
| Oral antidiabetic agents | 1562 (42.40%) | 688 (43.46%) | 874 (41.60%) | 0.257 |
| Insulin | 980 (26.60%) | 424 (26.78%) | 556 (26.46%) | 0.827 |
| Hypertension | 6395 (69.58%) | 2654 (71.57%) | 3741 (68.23%) | < 0.001 |
| Peripheral artery disease | 249 (2.71%) | 128 (3.45%) | 121 (2.21%) | < 0.001 |
| Previous myocardial infarction | 1782 (19.39%) | 1045 (28.18%) | 737 (13.44%) | < 0.001 |
| Previous revascularization | 2384 (25.94%) | 1133 (30.56%) | 1251 (22.82%) | < 0.001 |
| Estimated glomerular filtration rate, mL/min per 1.73 m2 | 118.08 (102.60–133.27) | 118.75 (103.63–134.34) | 117.67 (101.85–132.58) | 0.003 |
| Left ventricular ejection fraction, % | 64 (60–67) | 64 (60–68) | 63 (60–67) | < 0.001 |
| Triglycerides, mmol/L | 1.53 (1.14–2.10) | 1.51 (1.13–2.07) | 1.55 (1.15–2.11) | 0.026 |
| Apolipoprotein B, g/L | 0.80 (0.67–0.98) | 0.79 (0.66–0.97) | 0.81 (0.67–0.98) | 0.007 |
| Apolipoprotein A-1, g/L | 1.31 (1.18–1.48) | 1.33 (1.20–1.49) | 1.30 (1.17–1.47) | < 0.001 |
| Lipoprotein (a), mg/dL | 18.53 (7.87–41.28) | 18.17 (7.62–41.23) | 18.64 (79.81–41.29) | 0.616 |
| Non-high-density lipoprotein cholesterol, mmol/L | 3.01 (2.43–3.76) | 2.96 (2.39–3.73) | 3.05 (2.46–3.79) | < 0.001 |
| Low-density lipoprotein cholesterol, mmol/L | 2.35 (1.86–3.02) | 2.31 (1.83–2.99) | 2.39 (1.88–3.04) | < 0.006 |
| High-density lipoprotein cholesterol, mmol/L | 1.00 (0.84–1.17) | 1.01 (0.86–1.18) | 0.98 (0.83–1.17) | < 0.001 |
| Apolipoprotein B/Apolipoprotein A-1 | 0.61 (0.49–0.75) | 0.59 (0.49–0.73) | 0.62 (0.50–0.76) | < 0.001 |
| Non-high-density lipoprotein cholesterol/High-density lipoprotein cholesterol |
3.04 (2.32–3.99) | 2.96 (2.27–3.88) | 3.11 (2.35–4.08) | < 0.001 |
| High-sensitivity C-reactive protein, mg/L | 1.61 (0.80–3.70) | 1.35 (0.70–2.71) | 1.88 (0.89–4.71) | < 0.001 |
| Left main or three-vessel disease | 398 (4.33%) | 170 (4.58%) | 228 (4.16%) | 0.325 |
| Pre-procedural SYNTAX score | 10 (6–17) | 10 (6–17) | 10 (6–16) | 0.041 |
| Medication | ||||
| Aspirin | 9094 (98.94%) | 3669 (98.95%) | 5425 (98.94%) | 0.978 |
| Clopidogrel | 9175 (99.83%) | 3701 (99.81%) | 5474 (99.84%) | 0.781 |
| Beta-blockers | 8308 (90.39%) | 3415 (92.10%) | 4893 (89.24%) | < 0.001 |
| Angiotensin-converting enzyme inhibitors/Angiotensin receptor blockers |
4830 (52.55%) | 1841 (49.65%) | 2989 (54.51%) | < 0.001 |
| Data are presented as medians (interquartile range) or n (%). | ||||
 DownLoad:
CSV
DownLoad:
CSV
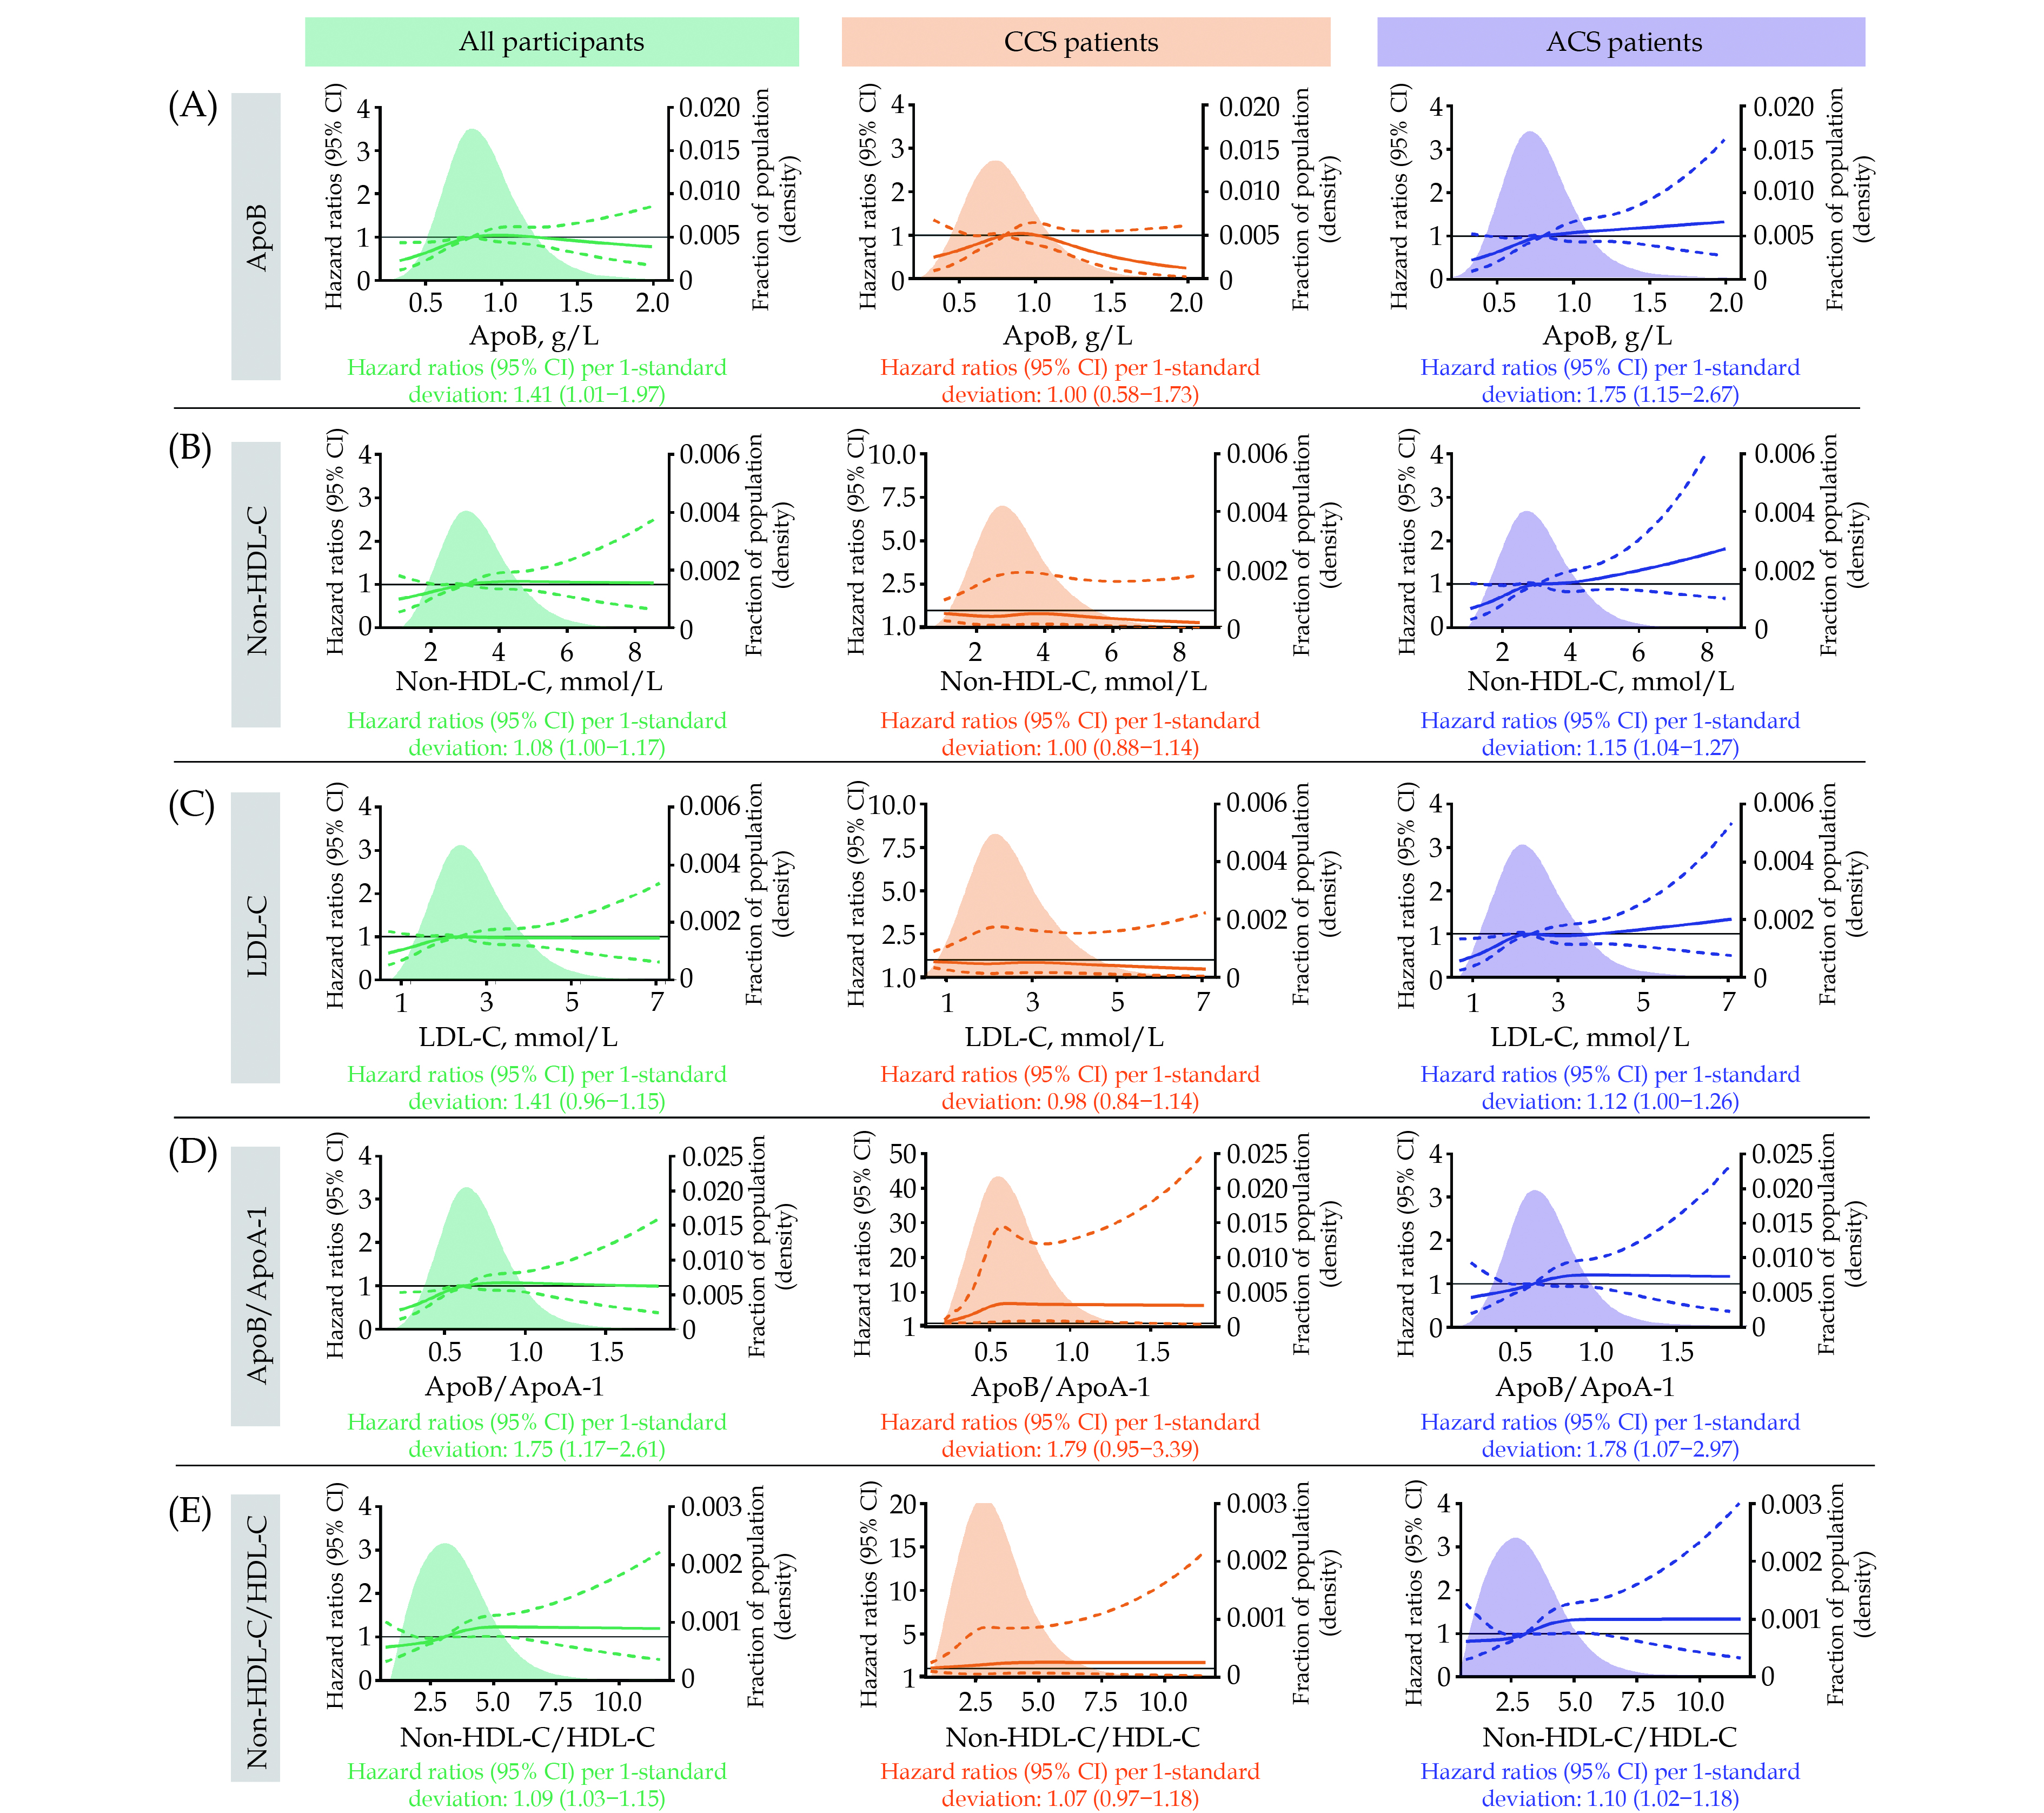
Figure 2 (green panels) illustrates that except for the LDL-C, elevations in the other four measures were associated with an increased risk of MI in all statin-treated CAD patients. 1-standard deviation increase in apoB/apoA-1 yielded the highest adjusted HR of 1.75 (95% CI: 1.17–2.61), followed by apoB with an adjusted HR of 1.41 (95% CI: 1.01–1.97).
All measures were associated with an increased risk of MI in ACS patients. 1-standard deviation increase in apoB/apoA-1 presented the highest adjusted HR of 1.78 (95% CI: 1.07–2.97), followed by apoB with an adjusted HR of 1.75 (95% CI: 1.15–2.67) (Figure 2, purple panels). No lipid or apolipoprotein measures were associated with the risk of MI in CCS patients (Figure 2, orange panels). Crude HR for MI by levels of the measures are expressed in supplemental material, Table 7S.
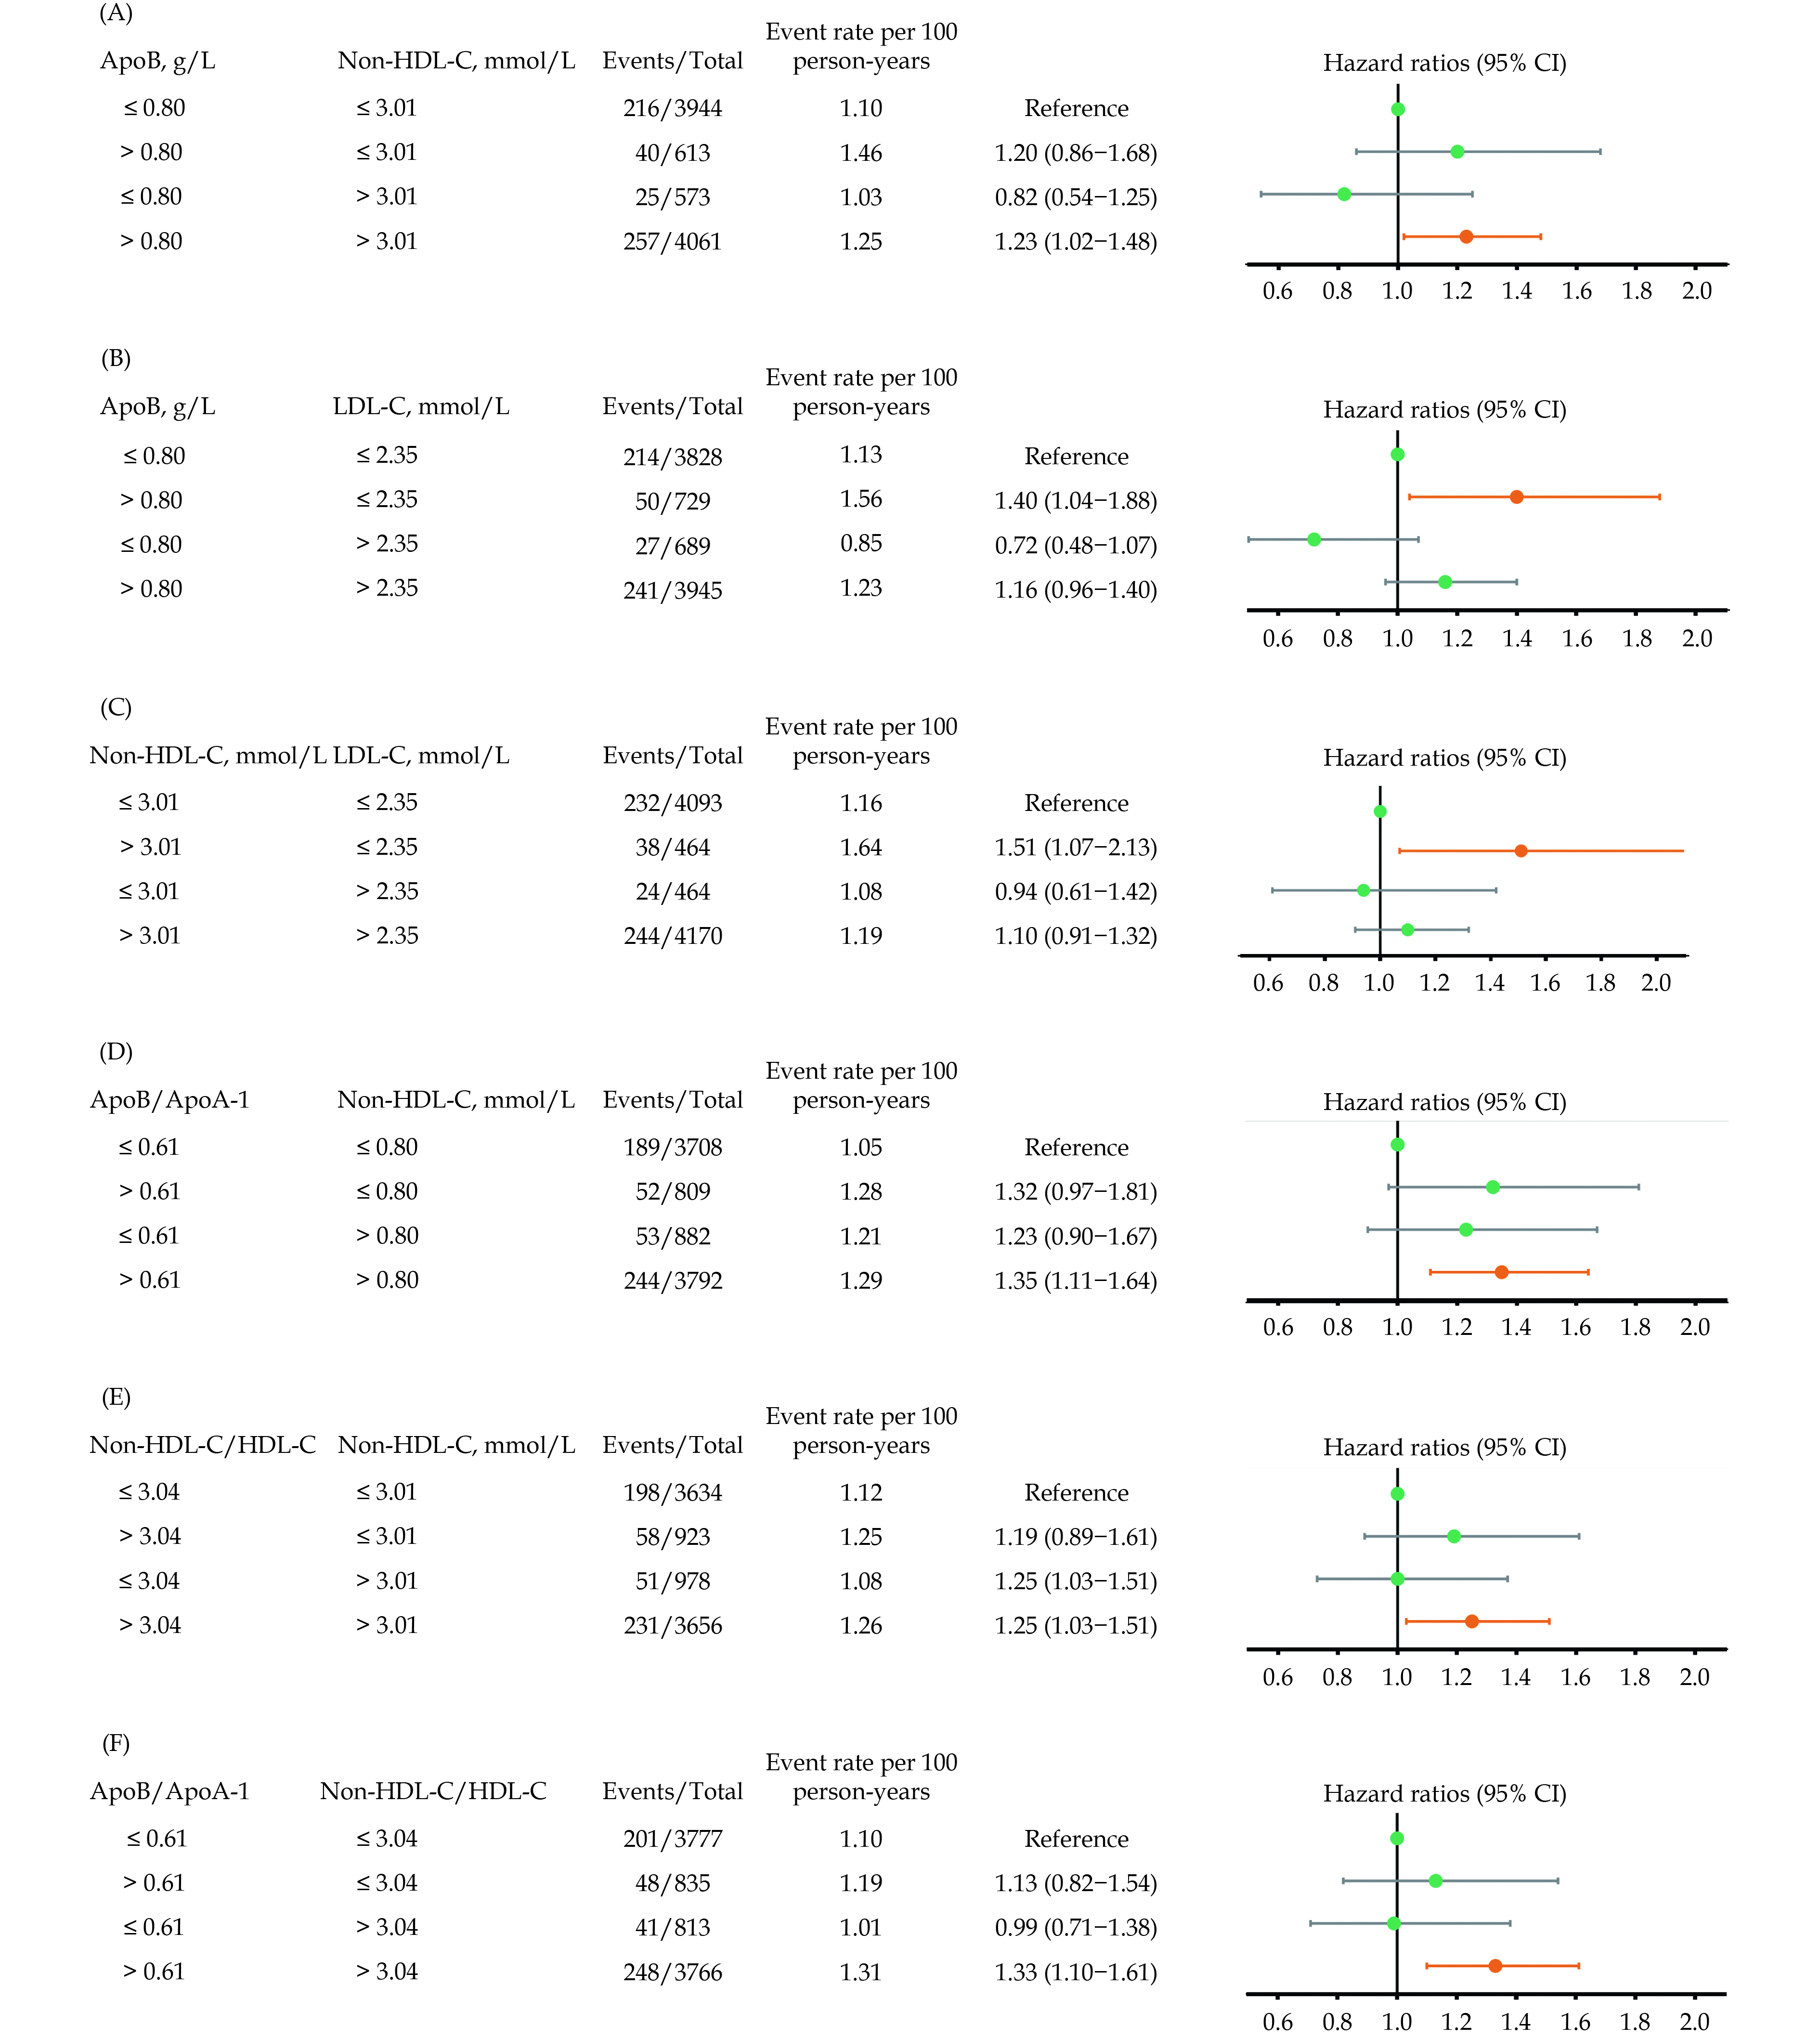
For all statin-treated CAD patients, the high-apoB-low-LDL-C category yielded an adjusted HR of 1.40 (95% CI: 1.04–1.88) compared with the low-apoB-low-LDL-C category. Similarly, the high-non-HDL-C-low-LDL-C category presented an adjusted HR of 1.51 (95% CI: 1.07–2.13) compared with the low-non-HDL-C-low-LDL-C category. In contrast, discordant high LDL-C with low apoB or non-HDL-C was not associated with the risk of MI. For the concordance/discordance groups of apoB versus non-HDL-C, apoB/apoA-1 versus apoB, non-HDL-C/HDL-C versus non-HDL-C, or apoB/apoA-1 versus non-HDL-C/HDL-C, the risk of MI was only significantly increased when both measures were above the medians (Figure 3).
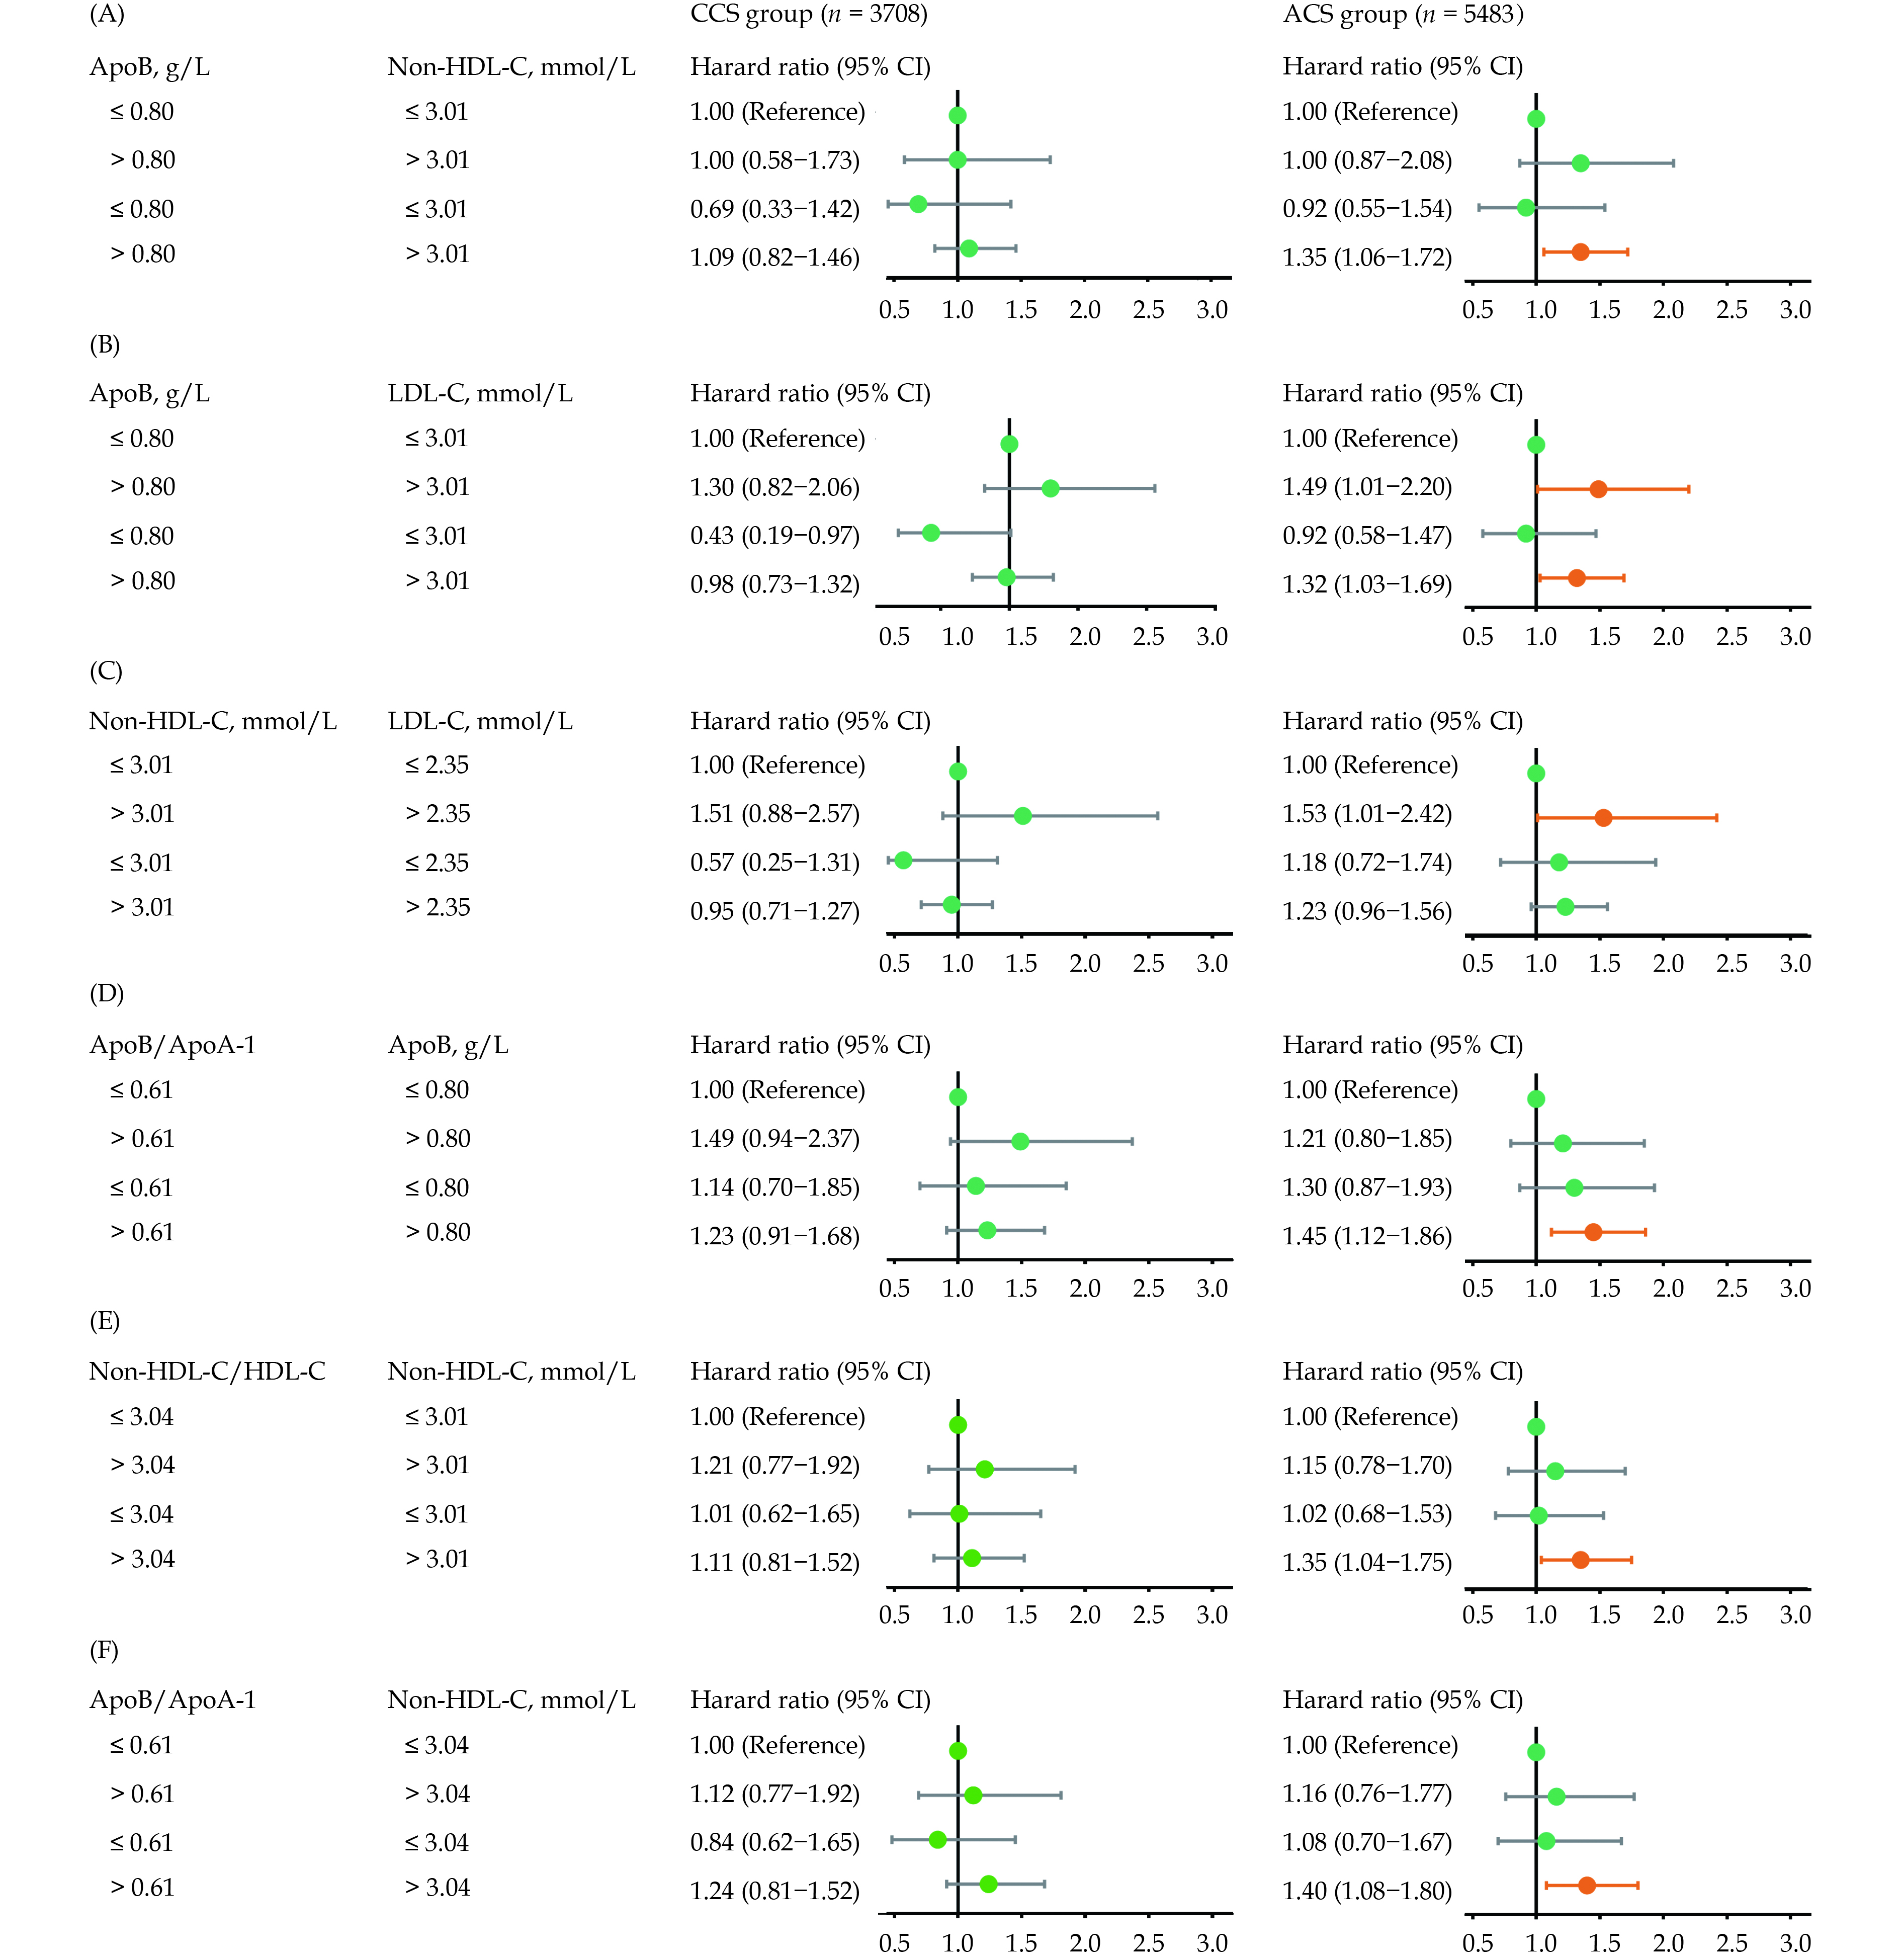
Similar patterns were observed in the ACS group. Discordant low LDL-C with high apoB and high non-HDL-C yielded adjusted HR of 1.49 (95% CI: 1.01–2.20) and 1.53 (95% CI: 1.00–2.42) compared with the concordant values below medians, whereas discordant high LDL-C with low apoB or low non-HDL-C was not associated with the risk of MI. No clear trend was observed in the concordance/discordance groups of other pairs of measures (Figure 4, right panels). For patients in the CCS group, no association was observed between any concordance/discordance category and the risk of MI (Figure 4, left panels). Crude HR and event-free survival curves by concordance/discordance groups between each pair of measures in all statin-treated CAD patients, patients with CCS, and those with ACS are expressed in supplemental material, Table 8S & Table 9S and supplemental material, Figure 1S–Figure 3S.
Supplemental material, Table 10S illustrates that higher apoB/apoA-1 and non-HDL-C/HDL-C remained associated with an increased risk of MI in statin-treated CAD patients without DM and those without obesity. Discordance analysis in patients stratified by DM and obesity showed similar point estimates of HR to those in all statin-treated CAD patients, but the corresponding 95% CI was wider and crossed the null (supplemental material, Table 11S & Table 12S; supplemental material, Figure 4S & Figure 5S).
The present study compared different apolipoprotein and lipid measures in assessing the residual risk of MI in statin-treated CAD patients from the perspective of secondary prevention. The study findings demonstrate that elevated levels of apoB and non-HDL-C but not LDL-C were associated with a higher risk of MI; apoB/apoA-1 and non-HDL-C/HDL-C show no superiority to apoB and non-HDL-C for predicting MI. These findings add a new insight into risk assessment and treatment goals for secondary prevention of CAD.
Non-HDL-C and apoB were found to be superior to LDL-C in identifying statin-treated CAD patients at residual risk of MI. An intuitive explanation is that apoB and non-HDL-C represent the total atherogenic burden. Despite statins being effective in controlling LDL-C levels, high levels of other atherogenic particles may still be responsible for the risk of MI. A recent study indicated that very LDL-C accounts for half of the risk of MI from elevated apoB-containing particles.[7] Furthermore, a meta-analysis has demonstrated that on-statin lipoprotein (a) levels still confer an increased risk for cardiovascular events.[8]
Although conventional comparisons have yielded controversial results,[9–11] all discordance analyses conducted in healthy populations and patients with statins as primary prevention of CAD agree that apoB and non-HDL-C are superior predictors of cardiovascular events to LDL-C.[3–5] The study results support these findings and extend them to the secondary prevention of CAD. Moreover, despite the lower median values of apoB and non-HDL-C in the study population compared to other studies,[3–5] levels of apoB and non-HDL-C above the medians were still significantly associated with a higher risk of MI when the LDL-C level was relatively low. This suggests that statin-treated CAD patients may still benefit from further reductions in apoB or non-HDL-C levels. LDL-C remains the primary indicator for risk assessment and lipid management in current clinical practice. However, it is necessary to introduce apoB or non-HDL-C to assess the risk of residual cardiovascular events in statin-treated CAD patients.
Consistent with a previous study, the results of discordance analysis in this study showed no significant difference between apoB and non-HDL-C in identifying residual risk of MI.[5] A discordant low apoB with high non-HDL-C indicates fewer atherogenic particles with more cholesterol, which represents more significant cholesterol-enriched particles. Conversely, a discordant high apoB with low non-HDL-C indicates more atherogenic particles with less cholesterol, which represents more cholesterol-depleted particles. Smaller particles are more easily trapped within the arterial wall, while larger particles can deposit more cholesterol, making all apoB-containing particles equally atherogenic.[12]
Our previous study has shown that apoB/apoA-1 is a better predictor of total occlusion than other lipid and apolipoprotein measures.[13] However, this study observed no superiority of apoB/apoA-1 in predicting MI. One possible reason is that although apoA-1 and HDL-C have been shown to reverse atherosclerosis, there is currently no randomized trial or genetic evidence to suggest that increasing plasma HDL-C or infusing apoA-1 can reduce the risk of cardiovascular events.[14,15] Although some studies have reported the superiority of apoB/apoA-1 to lipid ratios[16] and single apolipoprotein measures in predicting clinical outcomes,[17] it is premature to use apoB/apoA-1 and non-HDL-C/HDL-C in place of apoB and non-HDL-C in current clinical practice, given the lack of evidence on cardiovascular benefits of increasing the levels of apoA-1 and HDL-C, and the fact that ratios are not as intuitively interpretable and easily available as single measures.
An unexpected finding of this study was that lipid measures could predict MI in ACS patients but not CCS patients. One possible explanation for this discrepancy is the limited statistical power of the analyses for CCS patients, with only 216 MIs and even fewer events in concordance/discordance groups. Another contributing factor could be the potentially poorer adherence to statin therapy in CCS patients due to their lower level of concern about the disease compared to ACS patients. Consequently, the less controlled LDL-C levels in CCS patients could have weakened the observed difference between the associations of LDL-C and other measures with MI. However, since we did not collect information on statin type, dose, and adherence, we were unable to adjust for this potential confounder.
Furthermore, another possible mechanism is the pathophysiological differences between the two patient populations. Firstly, lipids can be regarded as acute-phase reactants, and the modification of lipid profiles after ACS may have partially contributed to the different results between the two populations.[18,19] Secondly, the ACS group had a significantly higher level of high-sensitivity C-reactive protein than the CCS group, indicating that ACS patients had a heightened inflammatory state. Inflammation is known to be an aggravator of atherogenesis,[20,21] and enhanced inflammation may promote the atherogenic function of apoB-containing particles. Additionally, ACS patients have a higher oxidative stress status and a more deteriorated antioxidant status than CCS patients.[22] Few studies comparing lipid measures have distinguished between ACS and CCS patients, and the findings of this study may raise important questions that require further investigation.
The limitations of this study should be noted. Firstly, the observational design, single-center, and single race population may limit the generalizability of the findings. Secondly, this study only used single measurements of apolipoprotein and lipid measures. Thirdly, the study did not have information on the type, dose, treatment duration, and adherence of statins during follow-up. Fourthly, the most conservative method to discordance analysis was adopted, where apolipoprotein and lipid measures were classified based on their respective medians. Last but not least, it is concerning that apolipoprotein and lipid measures in CCS patients lacked predictive power for future MI. It is uncertain whether this was due to low statistical power or specific underlying mechanisms. Further studies are needed to investigate whether the ability of atherogenic particles to promote cardiovascular events differs between ACS and CCS patients. Moreover, future research should explore the optimal cut-off values of apoB and non-HDL-C in statin-treated CAD patients, and future translational research and clinical evidence are required to determine whether reducing apoB and non-HDL-C levels can effectively reduce the occurrence of cardiovascular events.
ApoB predicts MI in statin-treated CAD patients better than non-HDL-C and LDL-C, especially in ACS patients. Apolipoprotein and lipid ratios showed no superiority to single apolipoprotein and lipid measures in predicting MI.
This study was supported by the China National Key R&D Program during the 13th Five-year Plan Period, China (2016YFC1301301), the CAMS Innovation Fund for Medical Sciences, China (2020-I2 M-C&T-B-049), and the National Clinical Research Center for Cardiovascular Diseases, Fuwai Hospital, Chinese Academy of Medical Sciences and Peking Union Medical College, Beijing, China (NCRC2020013). All authors had no conflicts of interest to disclose. The authors would like to thank all participants and their families and all staff members for data collection, management, and monitoring of this study.
| [1] |
Mora S, Wenger NK, Demicco DA, et al. Determinants of residual risk in secondary prevention patients treated with high- versus low-dose statin therapy: the Treating to New Targets (TNT) study. Circulation 2012; 125: 1979−1987. doi: 10.1161/CIRCULATIONAHA.111.088591
|
| [2] |
Sniderman AD, Lamarche B, Contois JH, et al. Discordance analysis and the Gordian knot of LDL and non-HDL cholesterol versus apoB. Curr Opin Lipidol 2014; 25: 461−467. doi: 10.1097/MOL.0000000000000127
|
| [3] |
Pencina MJ, D’Agostino RB, Zdrojewski T, et al. Apolipoprotein B improves risk assessment of future coronary heart disease in the Framingham Heart Study beyond LDL-C and non-HDL-C. Eur J Prev Cardiol 2015; 22: 1321−1327. doi: 10.1177/2047487315569411
|
| [4] |
Wilkins JT, Li RC, Sniderman A, et al. Discordance between apolipoprotein B and LDL-cholesterol in young adults predicts coronary artery calcification: the CARDIA study. J Am Coll Cardiol 2016; 67: 193−201. doi: 10.1016/j.jacc.2015.10.055
|
| [5] |
Johannesen CDL, Mortensen MB, Langsted A, et al. Apolipoprotein B and non-HDL cholesterol better reflect residual risk than LDL cholesterol in statin-treated patients. J Am Coll Cardiol 2021; 77: 1439−1450. doi: 10.1016/j.jacc.2021.01.027
|
| [6] |
Liu Y, Jia SD, Yuan DS, et al. Apolipoprotein B/A-I ratio predicts lesion severity and clinical outcomes in diabetic patients with acute coronary syndrome. Circ J 2020; 84: 1132−1139. doi: 10.1253/circj.CJ-19-1097
|
| [7] |
Balling M, Afzal S, Varbo A, et al. VLDL cholesterol accounts for one-half of the risk of myocardial infarction associated with apoB-containing lipoproteins. J Am Coll Card iol 2020; 76: 2725−2735. doi: 10.1016/j.jacc.2020.09.610
|
| [8] |
Willeit P, Ridker PM, Nestel PJ, et al. Baseline and on-statin treatment lipoprotein(a) levels for prediction of cardiovascular events: individual patient-data meta-analysis of statin outcome trials. Lancet 2018; 392: 1311−1320. doi: 10.1016/S0140-6736(18)31652-0
|
| [9] |
Boekholdt SM, Arsenault BJ, Mora S, et al. Association of LDL cholesterol, non-HDL cholesterol, and apolipoprotein B levels with risk of cardiovascular events among patients treated with statins: a meta-analysis. JAMA 2012; 307: 1302−1309. doi: 10.1001/jama.2012.366
|
| [10] |
Thanassoulis G, Williams K, Ye K, et al. Relations of change in plasma levels of LDL-C, non-HDL-C and apoB with risk reduction from statin therapy: a meta-analysis of randomized trials. J Am Heart Assoc 2014; 3: e000759. doi: 10.1161/JAHA.113.000759
|
| [11] |
Marston NA, Giugliano RP, Melloni GEM, et al. Association of apolipoprotein B-containing lipoproteins and risk of myocardial infarction in individuals with and without atherosclerosis: distinguishing between particle concentration, type, and content. JAMA Cardiol 2022; 7: 250−256. doi: 10.1001/jamacardio.2021.5083
|
| [12] |
Sniderman AD, Thanassoulis G, Glavinovic T, et al. Apolipoprotein B particles and cardiovascular disease: a narrative review. JAMA Cardiol 2019; 4: 1287−1295. doi: 10.1001/jamacardio.2019.3780
|
| [13] |
Li T, Yuan D, Wang P, et al. Associations of lipid measures with total occlusion in patients with established coronary artery disease: a cross-sectional study. Lipids Health Dis 2022; 21: 118. doi: 10.1186/s12944-022-01733-8
|
| [14] |
Michael Gibson C, Korjian S, Tricoci P, et al. Safety and tolerability of CSL112, a reconstituted, infusible, plasma-derived apolipoprotein A-I, after acute myocardial infarction: the AEGIS-I Trial (ApoA-I Event Reducing in Ischemic Syndromes I). Circulation 2016; 134: 1918−1930. doi: 10.1161/CIRCULATIONAHA.116.025687
|
| [15] |
Mach F, Baigent C, Catapano AL, et al. 2019 ESC/EAS guidelines for the management of dyslipidaemias: lipid modification to reduce cardiovascular risk. Eur Heart J 2020; 41: 111−188. doi: 10.1093/eurheartj/ehz455
|
| [16] |
McQueen MJ, Hawken S, Wang X, et al. Lipids, lipoproteins, and apolipoproteins as risk markers of myocardial infarction in 52 countries (the INTERHEART study): a case-control study. Lancet 2008; 372: 224−233. doi: 10.1016/S0140-6736(08)61076-4
|
| [17] |
Walldius G, de Faire U, Alfredsson L, et al. Long-term risk of a major cardiovascular event by apoB, apoA-1, and the apoB/apoA-1 ratio-experience from the Swedish AMORIS cohort: a cohort study. PLoS Med 2021; 18: e1003853. doi: 10.1371/journal.pmed.1003853
|
| [18] |
Pfohl M, Schreiber I, Liebich HM, et al. Upregulation of cholesterol synthesis after acute myocardial infarction-is cholesterol a positive acute phase reactant?. Atherosclerosis 1999; 142: 389−393. doi: 10.1016/s0021-9150(98)00242-1
|
| [19] |
Balci B. The modification of serum lipids after acute coronary syndrome and importance in clinical practice. Curr Ca rdiol Rev 2011; 7: 272−276. doi: 10.2174/157340311799960690
|
| [20] |
Ridker PM, Cannon CP, Morrow D, et al. C-reactive protein levels and outcomes after statin therapy. N Engl J Med 2005; 352: 20−28. doi: 10.1056/NEJMoa042378
|
| [21] |
Ridker PM, Everett BM, Thuren T, et al. Antiinflammatory therapy with canakinumab for atherosclerotic disease. N Engl J Med 2017; 377: 1119−1131. doi: 10.1056/NEJMoa1707914
|
| [22] |
Lubrano V, Pingitore A, Traghella I, et al. Emerging biomarkers of oxidative stress in acute and stable coronary artery disease: levels and determinants. Antioxidants (Basel) 2019; 8: 115. doi: 10.3390/antiox8050115
|
Figures(4) / Tables(1)
Supported by: Beijing Renhe Information Technology Co., Ltd. 
| Characteristics | All participants (n = 9191) |
Chronic coronary syndrome group (n = 3708) |
Acute coronary syndrome group (n = 5483) |
P-value |
| Women | 2083 (22.66%) | 821 (22.14%) | 1262 (23.02%) | 0.325 |
| Age, yrs | 59 (51–65) | 59 (51–65) | 59 (51–66) | 0.944 |
| ≥ 65 yrs | 2545 (27.69%) | 1010 (27.24%) | 1535 (28.00%) | 0.426 |
| Body mass index, kg/m2 | 25.91 (23.88–27.77) | 25.95 (24.03–27.77) | 25.85 (23.81–27.76) | 0.040 |
| ≥ 30 kg/m2 | 921 (10.02%) | 400 (10.79%) | 521 (9.50%) | 0.044 |
| Current smoking | 5247 (57.09%) | 2050 (55.29%) | 3197 (58.31%) | 0.004 |
| Diabetes mellitus | 3684 (40.08%) | 1583 (42.69%) | 2101 (38.32%) | < 0.001 |
| Oral antidiabetic agents | 1562 (42.40%) | 688 (43.46%) | 874 (41.60%) | 0.257 |
| Insulin | 980 (26.60%) | 424 (26.78%) | 556 (26.46%) | 0.827 |
| Hypertension | 6395 (69.58%) | 2654 (71.57%) | 3741 (68.23%) | < 0.001 |
| Peripheral artery disease | 249 (2.71%) | 128 (3.45%) | 121 (2.21%) | < 0.001 |
| Previous myocardial infarction | 1782 (19.39%) | 1045 (28.18%) | 737 (13.44%) | < 0.001 |
| Previous revascularization | 2384 (25.94%) | 1133 (30.56%) | 1251 (22.82%) | < 0.001 |
| Estimated glomerular filtration rate, mL/min per 1.73 m2 | 118.08 (102.60–133.27) | 118.75 (103.63–134.34) | 117.67 (101.85–132.58) | 0.003 |
| Left ventricular ejection fraction, % | 64 (60–67) | 64 (60–68) | 63 (60–67) | < 0.001 |
| Triglycerides, mmol/L | 1.53 (1.14–2.10) | 1.51 (1.13–2.07) | 1.55 (1.15–2.11) | 0.026 |
| Apolipoprotein B, g/L | 0.80 (0.67–0.98) | 0.79 (0.66–0.97) | 0.81 (0.67–0.98) | 0.007 |
| Apolipoprotein A-1, g/L | 1.31 (1.18–1.48) | 1.33 (1.20–1.49) | 1.30 (1.17–1.47) | < 0.001 |
| Lipoprotein (a), mg/dL | 18.53 (7.87–41.28) | 18.17 (7.62–41.23) | 18.64 (79.81–41.29) | 0.616 |
| Non-high-density lipoprotein cholesterol, mmol/L | 3.01 (2.43–3.76) | 2.96 (2.39–3.73) | 3.05 (2.46–3.79) | < 0.001 |
| Low-density lipoprotein cholesterol, mmol/L | 2.35 (1.86–3.02) | 2.31 (1.83–2.99) | 2.39 (1.88–3.04) | < 0.006 |
| High-density lipoprotein cholesterol, mmol/L | 1.00 (0.84–1.17) | 1.01 (0.86–1.18) | 0.98 (0.83–1.17) | < 0.001 |
| Apolipoprotein B/Apolipoprotein A-1 | 0.61 (0.49–0.75) | 0.59 (0.49–0.73) | 0.62 (0.50–0.76) | < 0.001 |
| Non-high-density lipoprotein cholesterol/High-density lipoprotein cholesterol |
3.04 (2.32–3.99) | 2.96 (2.27–3.88) | 3.11 (2.35–4.08) | < 0.001 |
| High-sensitivity C-reactive protein, mg/L | 1.61 (0.80–3.70) | 1.35 (0.70–2.71) | 1.88 (0.89–4.71) | < 0.001 |
| Left main or three-vessel disease | 398 (4.33%) | 170 (4.58%) | 228 (4.16%) | 0.325 |
| Pre-procedural SYNTAX score | 10 (6–17) | 10 (6–17) | 10 (6–16) | 0.041 |
| Medication | ||||
| Aspirin | 9094 (98.94%) | 3669 (98.95%) | 5425 (98.94%) | 0.978 |
| Clopidogrel | 9175 (99.83%) | 3701 (99.81%) | 5474 (99.84%) | 0.781 |
| Beta-blockers | 8308 (90.39%) | 3415 (92.10%) | 4893 (89.24%) | < 0.001 |
| Angiotensin-converting enzyme inhibitors/Angiotensin receptor blockers |
4830 (52.55%) | 1841 (49.65%) | 2989 (54.51%) | < 0.001 |
| Data are presented as medians (interquartile range) or n (%). | ||||
DownLoad:
CSV