Please cite this article as: FU R, ZHAO YY, CUI KY, YANG JG, XU HY, YIN D, SONG WH, WANG HJ, ZHU CG, FENG L, WANG ZF, WANG QS, LU Y, DOU KF, YANG YJ. Triglyceride glucose index predicts in-hospital mortality in patients with ST-segment elevation myocardial infarction who underwent primary angiography. J Geriatr Cardiol 2023; 20(3): 185−194. DOI: 10.26599/1671-5411.2023.03.001.
Citation:
Please cite this article as: FU R, ZHAO YY, CUI KY, YANG JG, XU HY, YIN D, SONG WH, WANG HJ, ZHU CG, FENG L, WANG ZF, WANG QS, LU Y, DOU KF, YANG YJ. Triglyceride glucose index predicts in-hospital mortality in patients with ST-segment elevation myocardial infarction who underwent primary angiography. J Geriatr Cardiol 2023; 20(3): 185−194. DOI: 10.26599/1671-5411.2023.03.001.
Please cite this article as: FU R, ZHAO YY, CUI KY, YANG JG, XU HY, YIN D, SONG WH, WANG HJ, ZHU CG, FENG L, WANG ZF, WANG QS, LU Y, DOU KF, YANG YJ. Triglyceride glucose index predicts in-hospital mortality in patients with ST-segment elevation myocardial infarction who underwent primary angiography. J Geriatr Cardiol 2023; 20(3): 185−194. DOI: 10.26599/1671-5411.2023.03.001.
Citation:
Please cite this article as: FU R, ZHAO YY, CUI KY, YANG JG, XU HY, YIN D, SONG WH, WANG HJ, ZHU CG, FENG L, WANG ZF, WANG QS, LU Y, DOU KF, YANG YJ. Triglyceride glucose index predicts in-hospital mortality in patients with ST-segment elevation myocardial infarction who underwent primary angiography. J Geriatr Cardiol 2023; 20(3): 185−194. DOI: 10.26599/1671-5411.2023.03.001.
Triglyceride glucose index predicts in-hospital mortality in patients with ST-segment elevation myocardial infarction who underwent primary angiography
Cardiometabolic Medicine Center, Department of Cardiology, Fuwai Hospital, National Center for Cardiovascular Diseases, State Key Laboratory of Cardiovascular Disease, National Clinical Research Center for Cardiovascular Diseases, Chinese Academy of Medical Sciences and Peking Union Medical College, Beijing, China
2.
Medical Research & Biometrics Center, Fuwai Hospital, National Center for Cardiovascular Diseases, Chinese Academy of Medical Sciences and Peking Union Medical College, Beijing, China
3.
Coronary Heart Disease Center, Department of Cardiology, Fuwai Hospital, National Center for Cardiovascular Diseases, State Key Laboratory of Cardiovascular Disease, National Clinical Research Center for Cardiovascular Diseases, Chinese Academy of Medical Sciences and Peking Union Medical College, Beijing, China
4.
Department of Cardiology, Xinxiang Central Hospital, the Fourth Clinical College of Xinxiang Medical University, Henan Province, China
5.
Department of Cardiology, Qinhuangdao First Hospital, Hebei Province, China
OBJECTIVES To assess the correlation between triglyceride glucose (TyG) index and in-hospital mortality in patients with ST-segment elevation myocardial infarction (STEMI).
METHODS A total of 2190 patients with STEMI who underwent primary angiography within 12 h from symptom onset were selected from the prospective, nationwide, multicenter CAMI registry. TyG index was calculated with the formula: Ln [fasting triglycerides (mmol/L) × fasting glucose (mmol/L)/2]. Patients were divided into three groups according to the tertiles of TyG index. The primary endpoint was in-hospital mortality.
RESULTS Overall, 46 patients died during hospitalization, in-hospital mortality was 1.5%, 2.2%, 2.6% for tertile 1, tertile 2, and tertile 3, respectively. However, TyG index was not significantly correlated with in-hospital mortality in single-variable logistic regression analysis. Nonetheless, after adjusting for age and sex, TyG index was significantly associated with higher mortality when regarded as a continuous variable (adjusted OR = 1.75, 95% CI: 1.16-2.63) or categorical variable (tertile 3 vs. tertile 1: adjusted OR = 2.50, 95% CI: 1.14-5.49). Furthermore, TyG index, either as a continuous variable (adjusted OR = 2.54, 95% CI: 1.42-4.54) or categorical variable (tertile 3 vs. tertile 1: adjusted OR = 3.57, 95% CI: 1.24-10.29), was an independent predictor of in-hospital mortality after adjusting for multiple confounders in multivariable logistic regression analysis. In subgroup analysis, the prognostic effect of high TyG index was more significant in patients with body mass index < 18.5 kg/m2 (Pinteraction = 0.006).
CONCLUSIONS This study showed that TyG index was positively correlated with in-hospital mortality in STEMI patients who underwent primary angiography, especially in underweight patients.
Insulin resistance (IR) represents the dysfunction of insulin in stimulating glucose uptake and utilization, which is characterized by glucose and lipid metabolic disorders, systemic inflammation, and endothelial dysfunction.[1] It is generally believed that IR accelerates the development of microvascular and macrovascular diseases, leading to a worse prognosis in patients with established cardiovascular disease.[2,3] Triglyceride glucose (TyG) index, which is derived from fasting blood glucose (FBG) and triglyceride levels, is a reliable, affordable and easy-to-use indicator of IR. Previous studies showed that TyG index was significantly correlated with IR evaluated by the hyperinsulinaemic-euglycaemic clamp test. Moreover, it even showed superior performance than the homeostatic model assessment of IR (HOMA-IR).[4-6]
More and more evidence showed that TyG index was positively correlated with metabolic disorders,[7,8] subclinical atherosclerosis and cardiovascular disease.[9-12] In addition, studies of participants with non-ST-segment elevation acute coronary syndrome (NSTE-ACS) showed that a high TyG index was significantly correlated with a higher risk of adverse cardiovascular events.[13-15] However, the prognostic effect of TyG index has rarely been evaluated in the highest-risk subgroup of patients with ST-segment elevation myocardial infarction (STEMI).[16] Furthermore, the relationship between TyG index and the “hard” endpoint of death is inconclusive. Most studies showed that TyG index was not significantly correlated with mortality in patients with coronary artery disease (CAD),[17] while only a few studies reported that TyG index was positively correlated with mortality.[16,18] Therefore, we used data from China Acute Myocardial Infarction (CAMI) registry to evaluate the association between TyG index and in-hospital mortality for patients with STEMI who underwent primary angiography within 12 h from symptom onset.
METHODS
Study Design and Population
The CAMI registry was an integrated research and educational platform including patients with acute myocardial infarction (AMI) in 108 hospitals at three administrative levels (province-, prefecture- or county-level) in China. The details of the study design have been reported previously,[19] and the registry was registered on www.Clinicaltrials.gov (NCT01874691). Overall, this prospective, nationwide, and multicenter CAMI registry consecutively enrolled AMI patients who were admitted ≤ 3 days of symptom onset from September 30, 2014 to January 31, 2016 in the participating hospitals, with both patients with STEMI and non-ST-elevation myocardial infarction included. It is worth to note that patients with types 1, 2, 3, 4b and 4c myocardial infarction (MI) were eligible for the registry. They were classified according to the third Universal Definition for MI.[20] The members of committees and the full list of investigators are shown in Supplementary Tables 1 and 2, respectively. The registry was performed according to the principles of the Declaration of Helsinki and was approved by the institutional review board of each participating hospital. Written informed consent was obtained from all participants before registration.
Table
1.
Baseline characteristics of the study population according to tertiles of TyG index.
Variables
Tertile 1 (n = 730)
Tertile 2 (n = 728)
Tertile 3 (n = 732)
P value
Age, yrs
62.6 ± 12.2
59.5 ± 11.5
56. 8 ± 11. 7
< 0.0001
Male,
610 (83.6%)
595 (81.7%)
561 (76.6%)
0.003
Body mass index, kg/m2
24.3 ± 3.1
25.6 ± 3.1
25.8 ± 3.2
< 0.0001
Current smoking
410 (56.9%)
394 (54.1%)
399 (54.5%)
0.504
Diabetes mellitus
111 (15.2%)
218 (29.9%)
450 (61.5%)
< 0.0001
Hypertension
322 (44.1%)
386 (53.0%)
434 (59.3%)
< 0.0001
Hyperlipidemia
89 (12.2%)
115 (15.8%)
156 (21.3%)
< 0.0001
Family history of premature CAD
21 (2.9%)
22 (3.0%)
32 (4.4%)
0.223
Previous stroke
52 (7.1%)
37 (5.1%)
45 (6.1%)
0.001
Peripheral vascular disease
12 (1.6%)
8 (1.1%)
6 (0.8%)
0.335
Previous heart failure
5 (0.7%)
6 (0.8%)
2 (0.3%)
0.320
Chronic kidney disease in treatment
6 (0.8%)
8 (1.1%)
7 (1.0%)
0.863
COPD
13 (1.8%)
4 (0.5%)
6 (0.8%)
0.053
Heart rate, beats/min
77 ± 18
77 ± 16
81 ± 17
0.0001
Systolic blood pressure, mmHg
124 ± 23
126 ± 23
130 ± 24
< 0.0001
LVEF, %
55 (47-60)
54 (47-60)
55 (47-60)
0.377
LVEF < 50%
216 (29.6%)
226 (31.0%)
213 (29.1%)
0.700
Anterior myocardial infarction
447 (61.2%)
441 (60.6%)
416 (56.8%)
0.181
Killip class III/IV
18 (2.5%)
26 (3.6%)
33 (4.5%)
0.105
Primary PCI
664 (91.0%)
661 (90.8%)
661 (90.3%)
0.903
Laboratory data
Triglyceride, mmol/L
0.93 (0.73-1.14)
1.50 (1.20-1.81)
2.49 (1.84-3.38)
< 0.0001
LDL-C, mmol/L
2.52 (2.07-3.16)
2.84 (2.29-3.42)
3.00 (2.32-3.59)
< 0.0001
HDL-C, mmol/L
1.08 (0.90-1.27)
0.99 (0.86-1.16)
0.95 (0.81-1.13)
< 0.0001
Fasting glucose, mmol/L
5.78 (5.08-6.80)
6.76 (5.62-8.33)
9.28 (7.10-13.14)
0.0001
HbA1c, %
5.7 (5.4-6.0)
5.8 (5.4-6.5)
6.9 (5.8-8.8)
< 0.0001
Serum creatinine, μmol/L
73.4 (63.0-87.0)
74.0 (64.1-86.5)
75.4 (63.0-89.9)
0.403
Hemoglobin, g/L
137 (126-149)
141 (129-153)
142 (131-154)
< 0.0001
Medications at discharge
Aspirin
688 (94.2%)
674 (92.6%)
675 ( 92.2%)
0.267
Clopidogrel
674 (92.3%)
656 (90.1%)
665 (90.8%)
0.317
ACEI/ARB
416 (57.0%)
425 (58.4%)
456 (62.3%)
0.100
β-blockers
542 (74.2%)
547 (75.1%)
571 (78.0%)
0.212
Statins
681 (93.3%)
667 (91.6%)
674 (92.1%)
0.460
Data are presented as mean ± SD, n (%) or median (range). ACEI: angiotensin converting enzyme inhibitor; ARB: angiotensin receptor blocker; CAD: coronary artery disease; COPD: chronic obstructive pulmonary disease; HbA1c: hemoglobin A1c; HDL-C: high density lipoprotein cholesterol; LDL-C: low-density lipoprotein cholesterol; LVEF: left ventricular ejection fraction; PCI: percutaneous coronary intervention.
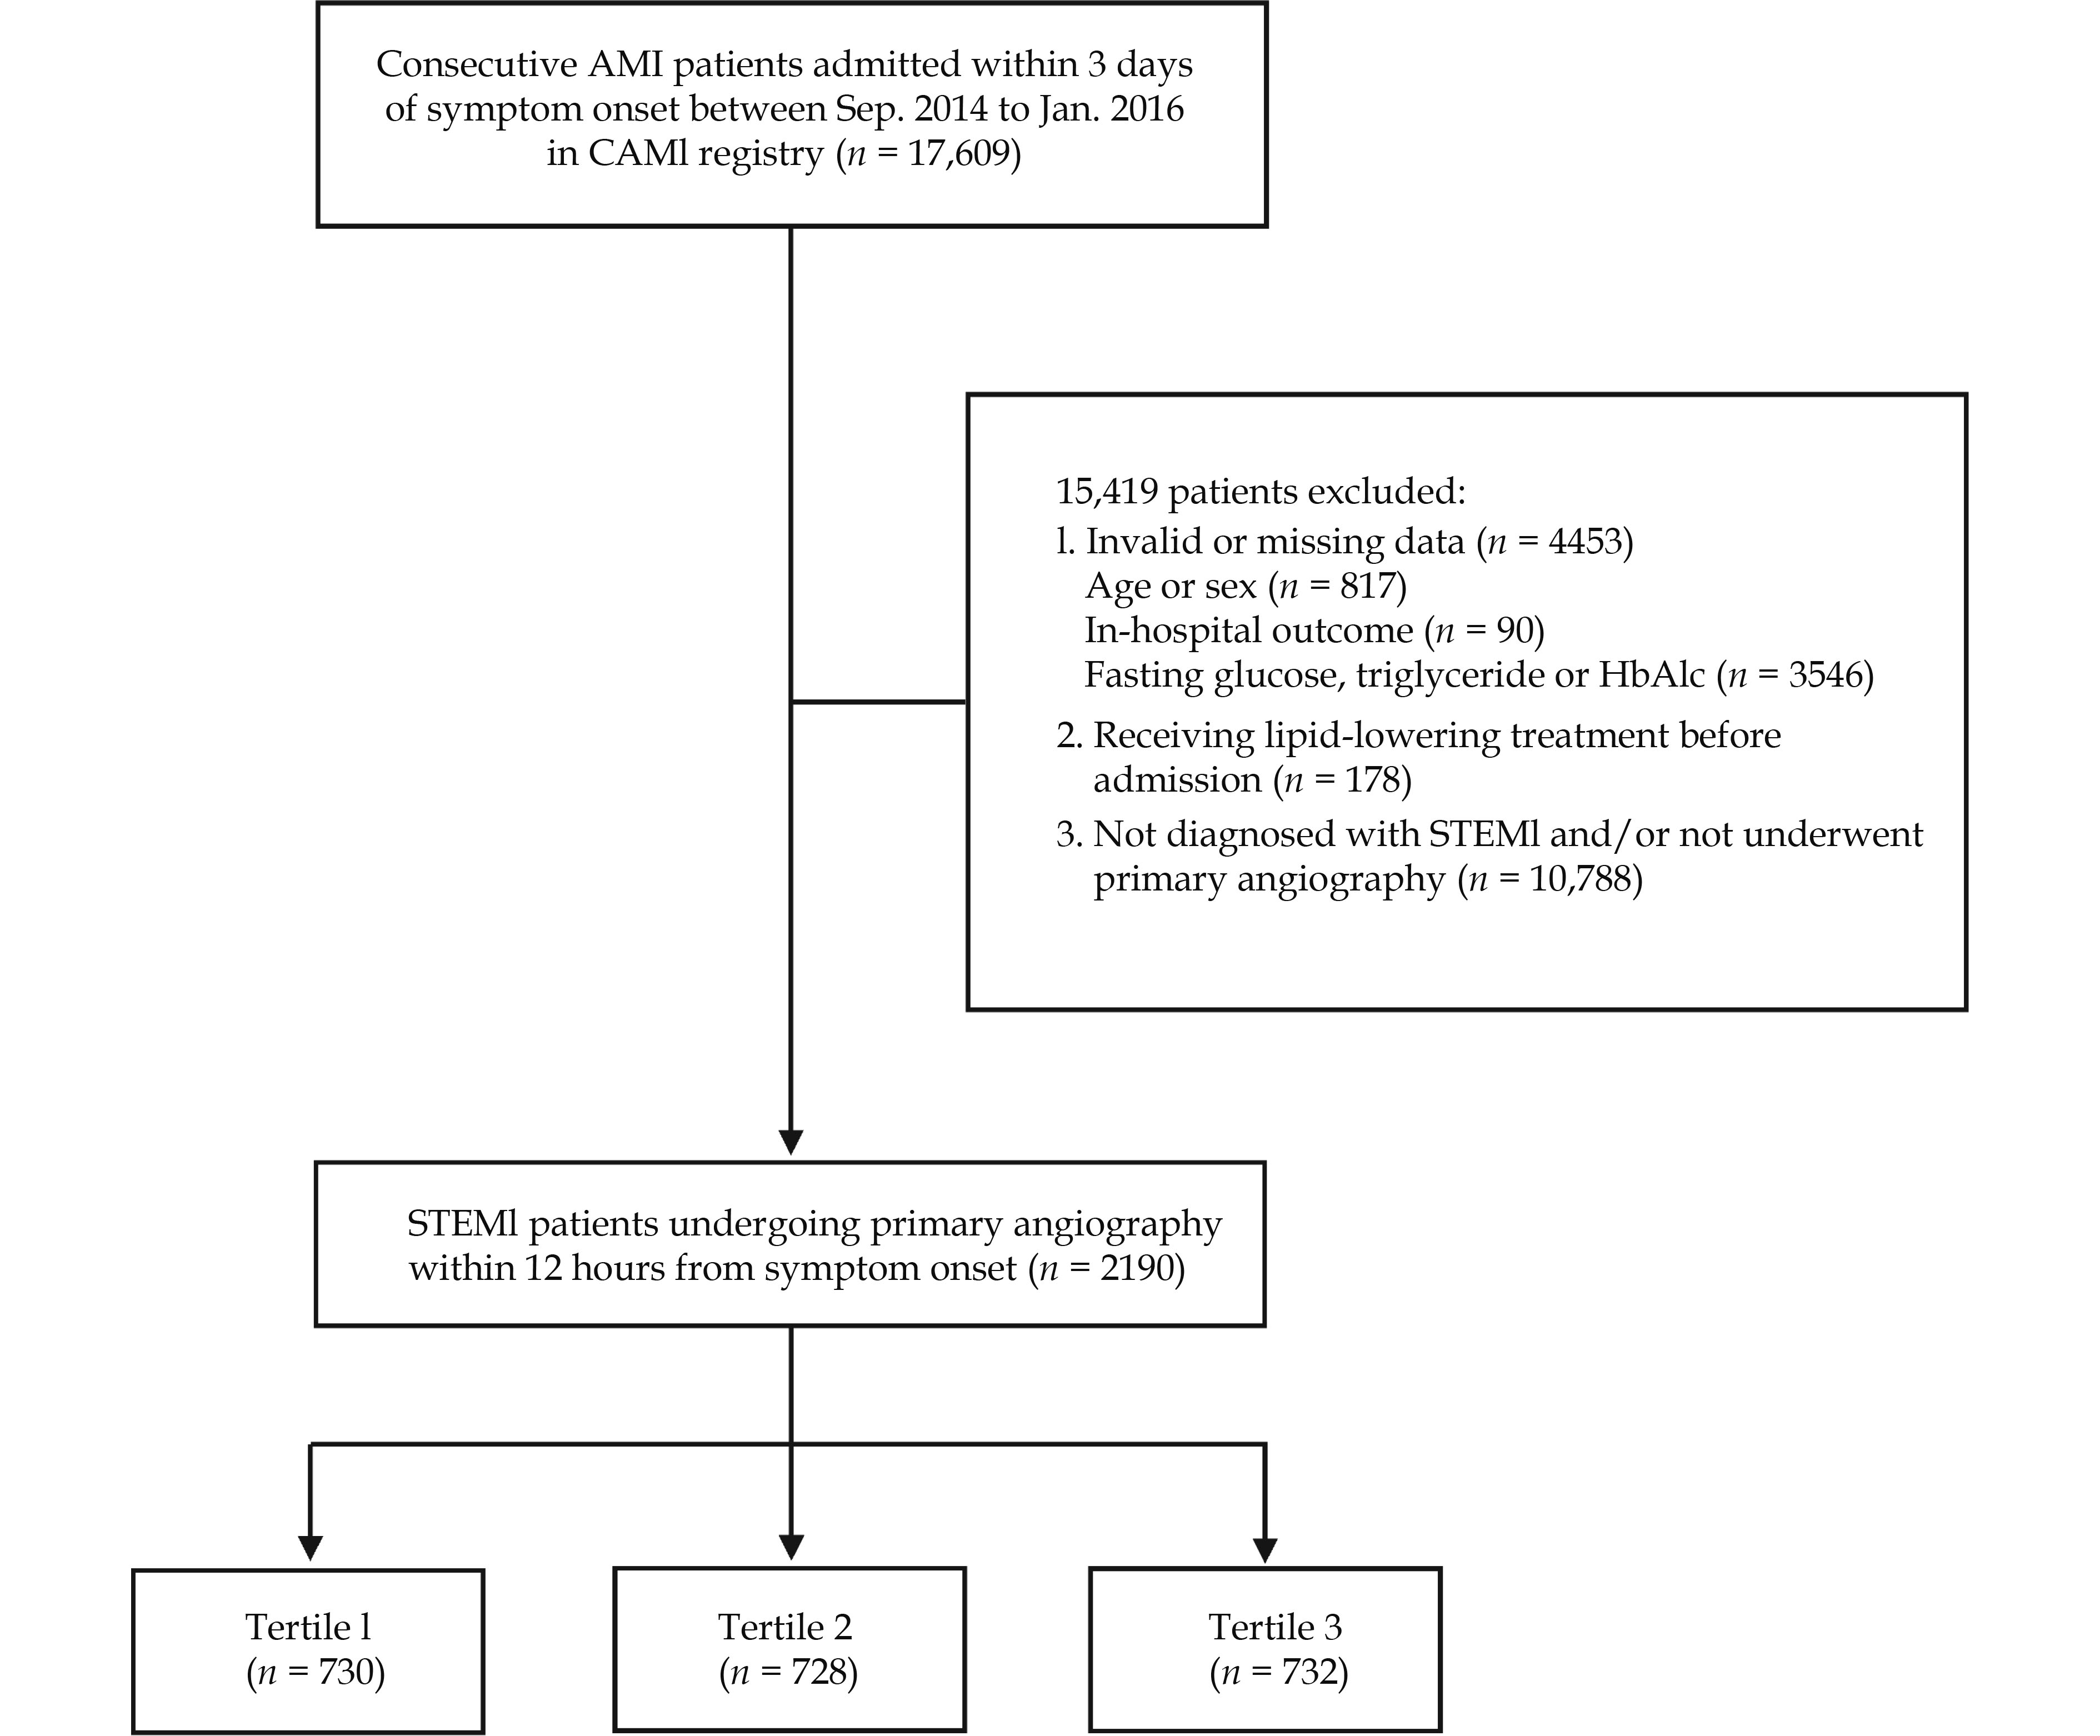
In this study, a total of 17,609 AMI patients were enrolled. For the present analysis, we selected patients with STEMI who underwent primary angiography within 12 h from symptom onset and did not receive lipid-lowering treatment before admission. In addition, patients with incomplete or invalid data on FBG, hemoglobin A1c (HbA1c) or triglyceride levels, age, sex, or in-hospital outcome were not included. Ultimately, 2190 patients who met the selection criteria were analyzed (Figure 1).
At each participating site, data were collected, validated, and submitted by trained investigators through a secure, web-based electronic data capture system. Demographics, cardiovascular risk factors, clinical parameters, laboratory and imaging data, reperfusion strategies, and use of medications were collected with standardized questionnaires. Patients who had previous medical history, received hypoglycemic therapy, or had HbA1c levels ≥ 6.5% were diabetics.[21] Hypertension was defined as systolic blood pressure ≥ 140 mmHg, diastolic blood pressure ≥ 90 mmHg, or use of antihypertensive treatment.[22] Hyperlipidemia was defined as an increase in plasma triglyceride (≥ 200 mg/dL), or total cholesterol (≥ 240 mg/dL).[23] Chronic kidney disease (CKD) was defined as decreased kidney function shown by the estimated glomerular filtration rate < 60 mL/min per 1.73 m2 (calculated using the Modification of Diet in Renal Disease study equation), or markers of kidney damage, or both, for ≥ 3 months, irrespective of cause.[24] Definitions of other variables were based on the ACC/AHA Task Force on Clinical Data Standards and the NCDR-ACTION-GWTG element dictionary.[19] Notably, TyG index was calculated using the following equation: Ln (fasting triglyceride (mmol/L) × FBG (mmol/L)/2).[4]
Endpoints
In this study, the primary endpoint was in-hospital death, which was defined as cardiac or non-cardiac death during hospitalization. Notably, all the events must be validated by source documents.
Statistical Analysis
All patients were divided into three groups according to the tertiles of TyG index. If the data was normal distribution, continuous variables were expressed as mean ± SD, and discrete variables were expressed as median (interquartile range). We used ANOVA to plot the differences of continuous variables among the three groups. The Kruskal-Wallis H test was applied for non-normally distributed continuous variables. Categorical variables were expressed as frequencies (percentages) and compared using Pearson’s Chi-square test or Fisher’s exact test, when appropriate. The correlation between TyG index and other continuous variables was calculated using Spearman rank correlation test. To evaluate the effect of TyG index level on in-hospital mortality, we performed single-variable and multivariable logistic regression analysis, and calculated odds ratios (ORs) and 95% confidence intervals (CIs). In multivariable analysis, we included clinically important factors and statistically significant variables in the single-variable analysis (P < 0.05). Three logistic regression models were fitted. Model 1: adjusted for age and sex. Model 2: adjusted for variables in model 1, anterior MI, Killip class III/IV, primary percutaneous coronary intervention (PCI), current smoking, previous stroke, chronic kidney disease, heart rate, systolic blood pressure, and left ventricular ejection fraction (LVEF). Model 3: adjusted for variables in model 2, serum creatinine, low-density lipoprotein cholesterol (LDL-C), and use of angiotensin converting enzyme inhibitor/angiotensin receptor blocker, β-blockers, and statins. In addition, we studied the effect of TyG index on in-hospital mortality through subgroup analysis based on important clinical variables, such as age, sex, BMI, glucose metabolism status, primary PCI, anterior MI, and Killip class. All statistical analyses were performed using SPSS version 23.0 (SPSS Inc., Chicago, IL, USA) and R version 3.6.0 (R Foundation for Statistical Computing, Vienna, Austria). A two-sided P value of < 0.05 was considered statistically significant.
RESULTS
Baseline Characteristics of the Study Population
Of the 2190 eligible patients, the mean age was 59.6 years, the mean BMI was 25.2 kg/m2, 80.6% were male, 54.9% were current smokers, 35.6% were diagnosed with diabetes mellitus (DM), 52.1% had hypertension, 16.4% had hyperlipidemia, 59.5% had anterior MI, 3.5% had Killip class III/IV, and 90.7% underwent primary PCI. Based on the tertiles of TyG index, patients were divided into three groups: TyG index < 1.36 (n = 730), TyG index 1.36-1.96 (n = 728), and TyG index ≥ 1.96 (n = 732).
Baseline characteristics of the participants according to TyG index levels are listed in Table 1. The percentage of male patients was decreased, whereas the proportion of patients with DM, hypertension, hyperlipidemia was increased with TyG index levels (P < 0.05). From tertile 1 to tertile 3, there was an ascending gradient regarding BMI, systolic blood pressure, and the concentrations of triglyceride, LDL-C, fasting glucose, HbA1c, and hemoglobin, whereas there was descending gradient with respect to age, and high-density lipoprotein cholesterol (HDL-C) levels (P < 0.05). In addition, patients in tertile 1 were more likely to have a history of stroke, while patients in tertile 3 had the highest heart rate (P < 0.05).
Correlation Between TyG Index and Other Variables
In Spearman’s rank correlation analysis, TyG index was positively correlated with BMI, triglyceride, LDL-C, fasting glucose and HbA1c, but positively correlated with age and HDL-C in STEMI patients who underwent primary angiography (P < 0.0001, Table 2).
Correlation Between TyG Index and In-hospital Mortality
Overall, 46 patients died during hospitalization with in-hospital mortality rates of 1.5%, 2.2%, 2.6% for tertile 1, tertile 2, and tertile 3, respectively (Table 3). Despite the numerical increase in in-hospital mortality, TyG index was not significantly correlated with mortality either as a continuous or categorical variable in single-variable logistic regression analysis. Nonetheless, after adjusting for age and sex (model 1), TyG index was correlated with higher in-hospital mortality when treated as a continuous variable (adjusted OR = 1.75, 95% CI: 1.16-2.63). In addition, in-hospital mortality in tertile 3 was significantly higher than that in tertile 1 (adjusted OR = 2.50, 95% CI: 1.14-5.49). There was no significant difference between the tertile 1 and tertile 2 groups in terms of in-hospital mortality. In model 2, TyG index was significantly correlated with in-hospital mortality as a continuous variable (adjusted OR = 1.95, 95% CI: 1.25-3.03) or categorical variable (tertile 3 vs. tertile 1: adjusted OR = 2.80, 95% CI: 1.23-6.38). In multivariable logistic regression analysis, TyG index as a continuous variable (adjusted OR = 2.54, 95% CI: 1.42-4.54) or categorical variable (tertile 3 vs. tertile 1: adjusted OR = 3.57, 95% CI: 1.24-10.29) was an independent predictor of in-hospital mortality after fully adjusting for multiple confounders (model 3).
Table
3.
Correlation between TyG index and in-hospital mortality.
Category
Event
Odds ratio (95% CI)
Unadjusted model
Model 1
Model 2
Model 3
TyG index per unit increase
46 (2.1%)
1.40 (0.96, 2.04)
1.75 (1.16, 2.63)
1.95 (1.25, 3.03)
2.54 (1.42, 4.54)
Tertile 1
11 (1.5%)
Reference
Reference
Reference
Reference
Tertile 2
16 (2.2%)
1.47 (0.68, 3.19)
1.88 (0.85, 4.14)
2.00 (0.87, 4.58)
1.89 (0.70, 5.12)
Tertile 3
19 (2.6%)
1.74 (0.82, 3.69)
2.50 (1.14, 5.49)
2.80 (1.23, 6.38)
3.57 (1.24, 10.29)
Model 1 adjusted for age and sex; Model 2 adjusted for age, sex, anterior myocardial infarction, Killip class III/IV, primary PCI, current smoking, previous stroke, chronic kidney disease, heart rate, systolic blood pressure, and LVEF; Model 3 adjusted for age, sex, anterior myocardial infarction, Killip class III/IV, primary PCI, current smoking, previous stroke, chronic kidney disease, heart rate, systolic blood pressure, LVEF, serum creatinine, low-density lipoprotein cholesterol, use of angiotensin converting enzyme inhibitor/angiotensin receptor blocker, β-blockers and statins. LVEF: left ventricular ejection fraction; PCI: percutaneous coronary intervention; TyG: triglyceride glucose.
In Table 4, other independent predictors for in-hospital death were age, primary PCI, systolic blood pressure, and use of statins for STEMI patients who underwent primary angiography.
Table
4.
Single-variable and multivariable logistic regression analysis for predicting in-hospital death.
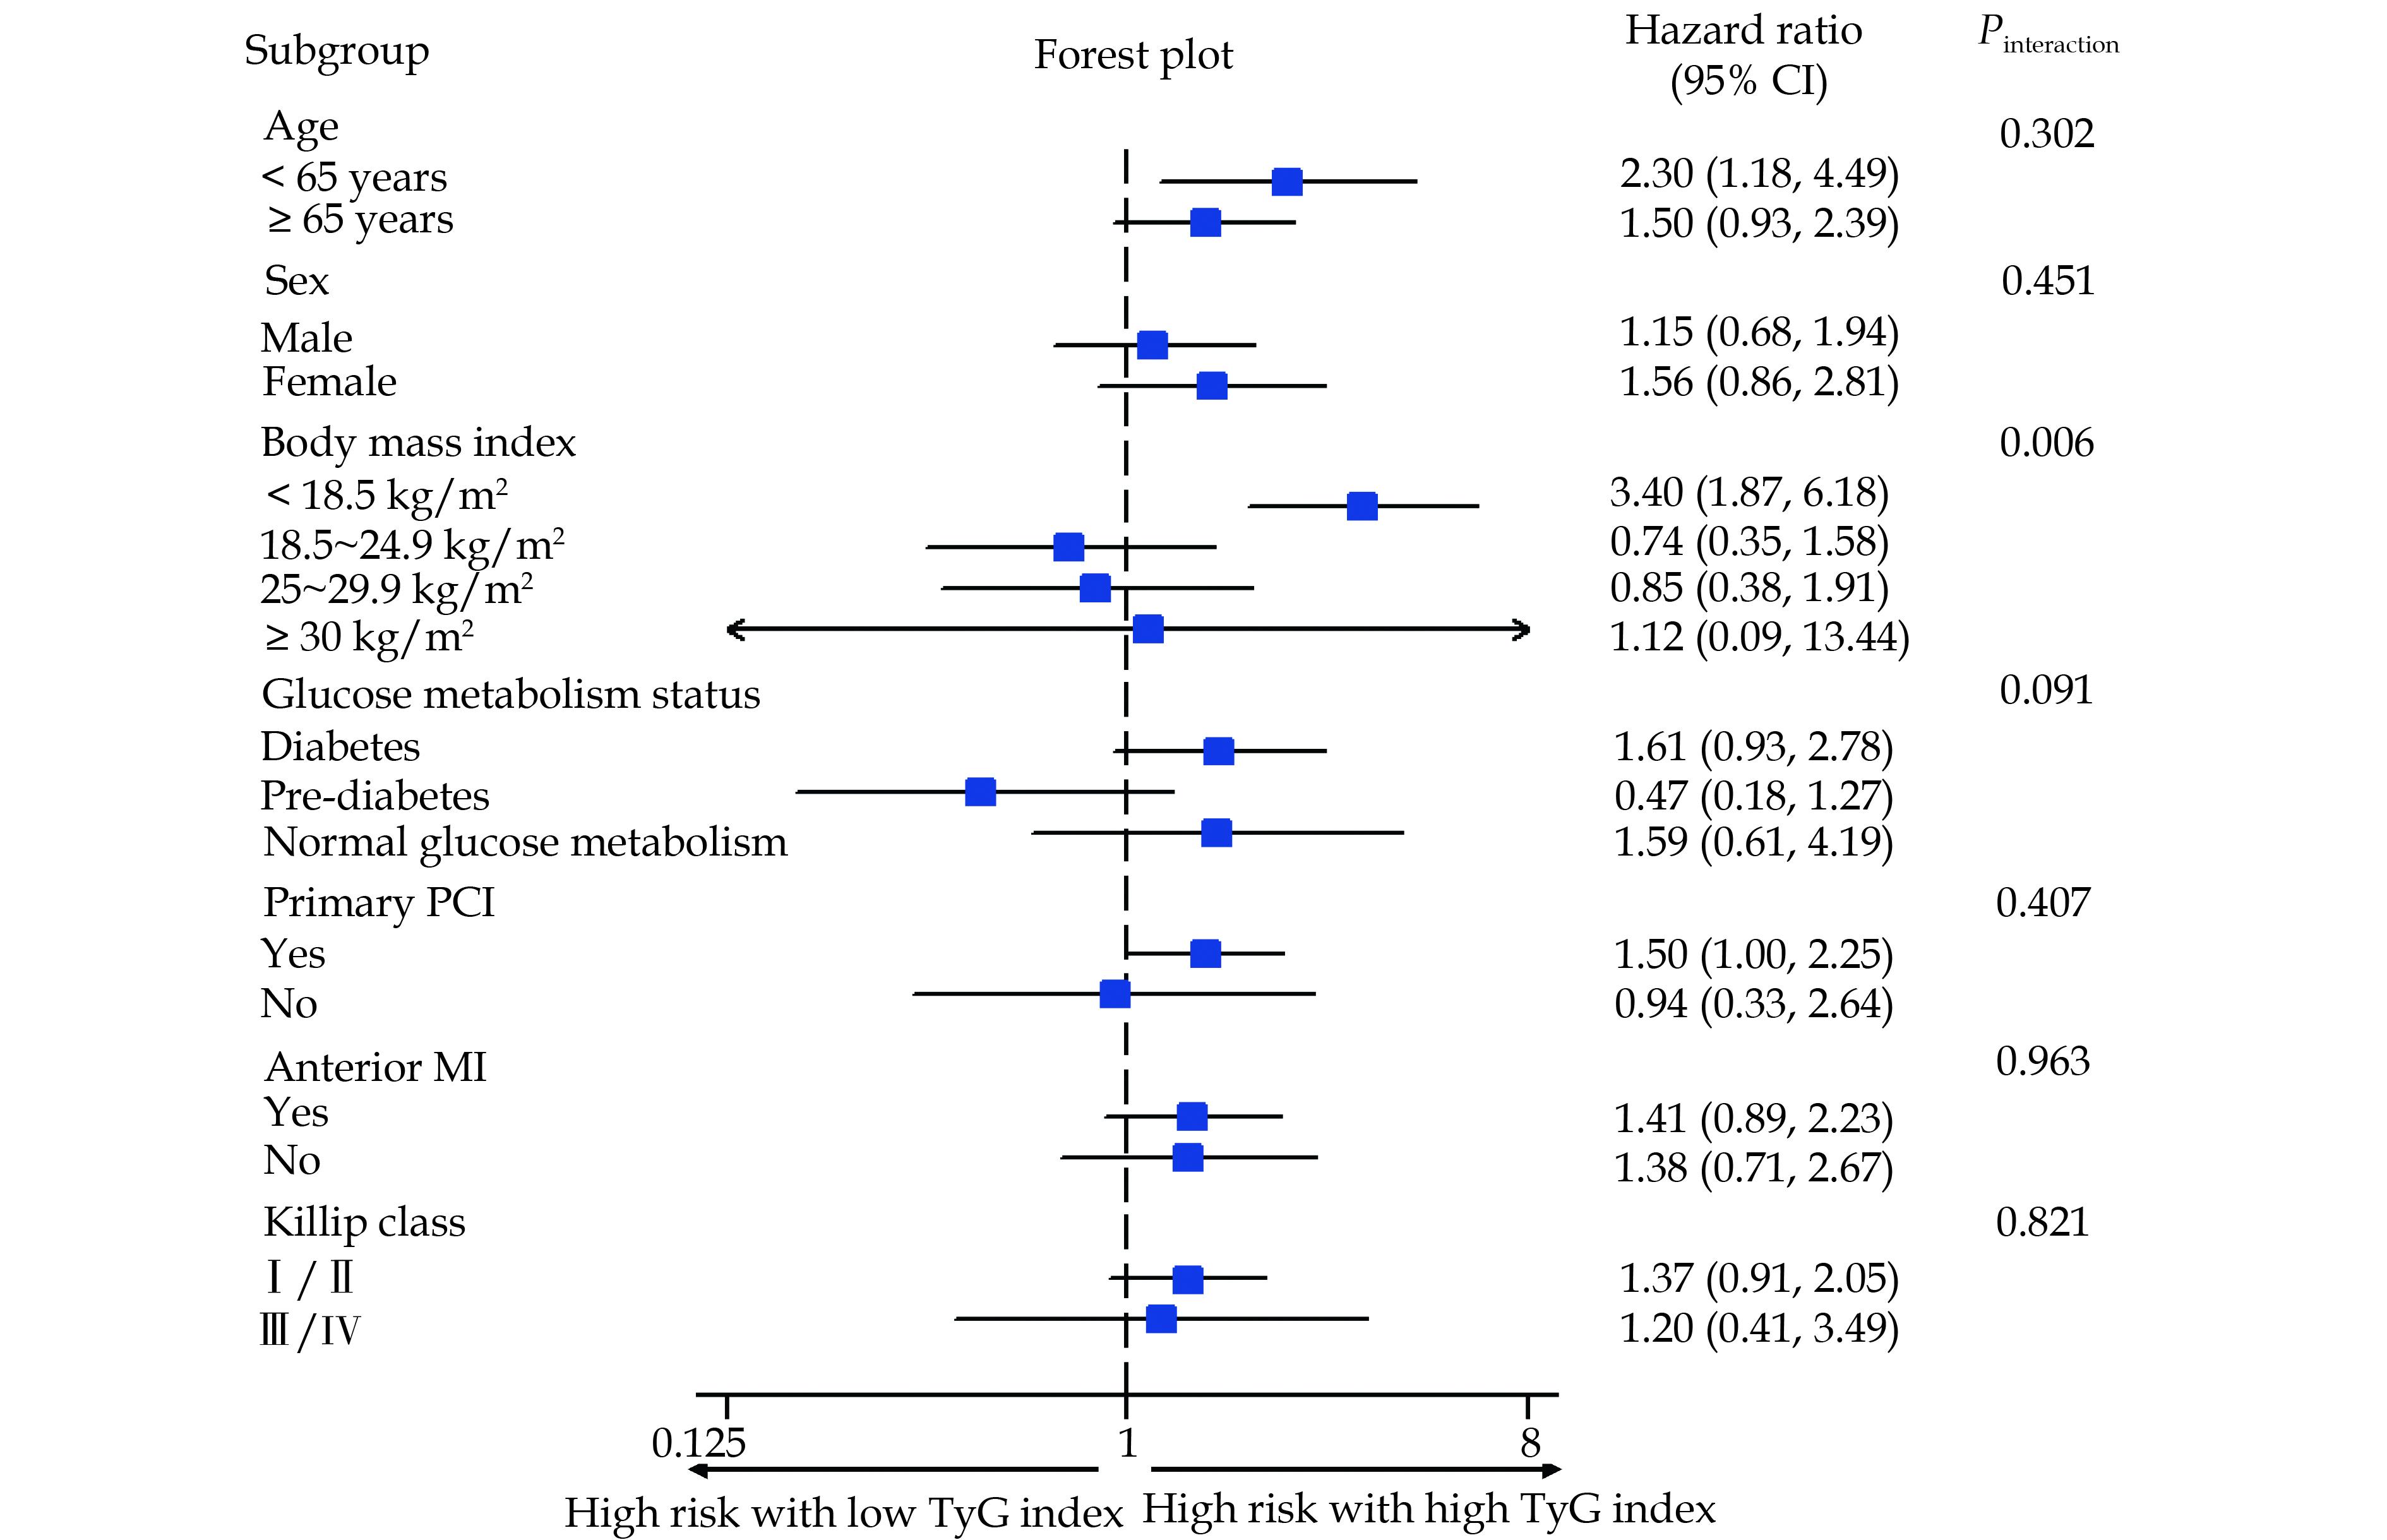
The results of subgroup analysis were consistent with the overall analysis and no interactions were detected between TyG index and age (< 65 years vs. ≥ 65 years), sex (male vs. female), glucose metabolism status (diabetes, pre-diabetes, and normal glucose metabolism), primary PCI (yes vs. no), anterior MI (yes vs. no), and Killip class (I/II vs. III/IV) with regard to in-hospital mortality. However, the prognostic effect of high TyG index was more significant in patients with BMI < 18.5 kg/m2 than that in patients with BMI of 18.5-24.9 kg/m2, 25-29.9 kg/m2, or > 30 kg/m2 (Pinteraction = 0.006) (Figure 2).
Figure
2.
The correlation between TyG index and in-hospital mortality in different subgroup of patients.
This prospective, nationwide, multicenter CAMI registry provides an opportunity to assess the association between TyG index and in-hospital mortality in a large-scale contemporary cohort of consecutive STEMI patients who underwent primary angiography within 12 h from symptom onset. This study showed that TyG index was positively correlated with in-hospital mortality rate. In addition, the predictive value of high TyG index for in-hospital death was more significant in underweight patients.
IR was positively correlated with the incidence of microvascular and cardiovascular diseases, including retinopathy, nephropathy, CAD, stroke and peripheral arterial disease.[2,3] Many studies showed that there was a correlation between microvascular disease and cardiovascular disease among diabetes subjects. This is because that they share the same risk factors and pathophysiological mechanisms.[3] The hyperinsulinemic-euglycemic clamp test is the gold standard for evaluating IR. However, it is not widely applied because it is time-consuming and expensive. The homeostasis model assessment of insulin resistance (HOMA-IR) index, calculated by fasting insulin and glucose, is the most frequently used index to evaluate IR. However, fasting insulin levels are not routinely measured in clinical practice, especially in patients undergoing PCI. Furthermore, HOMA-IR reflects only the ability of basal insulin to suppress hepatic glucose production, the concept of IR also includes impairment of fatty acid oxidation and utilization.[25]
TyG index has been recognized as a reliable, simple, and cost-effective alternative to the hyperinsulinemic-euglycemic clamp test and HOMA-IR. Based on FBG and triglyceride levels, TyG index reflects IR from the hepatic and adipose tissues. TyG index is superior to HOMA-IR in predicting IR and carotid atherosclerosis.[5,6] Some studies reported that TyG index was significantly associated with the increased incidence of DM, hypertension, and metabolic syndrome in healthy individuals.[7,8] In addition, it may act as an effective tool to identify patients at high risk of subclinical atherosclerosis or symptomatic cardiovascular disease, including arterial stiffness, carotid atherosclerosis, coronary plaque progression, coronary artery calcification, myocardial infarction, stroke and peripheral arterial disease.[6,9-12] Moreover, several studies showed that TyG index was an independent predictor of major adverse cardiovascular events for subjects with established CAD.[13-15] A study of 438 patients with NSTE-ACS reported that the composite risk of cardiac death, nonfatal MI, target vessel revascularization, congestive heart failure and stroke in patients with high TyG index was significantly higher than patients with low TyG index at 12 months.[13] Wang, et al.[14] enrolled 2,531 patients with DM and ACS to show that TyG index can predict the incidence of 3-year cardiovascular events (all-cause death, non-fatal MI and stroke), suggesting that TyG index may be a useful marker for the risk stratification in these patients. In addition, a retrospective study concluded that high TyG index was positively correlated with the composite risk of all-cause death, non-fatal MI, revascularization, and cardiac readmission at 33 months in 3181 AMI patients.[15] In addition, Luo, et al.[16] indicated that the risks of adverse cardiovascular events (all-cause death, MI and target vessel revascularization) and all-cause death at 30 days, 6 months and 1 year were higher among STEMI patients with TyG index levels in the highest quartile, and high TyG index was significantly associated with an increased risk of 1-year adverse cardiovascular events after adjusting for confounding factors. However, the prognostic effect of TyG index has rarely been assessed in the highest-risk subgroup of patients with STEMI.[16] In addition, most studies did not find a significant correlation between TyG index and death in CAD patients.[17] Only a few studies reported that TyG index level was positively correlated with mortality.[16,18]
In this study, we found that the prevalence of DM, hypertension, and hyperlipidemia was increased with TyG index level. More importantly, TyG index was positively correlated with in-hospital mortality in STEMI patients. Although not fully understood, there are several mechanisms for the correlation between TyG index and in-hospital mortality. First, IR can promote the activation of sympathetic nervous system, the excessive secretion of catecholamine, and the increase of myocardial oxygen consumption.[26,27] Second, ischemic myocardium is primarily dependent on anaerobic metabolism and increased glucose uptake and metabolism are necessary to maintain the myocardial function at the setting of STEMI.[28,29] However, the impaired insulin activity can limit the bioavailability of glucose, lead to a shift to fatty acid metabolism, impair myocardial contractility, and increase the risk of arrhythmia.[30] Third, IR can upregulate the renin-angiotensin-aldosterone system, promote water and sodium reabsorption, increase circulating blood volume, and ultimately lead to cardiac insufficiency.[31,32] Fourth, IR can activate inflammation and oxidative stress, aggravate endothelial dysfunction and microcirculatory disturbance, induce a prothrombotic state, and then lead to coronary flow impairment, increased infarct size and poor cardiac function.[33] Trifunovic et al. found that IR was an independent predictor of residual ST-segment elevation ≥ 2 mm, coronary flow reserve < 2, and single-photon emission computed tomography myocardial perfusion imaging perfusion defect > 20% in nondiabetic patients with STEMI.[34] Lastly, IR can be associated with more complex lesions (SYNTAX score ≥ 23) in patients with acute coronary syndrome.[13]
This study showed that the high TyG index was positively correlated with in-hospital mortality, especially in STEMI patients with low BMI. Existing studies reported that underweight patients were at higher risk of death than those with normal weight. In addition, underweight patients are often more vulnerable and less responsive to supportive therapy.[35] Patients with low BMI often suffer from malnutrition or coexisting chronic diseases, such as tumors, liver insufficiency, or digestive diseases[36]. In the context of STEMI, underweight patients may be less resistant to the physiological changes mentioned above, and are more likely to have a poor prognosis. Therefore, clinicians should pay more attention to patients with low BMI who were admitted for STEMI.
There are some limitations in this study. First, as a secondary analysis of the CAMI registry, the results of the analysis should be interpreted as hypothesis generating. Although rigorous multivariable-adjusted analysis was performed, it was impossible to control all confounding factors. Second, the possibility of selection bias cannot be excluded. This is because we only included participants with FBG, HbA1c and triglyceride levels. Third, although we only included patients who did not receive lipid-lowering therapy, baseline FBG levels can be affected by the use of hypoglycemic drugs before admission. In addition, the CAMI registry did not collect data on alcohol consumption, nutritional diet, and exercise habits of the patients, which may affect the triglyceride levels. Fourth, this study is unable to show the relationship between TyG index and long-term mortality.
CONCLUSIONS
This prospective, multicenter, nationwide registry demonstrated that TyG index was positively correlated with in-hospital mortality in STEMI patients who underwent primary angiography within 12 hours from symptom onset, especially in underweight patients. TyG index may be a useful marker for risk stratification in these patients.
ACKNOWLEDGEMENTS
This work was supported by CAMS Innovation Fund for Medical Sciences (CIFMS: 2021-I2M-1-008), Beijing Municipal Health Commission-Capital Health Development Research Project (2020-1-4032), Chinese Academy of Medical Sciences Innovation Fund for Medical Sciences (CIFMS: 2020-I2M-C&T-B-056), and the Twelfth Five-Year Planning Project of the Scientific and Technological Department of China (2011BAI11B02). All authors had no conflicts of interest to disclose.
Odegaard JI, Chawla A. Pleiotropic actions of insulin resistance and inflammation in metabolic homeostasis. Science 2013; 339: 172−177. doi: 10.1126/science.1230721
[2]
Laakso M. Is insulin resistance a feature of or a primary risk factor for cardiovascular disease? Curr Diab Rep 2015; 15: 105.
[3]
Kurtul BE, Kurtul A, Yalcin F. Predictive value of the SYNTAX score for diabetic retinopathy in stable coronary artery disease patients with a concomitant type 2 diabetes mellitus. Diabetes Res Clin Pract 2021; 177: 108875. doi: 10.1016/j.diabres.2021.108875
[4]
Guerrero-Romero F, Simental-Mendia LE, Gonzalez-Ortiz M, et al. The product of triglycerides and glucose, a simple measure of insulin sensitivity. Comparison with the euglycemic-hyperinsulinemic clamp. J Clin Endocrinol Metab 2010; 95: 3347−3351.
[5]
Vasques AC, Novaes FS, de Oliveira Mda S, et al. TyG index performs better than HOMA in a Brazilian population: a hyperglycemic clamp validated study. Diabetes Res Clin Pract 2011; 93: e98−e100. doi: 10.1016/j.diabres.2011.05.030
[6]
Irace C, Carallo C, Scavelli FB, et al. Markers of insulin resistance and carotid atherosclerosis. A comparison of the homeostasis model assessment and triglyceride glucose index. Int J Clin Pract 2013; 67: 665−672.
[7]
Xie Y, Guo R, Li Z, et al. Temporal relationship between body mass index and triglyceride-glucose index and its impact on the incident of hypertension. Nutr Metab Cardiovasc Dis 2019; 29: 1220−1229. doi: 10.1016/j.numecd.2019.07.003
[8]
Xuan X, Hamaguchi M, Cao Q, et al. U-shaped association between the triglyceride-glucose index and the risk of incident diabetes in people with normal glycemic level: A population-base longitudinal cohort study. Clin Nutr 2021; 40: 1555−1561. doi: 10.1016/j.clnu.2021.02.037
[9]
Guo W, Zhu W, Wu J, et al. Triglyceride glucose index is associated with arterial stiffness and 10-year cardiovascular disease risk in a chinese population. Front Cardiovasc Med 2021; 8: 585776. doi: 10.3389/fcvm.2021.585776
[10]
Won KB, Lee BK, Park HB, et al. Quantitative assessment of coronary plaque volume change related to triglyceride glucose index: The Progression of AtheRosclerotic PlAque DetermIned by Computed TomoGraphic Angiography IMaging (PARADIGM) registry. Cardiovasc Diabetol 2020; 19: 113. doi: 10.1186/s12933-020-01081-w
[11]
Won KB, Park EJ, Han D, et al. Triglyceride glucose index is an independent predictor for the progression of coronary artery calcification in the absence of heavy coronary artery calcification at baseline. Cardiovasc Diabetol 2020; 19: 34. doi: 10.1186/s12933-020-01008-5
[12]
Ding X, Wang X, Wu J, et al. Triglyceride-glucose index and the incidence of atherosclerotic cardiovascular diseases: a meta-analysis of cohort studies. Cardiovasc Diabetol 2021; 20: 76. doi: 10.1186/s12933-021-01268-9
[13]
Mao Q, Zhou D, Li Y, et al. The triglyceride-glucose index predicts coronary artery disease severity and cardiovascular outcomes in patients with non-ST-segment elevation acute coronary syndrome. Dis Markers 2019; 2019: 6891537.
[14]
Wang L, Cong HL, Zhang JX, et al. Triglyceride-glucose index predicts adverse cardiovascular events in patients with diabetes and acute coronary syndrome. Cardiovasc Diabetol 2020; 19: 80. doi: 10.1186/s12933-020-01054-z
[15]
Zhang Y, Ding X, Hua B, et al. High triglyceride-glucose index is associated with adverse cardiovascular outcomes in patients with acute myocardial infarction. Nutr Metab Cardiovasc Dis 2020; 30: 2351−2362. doi: 10.1016/j.numecd.2020.07.041
[16]
Luo E, Wang D, Yan G, et al. High triglyceride-glucose index is associated with poor prognosis in patients with acute ST-elevation myocardial infarction after percutaneous coronary intervention. Cardiovasc Diabetol 2019; 18: 150. doi: 10.1186/s12933-019-0957-3
[17]
Luo JW, Duan WH, Yu YQ, et al. Prognostic significance of triglyceride-glucose index for adverse cardiovascular events in patients with coronary artery disease: a systematic review and meta-analysis. Front Cardiovasc Med 2021; 8: 774781. doi: 10.3389/fcvm.2021.774781
[18]
Jiao Y, Su Y, Shen J, et al. Evaluation of the long-term prognostic ability of triglyceride-glucose index for elderly acute coronary syndrome patients: a cohort study. Cardiovasc Diabetol 2022; 21: 3. doi: 10.1186/s12933-021-01443-y
[19]
Xu H, Li W, Yang J, et al. The China Acute Myocardial Infarction (CAMI) Registry: A national long-term registry-research-education integrated platform for exploring acute myocardial infarction in China. Am Heart J 2016; 175: 193-201 e3.
[20]
Thygesen K, Alpert JS, Jaffe AS, et al. Third universal definition of myocardial infarction. Eur Heart J 2012; 33: 2551−2567. doi: 10.1093/eurheartj/ehs184
[21]
American Diabetes A. Classification and Diagnosis of Diabetes: Standards of Medical Care in Diabetes-2018. Diabetes Care 2018; 41: S13−S27. doi: 10.2337/dc18-S002
[22]
Williams B, Mancia G, Spiering W, et al. 2018 ESC/ESH Guidelines for the management of arterial hypertension. Eur Heart J 2018; 39: 3021−3104. doi: 10.1093/eurheartj/ehy339
[23]
Rabar S, Harker M, O'Flynn N, et al. Lipid modification and cardiovascular risk assessment for the primary and secondary prevention of cardiovascular disease: summary of updated NICE guidance. BMJ 2014; 349: g4356. doi: 10.1136/bmj.g4356
[24]
Levey AS, Eckardt KU, Tsukamoto Y, et al. Definition and classification of chronic kidney disease: a position statement from Kidney Disease: Improving Global Outcomes (KDIGO). Kidney Int 2005; 67: 2089−2100. doi: 10.1111/j.1523-1755.2005.00365.x
[25]
Simental-Mendia LE, Rodriguez-Moran M, Guerrero-Romero F. The product of fasting glucose and triglycerides as surrogate for identifying insulin resistance in apparently healthy subjects. Metab Syndr Relat Disord 2008; 6: 299−304. doi: 10.1089/met.2008.0034
[26]
Scherrer U, Sartori C. Insulin as a vascular and sympathoexcitatory hormone: implications for blood pressure regulation, insulin sensitivity, and cardiovascular morbidity. Circulation 1997; 96: 4104−4113. doi: 10.1161/01.CIR.96.11.4104
[27]
Paolillo S, Rengo G, Pellegrino T, et al. Insulin resistance is associated with impaired cardiac sympathetic innervation in patients with heart failure. Eur Heart J Cardiovasc Imaging 2015; 16: 1148−1153. doi: 10.1093/ehjci/jev061
[28]
Das DK, Engelman RM, Rousou JA, Breyer RH. Aerobic vs anaerobic metabolism during ischemia in heart muscle. Ann Chir Gynaecol 1987; 76: 68−76.
[29]
Stanley WC. Myocardial energy metabolism during ischemia and the mechanisms of metabolic therapies. J Cardiovasc Pharmacol Ther 2004; 9 Suppl 1: S31-S45.
Cooper SA, Whaley-Connell A, Habibi J, et al. Renin-angiotensin-aldosterone system and oxidative stress in cardiovascular insulin resistance. Am J Physiol Heart Circ Physiol 2007; 293: H2009−H2023. doi: 10.1152/ajpheart.00522.2007
[32]
Underwood PC, Adler GK. The renin angiotensin aldosterone system and insulin resistance in humans. Curr Hypertens Rep 2013; 15: 59−70. doi: 10.1007/s11906-012-0323-2
[33]
Creager MA, Luscher TF, Cosentino F, Beckman JA. Diabetes and vascular disease: pathophysiology, clinical consequences, and medical therapy: Part I. Circulation 2003; 108: 1527−1532. doi: 10.1161/01.CIR.0000091257.27563.32
[34]
Trifunovic D, Stankovic S, Sobic-Saranovic D, et al. Acute insulin resistance in ST-segment elevation myocardial infarction in non-diabetic patients is associated with incomplete myocardial reperfusion and impaired coronary microcirculatory function. Cardiovasc Diabetol 2014; 13: 73. doi: 10.1186/1475-2840-13-73
[35]
Song C, Fu R, Yang J, et al. The association between body mass index and in-hospital outcome among patients with acute myocardial infarction-insights from China Acute Myocardial Infarction (CAMI) registry. Nutr Metab Cardiovasc Dis 2019; 29: 808−814. doi: 10.1016/j.numecd.2019.04.001
[36]
Kalantar-Zadeh K, Block G, Horwich T, Fonarow GC. Reverse epidemiology of conventional cardiovascular risk factors in patients with chronic heart failure. J Am Coll Cardiol 2004; 43: 1439−1444. doi: 10.1016/j.jacc.2003.11.039


 DownLoad: