Figure
1.
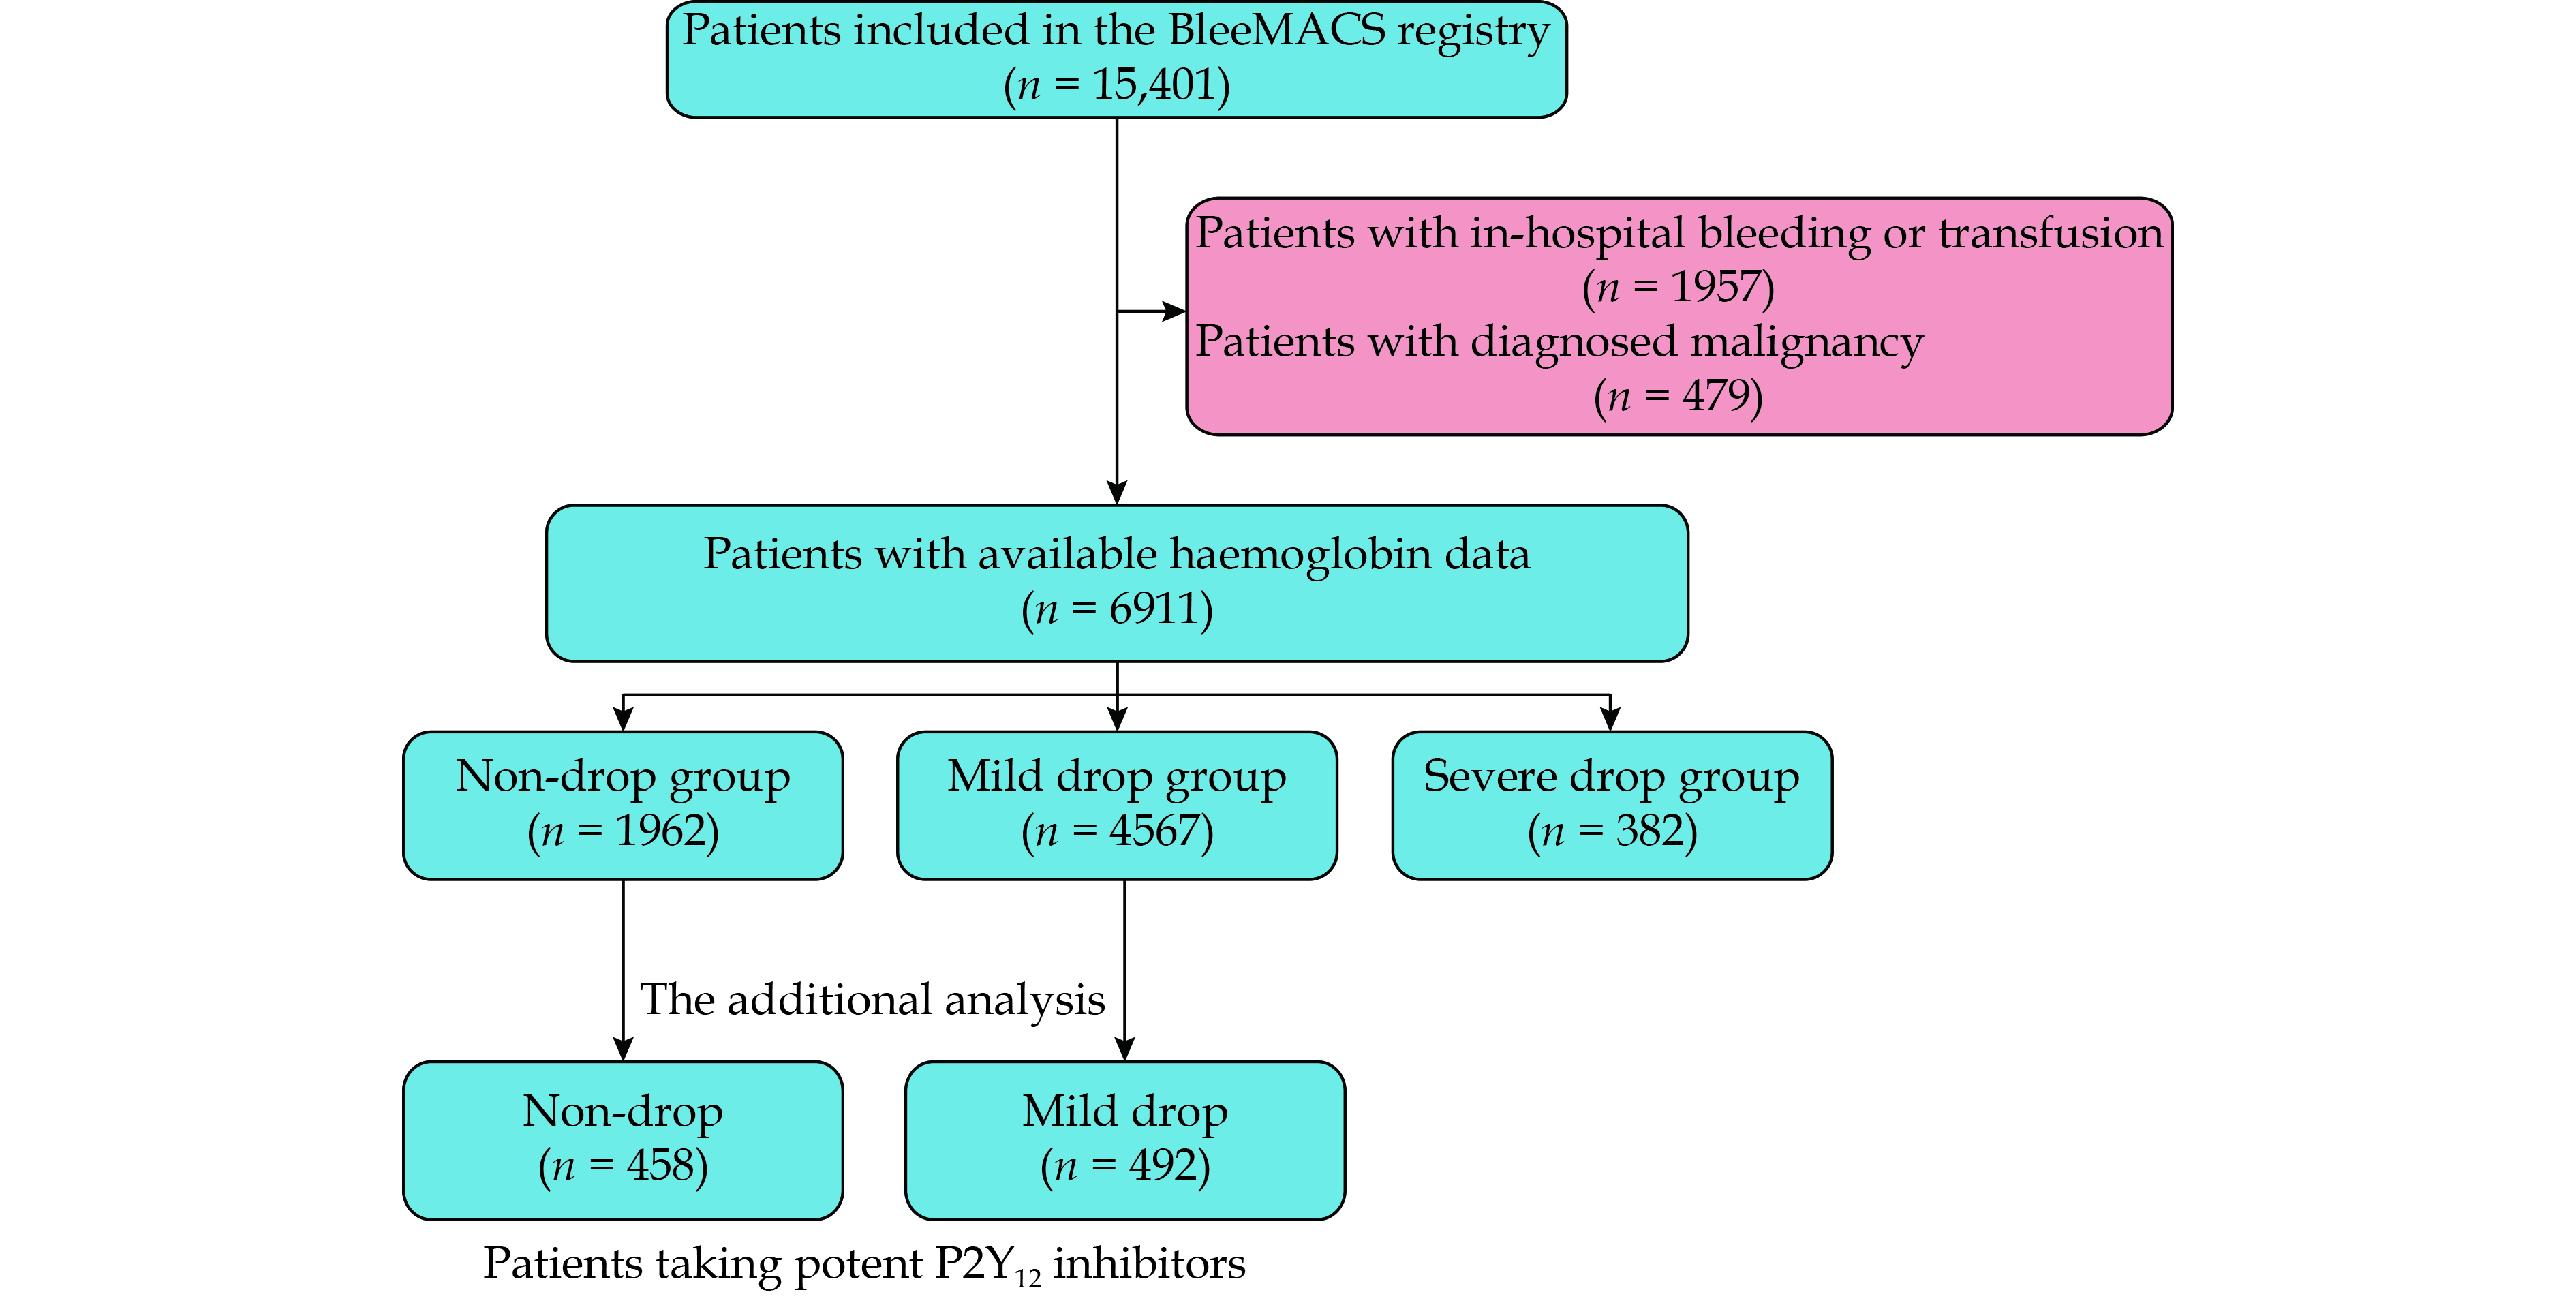
Flow diagram.

| Citation: |
Please cite this article as: ZHANG ZK, YAN Y, LI SY, Raposeiras-Roubín S, Abu-Assi E, Henriques JP, D’Ascenzo F, Saucedo J, GONG W, NIE SP. Mild haemoglobin drop and clinical outcomes in acute coronary syndrome patients: finding from the BleeMACS registry. J Geriatr Cardiol 2022; 19(12): 981−989. DOI: 10.11909/j.issn.1671-5411.2022.12.005.

|
Bleeding events are common in patients with acute coronary syndrome (ACS) and correlate with poor prognosis.[1–4] In-hospital haemoglobin drop is one of the key variables for grading hemorrhage.[5–7] It is reported that up to 88% of ACS patients experienced silent haemoglobin drop during hospitalization.[8,9] Recent study demonstrated the decline in haemoglobin content is strongly associated with adverse clinical outcome in ACS patients, but whether mild haemoglobin drop is related to the increased risk for adverse outcome remains controversial. It’s reported that < 3 g/dL haemoglobin drop was not associated with increased risk for one-year mortality.[10] While another study found a silent haemoglobin drop > 1.13 g/dL is significantly associated with higher risk for one-year mortality.[11]
Moreover, the evidence suggested treatment for patient with ACS was highly hampered by hemoglobin declination, especially medications for platelet aggregation, which is related to the treatment benefit of ACS.[12] By using data from the Bleeding complications in a Multicenter registry of patients discharged after an Acute Coronary Syndrome (BleeMACS) registry, we sought to examine the association between in-hospital haemoglobin drop and risk for adverse clinical outcomes in ACS patients, especially these with mild drop but free of overt bleeding. We also explored whether antiplatelet treatment is hampered due to haemoglobin drop and its impacts.
This is a sub-analysis of the BleeMACS registry.[13] Briefly, the BleeMACS is an international multicenter investigator-initiated observational retrospective registry including 15,401 consecutive ACS patients who underwent percutaneous coronary intervention (PCI) during the index hospitalization. Patients were enrolled from fifteen centers in ten countries including Canada, Brazil, Germany, Poland, the Netherland, Spain, Italy, Greece, China and Japan. Major adverse clinical outcomes were recorded during the one-year follow-up. The local institution’s Human Research Committee has approved the study protocol.
Patients with available haemoglobin data at admission and discharge were included. Exclusion criteria are in-hospital overt bleeding (defined as any TIMI major or minor bleeding, any GUSTO sever or moderate bleeding, and any BARC type 3 or 5 bleeding), in-hospital transfusion and history of malignancy at admission. Of all patients in the BleeMACS registry, 9347 patients had available haemoglobin data at admission and discharge, 1957 patients were excluded for in-hospital bleeding or transfusion and 479 patients were excluded for malignancy at admission. Eventually 6911 patients were included in this sub-analysis (Figure 1).
Haemoglobin drop was calculated using the haemoglobin value at admission and discharge, positive difference was defined as haemoglobin drop whilst zero or negative difference as no haemoglobin drop. Patients were categorized into three groups by the presence and amount of in-hospital haemoglobin drop: non-drop group, mild drop (< 3 g/dL) group and severe drop (≥ 3 g/dL) group. The potent P2Y12 inhibitors were defined as the composite of ticagrelor and prasugrel. Oral anticoagulation were defined as the use of warfarin or dicumarinic.
Endpoints were major adverse cardiac event (MACE, defined as the composite of death and reinfarction) and bleeding after discharge. Death was defined as all-cause mortality. Reinfarction was defined as clinical symptoms (or new electrocardiographic changes) and new elevation of troponin and/or creatine kinase or creatine kinase-MB. Bleeding was defined as hemorrhage requiring transfusion and/or hospitalization.
Continuous data are presented as mean ± SD, median (interquartile range) and compared using the independent Student’s t-test or the Mann-Whitney-Wilcoxon rank sum test when appropriate. Categorical data are presented as counts (percentages) and compared using the Pearson’s chi-squared test. MACE and bleeding are presented as cumulative incidence calculated using the Kaplan-Meier method. Multivariate Cox regression analysis was used to assess the association between haemoglobin drop and MACE while adjusted with potential confounders. The following variables were entered into the model for adjust 1: age, female sex, diabetes mellitus, hypertension, prior acute myocardial infarction (AMI), prior PCI, prior coronary artery bypass graft, prior ischemic stroke, prior bleeding, ACS diagnosis at admission, Killip classification ≥ 2 at admission, femoral access, multivessel disease, using of drug-eluting stent, PCI without stent, thrombolysis, complete revascularization, prescription for aspirin, prescription for oral anticoagulation, and prescription for statin. Variables for adjust 2 were variables in adjust 1 plus prescription for potent P2Y12 inhibitors. Restricted cubic spline regression was used to assess the potentially non-linear associations between haemoglobin drop and endpoints.
We selected patients taking potent P2Y12 inhibitors from non-drop group and mild drop group for additional analysis to examine whether potent P2Y12 inhibitors benefits patients with mild haemoglobin drop. Propensity score matching was used to avoid selective bias in the additional analysis, patients with mild haemoglobin drop were randomly matched with those without haemoglobin drop based on the nearest neighbor in terms of Mahalanobis distance with a caliper of 0.02. The propensity score of experience of in-hospital haemoglobin drop was estimated with a logistic regression model with the variables of history of peripheral artery disease, history of prior stroke, unstable angina at admission, left ventricle ejection fraction, using of drug-eluting stent, femoral access, and in-hospital heart failure. Multivariate Cox regression analysis was adjusted with potential confounders.
Statistical analysis was performed using the SPSS 26.0 (SPSS Inc., IBM, Chicago, IL, USA) and the R statistical software 3.6.3 (http://www.r-proje ct.org). A two-sided P-value < 0.05 was considered statistically significant.
Of all included patients, 1962 patients (28.4%) didn’t experience haemoglobin drop, 4567 patients (66.1%) had mild haemoglobin drop and 382 patients (5.5%) had severe haemoglobin drop during the index hospital stay. The demographic information, medical history, procedure data and medication at discharge were described according to different haemoglobin drop status in Table 1. Patients with severe haemoglobin drop were found to be older, more frequent with histories of peripheral artery disease. Patients in both haemoglobin drop groups had fewer history of prior AMI and prior PCI than those in non-drop group. Patients with AMI were more likely to experience in-hospital haemoglobin drop than those with unstable angina.
| Variables | Non-drop group (n = 1962) | Mild drop group (n = 4567) | Severe drop group (n = 382) | P-value |
| Haemoglobin at admission, g/dL | 13.39 ± 1.74 | 14.17 ± 1.61 | 15.29 ± 1.58 | < 0.001 |
| Haemoglobin at discharge, g/dL | 13.99 ± 4.03 | 13.02 ± 1.62 | 11.44 ± 1.87 | < 0.001 |
| Demographics | ||||
| Age, yrs | 63.17 ± 12.69 | 64.59 ± 12.78 | 65.90 ± 12.57 | < 0.001 |
| Male | 1560 (79.5%) | 3570 (78.2%) | 293 (76.7%) | 0.331 |
| Medical history | ||||
| Diabetes mellitus | 511 (26.0%) | 1212 (26.5%) | 115 (30.1%) | 0.256 |
| Hypertension | 1155 (58.9%) | 2718 (59.5%) | 236 (61.8%) | 0.565 |
| Dyslipidemia | 1025 (52.2%) | 2269 (49.7%) | 188 (49.2%) | 0.148 |
| Peripheral artery disease | 106 (5.4%) | 336 (7.4%) | 34 (8.9%) | 0.005 |
| Prior acute myocardial infarction | 268 (13.7%) | 567 (12.4%) | 34 (8.9%) | 0.032 |
| Prior percutaneous coronary intervention | 285 (14.5%) | 560 (12.3%) | 35 (9.2%) | 0.004 |
| Prior coronary artery bypass graft | 77 (3.9%) | 173 (3.8%) | 12 (3.1%) | 0.764 |
| Prior stroke | 123 (6.3%) | 258 (5.6%) | 31 (8.1%) | 0.117 |
| Prior chronic heart failure | 59 (3.0%) | 127 (2.8%) | 12 (3.1%) | 0.834 |
| Prior bleeding | 100 (5.1%) | 166 (3.7%) | 11 (3.0%) | 0.016 |
| Diagnosis at admission | < 0.001 | |||
| Acute myocardial infarction | 1616 (82.4%) | 3952 (86.5%) | 359 (94.0%) | |
| ST-segment elevation myocardial infarction | 1004 (51.2%) | 2306 (50.5%) | 244 (63.9%) | |
| Non-ST-segment elevation myocardial infarction | 612 (31.2%) | 1646 (36.0%) | 115 (30.1%) | |
| Unstable angina | 346 (17.6%) | 615 (13.5%) | 23 (6.0%) | |
| Killip class > 2 | 220 (12.1%) | 552 (12.5%) | 100 (26.5%) | < 0.001 |
| Baseline tests | ||||
| Left ventricular ejection fraction, % | 53.7 (47.0–60.0)* | 54.5 (48.0–60.0)* | 49.8 (40.0–60.0)* | < 0.001 |
| Creatinine at admission, mg/dL | 0.9 (0.7–1.0)* | 0.9 (0.8–1.0)* | 1.0 (0.8–1.1)* | < 0.001 |
| Procedure data | ||||
| Femoral access | 859 (48.4%) | 1529 (40.2%) | 172 (49.9%) | < 0.001 |
| Multivessel | 810 (45.7%) | 1849 (48.7%) | 182 (52.8%) | 0.021 |
| Using of drug-eluting stent | 920 (46.9%) | 2307 (50.5%) | 193 (50.5%) | 0.025 |
| Percutaneous coronary intervention without stent | 51 (2.6%) | 93 (2.0%) | 23 (6.0%) | < 0.001 |
| Thrombolysis | 48 (2.4%) | 99 (2.2%) | 17 (4.5%) | 0.018 |
| Revascularization complete | 1205 (66.2%) | 2643 (62.0%) | 182 (52.1%) | < 0.001 |
| In-hospital outcomes | ||||
| In-hospital reinfarction | 15 (0.8%) | 86 (1.9%) | 12 (3.1%) | < 0.001 |
| In-hospital heart failure | 83 (4.2%) | 191 (4.2%) | 54 (14.1%) | < 0.001 |
| Medication at discharge | ||||
| Aspirin | 1950 (99.4%) | 4544 (99.5%) | 377 (98.7%) | 0.134 |
| Clopidogrel | 1465 (74.7%) | 4017 (88.0%) | 324 (84.8%) | < 0.001 |
| Ticagrelor or prasugrel | 458 (23.8%) | 492 (10.9%) | 39 (10.7%) | < 0.001 |
| Ticagrelor | 235 (12.0%) | 195 (4.3%) | 12 (3.1%) | < 0.001 |
| Prasugrel | 223 (11.4%) | 297 (6.5%) | 27 (7.1%) | < 0.001 |
| Oral anticoagulation (warfarin or dicumarinic) | 93 (4.7%) | 235 (5.1%) | 22 (5.8%) | 0.646 |
| Beta-blockers | 1624 (82.9%) | 3823 (83.8%) | 311 (81.4%) | 0.379 |
| Angiotensin-converting enzyme inhibitors/Angiotensin II receptor blockers | 1567 (79.9%) | 3664 (80.3%) | 316 (82.7%) | 0.456 |
| Statin | 1795 (91.5%) | 4321 (94.6%) | 344 (90.1%) | < 0.001 |
| Data are presented as means ± SD or n (%). *Presented as median (interquartile range). | ||||
 DownLoad:
CSV
DownLoad:
CSV
Patients with haemoglobin drop received more prescription of clopidogrel but less potent P2Y12 inhibitors than those without haemoglobin drop. There was no difference in rates of prescription for aspirin or oral anticoagulation drugs among three groups. Patients in mild drop group had significantly higher rate of prescription for statin than the rest.
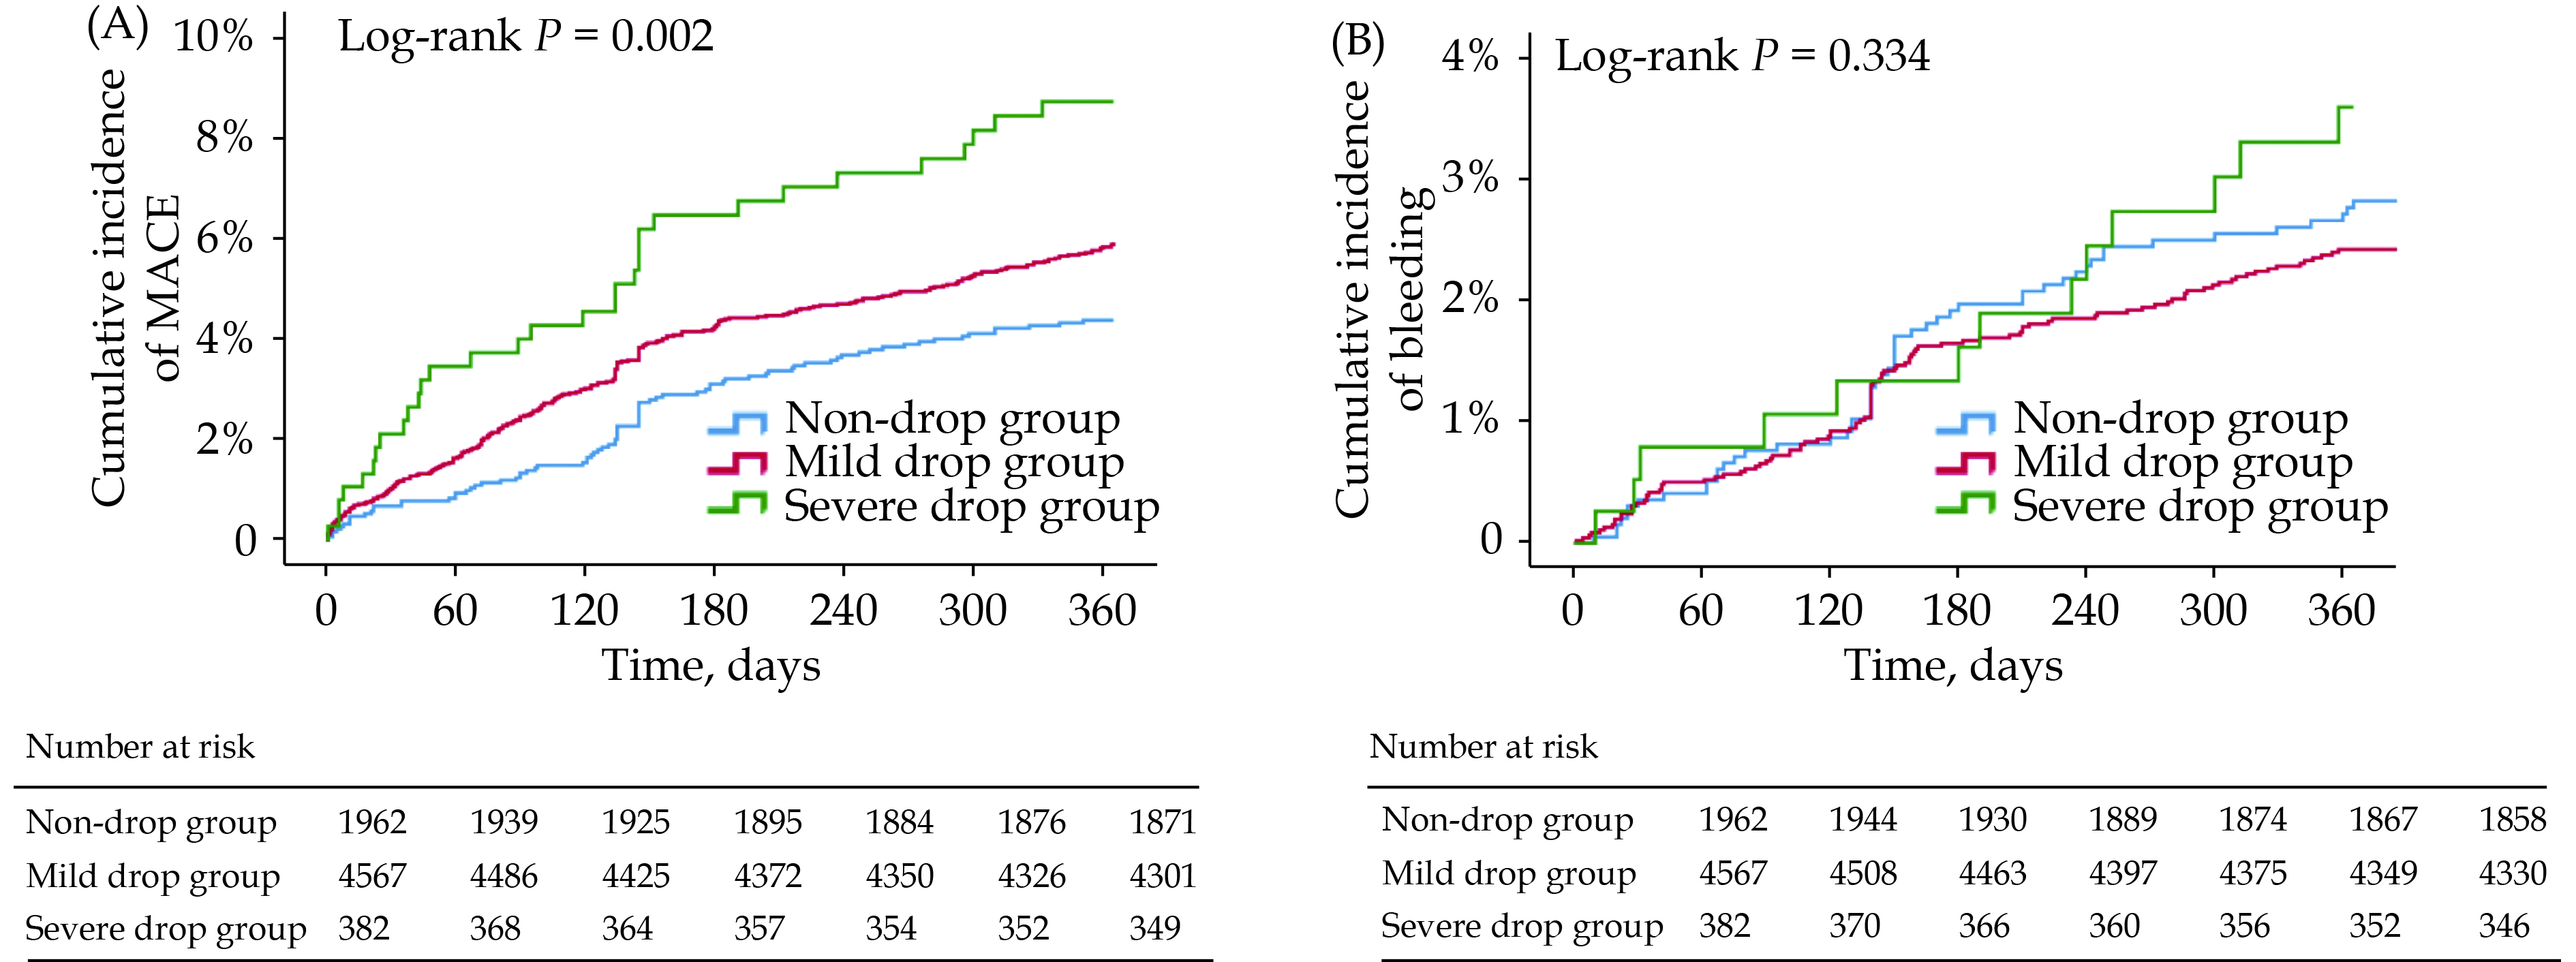
One-year adverse clinical outcomes were described in Table 2. MACE occurred in 380 patients and more frequently in both haemoglobin drop groups (non-drop group vs. mild drop group vs. severe drop group: 4.3% vs. 5.8% vs. 8.4%, P = 0.002). Death and reinfarction were also analyzed separately (Table 2). Bleeding occurred in 175 patients, no difference in rates of bleeding was observed among three groups (non-drop group vs. mild drop group vs. severe drop group: 2.8% vs. 2.4% vs. 3.4%, P = 0.354).
| Outcome | Non-drop group (n = 1962) | Mild drop group (n = 4567) | Severe drop group (n = 382) | P-value |
| Major adverse cardiac endpoint | 84 (4.3%) | 264 (5.8%) | 32 (8.4%) | 0.002 |
| Death | 51 (2.6%) | 151 (3.3%) | 23 (6.0%) | 0.002 |
| Reinfarction | 37 (1.9%) | 134 (2.9%) | 14 (3.7%) | 0.027 |
| Bleeding | 54 (2.8%) | 108 (2.4%) | 13 (3.4%) | 0.354 |
DownLoad:
CSV
Kaplan-Meier event curves of MACE and bleeding were shown in Figure 2. The cumulative incidence of MACE for patients in mild drop group and in severe drop group were higher comparing with non-drop group (Figure 2A). Multivariate Cox regression analysis found patients in both drop groups had higher risk for MACE comparing with patients in non-drop group [hazard ratio (HR) = 1.36, 95% CI: 1.06–1.74 for mild drop group; HR = 2.01, 95% CI: 1.34–3.02 for severe drop group; Table 3]. Time to event curves showed no difference in cumulative incidence of one-year bleeding in three groups (Figure 2B). However, there was no statistical difference in bleeding events among three groups.
| Outcome | Hazard ratio (95% CI) | |||||||||
| Reference | Unadjusted | Adjusted 1 | Adjusted 2 | |||||||
| Non-drop | Mild drop | Severe drop | Mild drop | Severe drop | Mild drop | Severe drop | ||||
| Major adverse cardiac endpoint | – | 1.36 (1.06–1.74) | 2.01 (1.34–3.02) | 1.36 (1.03–1.80) | 1.70 (1.07–2.68) | 1.30 (0.97–1.73) | 1.75 (1.10–2.80) | |||
| Death | – | 1.28 (0.93–1.76) | 2.36 (1.44–3.86) | 1.26 (0.86–1.85) | 2.04 (1.15–3.61) | 1.24 (0.83–1.84) | 2.18 (1.21–3.93) | |||
| Reinfarction | – | 1.56 (1.09–2.25) | 1.99 (1.08–3.69) | 1.50 (1.01–2.22) | 1.70 (0.89–3.27) | 1.39 (0.94–2.05) | 1.56 (0.80–3.04) | |||
| Bleeding | – | 0.86 (0.62–1.19) | 1.27 (0.69–2.32) | 0.92 (0.63–1.33) | 1.22 (0.61–2.46) | 0.95 (0.65–1.39) | 1.22 (0.59–2.54) | |||
| Adjusted 1: adjusted for age, female sex, diabetes mellitus, hypertension, prior acute myocardial infarction, prior percutaneous coronary intervention, prior coronary artery bypass graft, prior ischemic stroke, prior bleeding, acute coronary syndrome diagnosis at admission, Killip classification ≥ 2 at admission, femoral access, multivessel disease, using of drug-eluting stent, percutaneous coronary intervention without stent, thrombolysis, complete revascularization, prescription for aspirin, prescription for oral anticoagulation, and prescription for statin. Adjusted 2: adjusted for variables in Adjusted 1 plus prescription for potent P2Y12 inhibitors. | ||||||||||
DownLoad:
CSV
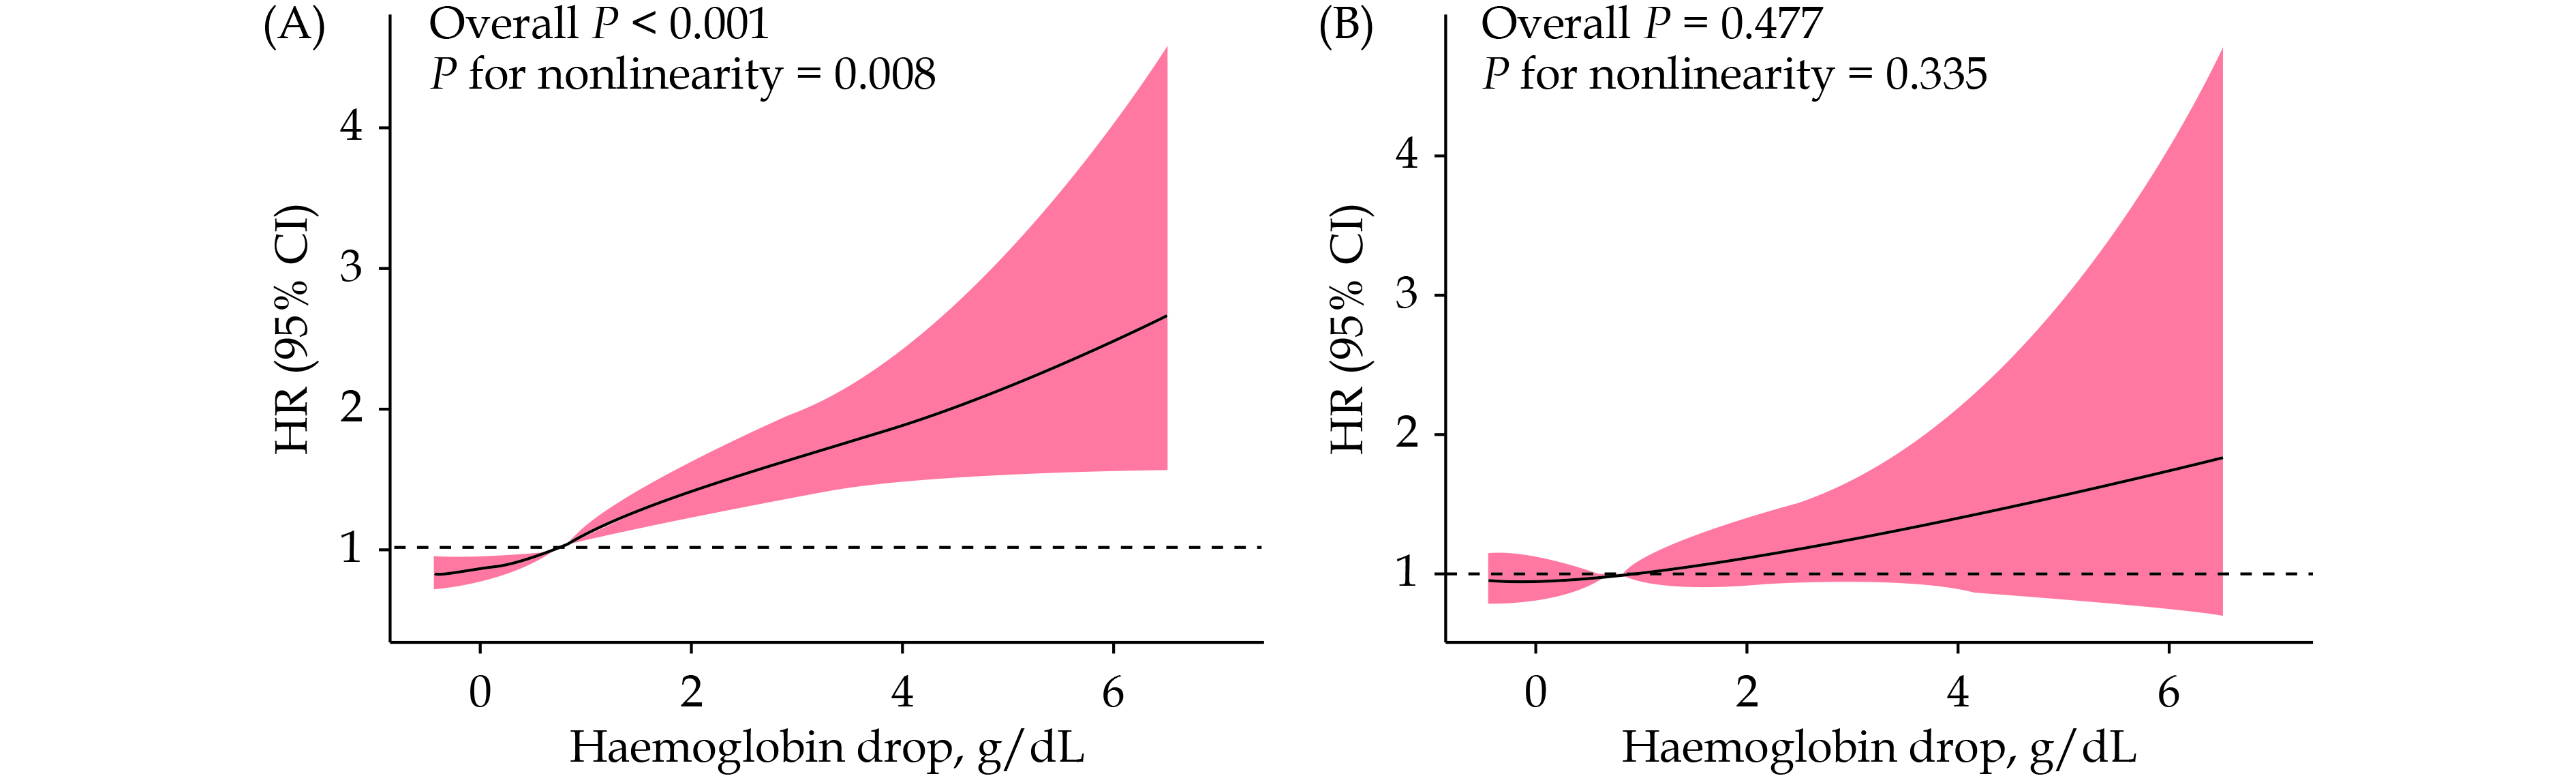
Restricted cubic spline regression analysis found a non-linear relationship between haemoglobin drop and one-year MACE (Figure 3A). The smallest haemoglobin drop associated with increased risk for one-year MACE was 0.76 g/dL (HR = 1.02, 95% CI: 1.01–1.04). The 3 g/dL haemoglobin drop was associated with a 1.67-fold higher risk for one-year MACE (HR = 1.67, 95% CI: 1.37–2.03). Interestingly, no association between haemoglobin drop and one-year bleeding was observed (overall P = 0.07) (Figure 3B).
As shown in Table 3, patients in both drop groups had higher risk for one-year MACE comparing to non-drop group in adjust 1 (adjusted HR = 1.36, 95% CI: 1.03–1.80 for mild drop group; adjusted HR = 1.70, 95% CI: 1.07–2.68 for severe drop group). To evaluate whether the difference could be explained by disparities in the potent P2Y12 inhibitor prescription related to hemoglobin drop status, we further adjusted the use of potent P2Y12 inhibitor. After additional adjustment, the risk for one-year MACE for patients in mild drop group was no longer higher than those in non-drop group (adjusted HR = 1.30, 95% CI: 0.97–1.73 for mild drop group; adjusted HR = 1.75, 95% CI: 1.10–2.80 for severe drop group).
To investigate whether potent P2Y12 inhibitors benefited patients with mild haemoglobin drop, we further selected patients taking potent P2Y12 inhibitors from non-drop group and mild drop group to perform additional analysis. After excluded patients without potent P2Y12 inhibitors, 458 patients in non-drop group and 492 patients in mild drop group were selected.
Baseline characteristics of patients in the additional analysis were listed (supplemental material, Table 1S), patients in mild drop group had higher rates of peripheral artery disease history (mild drop group vs. non-drop group: 4.1% vs. 1.7%, P = 0.035), lower rates of history of prior stroke (mild drop group vs. non-drop group: 1.4% vs. 3.5%, P = 0.038) than those in non-drop group. The diagnosis of AMI (mild drop group vs. non-drop group: 85.8% vs. 78.2%, P = 0.002) and using of drug-eluting stent (mild drop group vs. non-drop group: 47.8% vs. 27.7%, P < 0.001) were more frequent in patients in the mild drop group.
Propensity score matching was used to eliminate the difference of characteristics which may affect the adverse clinical outcome between two groups. The demographic characteristics after propensity score matching were also listed (supplemental material, Table 1S). The rates of adverse outcome and Multivariate Cox regression analysis results were described in Table 4. No difference was found in risk for one-year MACE for patients in mild drop group comparing to those in non-drop group (adjusted HR = 1.52, 95% CI: 0.49–4.72, P = 0.47; Table 4).
| Outcome | Adverse outcomes | Adjusted hazard ratio (95% CI) | |||||||||||
| Before PSM | After PSM | Before PSM* | After PSM** | ||||||||||
| Non-drop (n = 458) | Mild drop (n = 492) | P-value | Non-drop (n = 271) | Mild drop (n = 271) | P-value | Mild drop | P-value | Mild drop | P-value | ||||
| Major adverse cardiac endpoint | 8 (1.8%) | 19 (3.9%) | 0.051 | 5 (1.9%) | 8 (3.0%) | 0.400 | 2.28 (0.95–5.02) | 0.067 | 1.52 (0.49–4.72) | 0.466 | |||
| Death | 6 (1.3%) | 12 (2.4%) | 0.202 | 3 (1.1%) | 4 (1.5%) | > 0.999 | 2.00 (0.74–5.39) | 0.171 | 1.62 (0.50–7.39) | 0.537 | |||
| Reinfarction | 2 (0.4%) | 7 (1.4%) | 0.119 | 2 (0.7%) | 4 (1.5%) | 0.686 | 3.10 (0.64–15.02) | 0.161 | 2.20 (0.38–12.81) | 0.380 | |||
| Bleeding | 17 (3.7%) | 14 (2.8%) | 0.453 | 7 (2.6%) | 8 (3.0%) | 0.793 | 0.73 (0.46–1.49%) | 0.394 | 1.28 (0.45–3.64) | 0.641 | |||
| *Referred to variables included in the adjust model before PSM: history of peripheral artery disease, prior stroke, diagnosis at admission [acute myocardial infarction, unstable angina (referent)], left ventricle ejection fraction, using of drug-eluting stent, and in-hospital heart failure. **Referred to variables included in the adjust model after PSM: prior stroke and in-hospital heart failure. PSM: propensity score matching. | |||||||||||||
DownLoad:
CSV
In this sub-analysis of the BleeMACE registry, we found the association between mild in-hospital haemoglobin drop and one-year adverse clinical outcome in ACS patients. Patients with in-hospital haemoglobin drop showed a continuous, direct association with the increased risk for one-year MACE. Further analysis showed the rates of prescription of potent P2Y12 inhibitors at discharge were reduced in patients with in-hospital haemoglobin drop. After multivariable adjustment suboptimal in the additional analysis, we found the reduced prescription of potent P2Y12 inhibitors may be responsible for the increased risk for one-year MACE.
Haemoglobin drop is commonly found in ACS patients during index hospital stay.[14,15] A study using data from Health Facts database reported that up to 57.5% of AMI patients with normal haemoglobin level at admission developed hospital acquired anemia and 86.5% in the absence of overt bleeding.[16] It is reported that old age, diabetes mellitus, female sex, renal dysfunction and reduced left ventricular ejection fraction were related with hospital acquired anemia.[17,18] Salisbury, et al.[16] found that hospital acquired anemia is correlated with in-hospital mortality after adjustment with bleeding severity, indicating haemoglobin drop is associated with adverse outcome even in the absence of overt bleeding. There are several mechanisms may partially explain the association between the declining in haemoglobin content and adverse clinical outcome. Left ventricle dilatation and adverse remodeling is triggered to maintain systemic oxygen delivery after haemoglobin decreased, which may have catastrophic effects on the myocardium, including higher oxygen consumption, cardiac fibrosis and myocyte loss.[19–21] But why this association exists remains insufficiently investigated.
The association between in-hospital haemoglobin status and adverse clinical outcome varied in previous studies. Leonardi, et al.[10] assessed the association between the in-hospital haemoglobin drop and adverse clinical outcome using patients recruited in the Minimizing Adverse Haemorrhagic Events by Transradial Access Site and Systemic Implementation of Angiox (MATRIX) trial. In this study, 88.5% of included patients experienced silent haemoglobin drop during the index hospitalization. Results showed that minor (3–5 g/dL) and major (> 5 g/dL) in-hospital haemoglobin drop are strongly correlated with the risk for mortality in patients without overt bleeding, but not associated when < 3 g/dL. Of included patients, 48.5% of patients received prescription for potent P2Y12 inhibitors and 36.4% of patients received prescription for clopidogrel.[10] In the analysis using patients from the Intracoronary Stenting and Antithrombotic Regimen: Rapid Early Action for Coronary Treatment (ISAR-REACT 5), haemoglobin drop was found in 3142 patients (81.9%) and 2957 patients (94.1%) did not experienced overt bleeding. The receiver operating characteristic curve analysis revealed a cut-off value at 1.65 g/dL for patients without overt bleeding for predicting one-year mortality. Indicating that even a slight haemoglobin drop could increase the risk for subsequent adverse events in patients without overt bleeding.[11] Of note, the ISAR-REACT 5 is a random controlled study focused on new-generation antiplatelet therapy, thus all included patients received treatment of potent P2Y12 inhibitors (ticagrelor or prasugrel). In our sub-analysis of an international multicenter real-world registry, 71.6% of patients experienced mild in-hospital haemoglobin drop and associated with an increased risk of one-year MACE without an increased risk of bleeding event. We hypothesized that the unparallel risk for MACE and bleeding might be resulted from different prescription for P2Y12 inhibitors.
By analyzing medication at discharge, we observed a significantly reduce in rates of prescription for potent P2Y12 inhibitors in patients with in-hospital haemoglobin drop. Previous study observed that physicians may overreact on in-hospital haemoglobin drop and result in withdrawing evidence-based antiplatelet therapy.[12,22,23] Therefore, we suspected that reserved choice of P2Y12 inhibitors may be account for the increased risk for MACE and adverse ischemic events. A secondary analysis confirmed our suspicion, after added different type of P2Y12 inhibitor into the multivariable adjustment, there were no association between haemoglobin drop and one-year MACE in group with haemoglobin drop < 3 g/dL. And by comparing patients taking potent P2Y12 inhibitors in group with no haemoglobin drop and < 3 g/dL haemoglobin drop, we found no difference in risk for MACE or ischemic events. These suggested that increased risk for MACE in patients with in-hospital haemoglobin drop may cause by the insufficient antiplatelet treatment (in our case, choosing clopidogrel rather than potent P2Y12 inhibitor). Antiplatelet therapy is the crucial treatment for ACS patients.[24] Potent P2Y12 inhibitors had a class I recommendation than clopidogrel for antiplatelet therapy according to the 2017 ESC focused update on dual antiplatelet therapy in coronary artery disease.[25] Evaluating bleeding risk is crucial for the choice of P2Y12 inhibitors and in-hospital haemoglobin drop is usually considered as a risk factor for bleeding events.[5,6] Previous study showed ticagrelor or prasugrel are more effective than clopidogrel at reducing ischemic events for ACS patients accompanied with an increased risk for bleeding events which may result in conservative choice of P2Y12 inhibitors.[26,27] While a study using data from the RENAMI registry suggested that the careful use of potent P2Y12 inhibitor in ACS patients with anemia did not increase the risk for bleeding.[28] Our study found that < 3 g/dL haemoglobin drop is not associated with increased risk for bleeding. We believed patients with mild haemoglobin drop should receive proper antiplatelet treatment and potent P2Y12 inhibitor seems to be safe. The conflict findings may be due to the limitation of retrospective research. Further study, especially randomized controlled trails, should focus on evaluating the benefit of using potent P2Y12 inhibitor in patients with mild haemoglobin drop.
This study has several limitations that must be noted. Firstly, the study is a sub-analysis of a retrospective registry, carrying all the limitations of this type of studies. However, several analyses were performed to avoid the selective bias. Secondly, the haemoglobin drop in this study is calculated by haemoglobin levels at admission and discharge, which might not represent the worse condition but is more referable for prescription of medication at discharge. Last but not least, though we excluded patients with medical history (e.g., cancer, in-hospital bleeding) that may affect prognosis and adjusted confounding factors (e.g., multivessel disease) in our analysis, it is hard to exclude a chance/biased finding as an observational study.
In conclusion, our study confirmed the prognostic value of in-hospital haemoglobin drop, which was associated with a greater frequency of adverse outcome in ACS patients. Reduced prescription for potent P2Y12 inhibitors may be responsible for poor prognosis among patients with mild haemoglobin drop. Dedicated trials warranted to investigate the optimal antiplatelet strategy in ACS patients with mild hemoglobin drop with the best risk and benefits ratio.
The authors sincerely acknowledge all participating hospitals for their contributions to the BleeMACS project. All authors had no conflicts of interest to disclose.
| [1] |
Rao SV, Eikelboom JA, Granger CB, et al. Bleeding and blood transfusion issues in patients with non-ST-segment elevation acute coronary syndromes. Eur Heart J 2007; 28: 1193−1204. doi: 10.1093/eurheartj/ehm019
|
| [2] |
Eikelboom JW, Mehta SR, Anand SS, et al. Adverse impact of bleeding on prognosis in patients with acute coronary syndromes. Circulation 2006; 114: 774−782. doi: 10.1161/CIRCULATIONAHA.106.612812
|
| [3] |
Rao SV, O’Grady K, Pieper KS, et al. Impact of bleeding severity on clinical outcomes among patients with acute coronary syndromes. Am J Cardiol 2005; 96: 1200−1206. doi: 10.1016/j.amjcard.2005.06.056
|
| [4] |
Manoukian SV, Feit F, Mehran R, et al. Impact of major bleeding on 30-day mortality and clinical outcomes in patients with acute coronary syndromes: an analysis from the ACUITY trial. J Am Coll Cardiol 2007; 49: 1362−1368. doi: 10.1016/j.jacc.2007.02.027
|
| [5] |
Stone GW, Bertrand M, Colombo A, et al. Acute Catheterization and Urgent Intervention Triage strategY (ACUITY) trial: study design and rationale. Am Heart J 2004; 148: 764−775. doi: 10.1016/j.ahj.2004.04.036
|
| [6] |
Antman EM, Cohen M, Bernink PJ, et al. The TIMI risk score for unstable angina/non-ST elevation MI: a method for prognostication and therapeutic decision making. JAMA 2000; 284: 835−842. doi: 10.1001/jama.284.7.835
|
| [7] |
Mehran R, Rao SV, Bhatt DL, et al. Standardized bleeding definitions for cardiovascular clinical trials: a consensus report from the Bleeding Academic Research Consortium. Circulation 2011; 123: 2736−2747. doi: 10.1161/CIRCULATIONAHA.110.009449
|
| [8] |
Previsdomini M, Stocker R, Corti R, et al. Time course of hemoglobin concentrations in the intensive care unit in nonbleeding patients with acute coronary syndrome. Am J Cardiol 2007; 100: 579−582. doi: 10.1016/j.amjcard.2007.03.065
|
| [9] |
Nabais S, Gaspar A, Costa J, et al. Prognostic impact of hemoglobin drop during hospital stay in patients with acute coronary syndromes. Rev Port Cardiol 2009; 28: 383−395.
|
| [10] |
Leonardi S, Gragnano F, Carrara G, et al. Prognostic implications of declining hemoglobin content in patients hospitalized with acute coronary syndromes. J Am Coll Cardiol 2021; 77: 375−388. doi: 10.1016/j.jacc.2020.11.046
|
| [11] |
Ndrepepa G, Neumann FJ, Menichelli M, et al. Prognostic value of haemoglobin drop in patients with acute coronary syndromes. Eur J Clin Invest 2021; 51: e13670. doi: 10.1111/eci.13670
|
| [12] |
Wang TY, Xiao L, Alexander KP, et al. Antiplatelet therapy use after discharge among acute myocardial infarction patients with in-hospital bleeding. Circulation 2008; 118: 2139−2145. doi: 10.1161/CIRCULATIONAHA.108.787143
|
| [13] |
D’Ascenzo F, Abu-Assi E, Raposeiras-Roubín S, et al. BleeMACS: rationale and design of the study. J Cardiovasc Med (Hagerstown) 2016; 17: 744−749. doi: 10.2459/JCM.0000000000000362
|
| [14] |
Hasin T, Sorkin A, Markiewicz W, et al. Prevalence and prognostic significance of transient, persistent, and new-onset anemia after acute myocardial infarction. Am J Cardiol 2009; 104: 486−491. doi: 10.1016/j.amjcard.2009.03.066
|
| [15] |
Aronson D, Suleiman M, Agmon Y, et al. Changes in haemoglobin levels during hospital course and long-term outcome after acute myocardial infarction. Eur Heart J 2007; 28: 1289−1296. doi: 10.1093/eurheartj/ehm013
|
| [16] |
Salisbury AC, Amin AP, Reid KJ, et al. Hospital-acquired anemia and in-hospital mortality in patients with acute myocardial infarction. Am Heart J 2011; 162: 300−309.e3. doi: 10.1016/j.ahj.2011.05.021
|
| [17] |
Mahendiran T, Nanchen D, Gencer B, et al. Prognosis of patients with chronic and hospital-acquired anaemia after acute coronary syndromes. J Cardiovasc Transl Res 2020; 13: 618−628. doi: 10.1007/s12265-019-09934-w
|
| [18] |
Salisbury AC, Alexander KP, Reid KJ, et al. Incidence, correlates, and outcomes of acute, hospital-acquired anemia in patients with acute myocardial infarction. Circ Cardiovasc Qual Outcomes 2010; 3: 337−346. doi: 10.1161/CIRCOUTCOMES.110.957050
|
| [19] |
Anand I, McMurray JJ, Whitmore J, et al. Anemia and its relationship to clinical outcome in heart failure. Circulation 2004; 110: 149−154. doi: 10.1161/01.CIR.0000134279.79571.73
|
| [20] |
O’Riordan E, Foley RN. Effects of anaemia on cardiovascular status. Nephrol Dial Transplant 2000; 15: S19−S22. doi: 10.1093/oxfordjournals.ndt.a027971
|
| [21] |
Olivetti G, Quaini F, Lagrasta C, et al. Myocyte cellular hypertrophy and hyperplasia contribute to ventricular wall remodeling in anemia-induced cardiac hypertrophy in rats. Am J Pathol 1992; 141: 227−239.
|
| [22] |
Mamas MA, Kwok CS, Kontopantelis E, et al. Relationship between anemia and mortality outcomes in a national acute coronary syndrome cohort: insights from the UK Myocardial Ischemia National Audit Project registry. J Am Heart Assoc 2016; 5: e003348. doi: 10.1161/JAHA.116.003348
|
| [23] |
Silvain J, Abtan J, Kerneis M, et al. Impact of red blood cell transfusion on platelet aggregation and inflammatory response in anemic coronary and noncoronary patients: the TRANSFUSION-2 study (impact of transfusion of red blood cell on platelet activation and aggregation studied with flow cytometry use and light transmission aggregometry). J Am Coll Cardiol 2014; 63: 1289−1296. doi: 10.1016/j.jacc.2013.11.029
|
| [24] |
Amsterdam EA, Wenger NK, Brindis RG, et al. 2014 AHA/ACC guideline for the management of patients with non-ST-elevation acute coronary syndromes: executive summary: a report of the American College of Cardiology/American Heart Association Task Force on Practice Guidelines. Circulation 2014; 130: 2354−2394. doi: 10.1161/CIR.0000000000000133
|
| [25] |
Valgimigli M, Bueno H, Byrne RA, et al. 2017 ESC focused update on dual antiplatelet therapy in coronary artery disease developed in collaboration with EACTS: the task force for dual antiplatelet therapy in coronary artery disease of the European Society of Cardiology (ESC) and of the European Association for Cardio-Thoracic Surgery (EACTS). Eur Heart J 2018; 39: 213−260. doi: 10.1093/eurheartj/ehx419
|
| [26] |
Peyracchia M, Saglietto A, Biolè C, et al. Efficacy and safety of clopidogrel, prasugrel and ticagrelor in ACS patients treated with PCI: a propensity score analysis of the RENAMI and BleeMACS registries. Am J Cardiovasc Drugs 2020; 20: 259−269. doi: 10.1007/s40256-019-00373-1
|
| [27] |
Jacobsen MR, Engstrøm T, Torp-Pedersen C, et al. Clopidogrel, prasugrel, and ticagrelor for all-comers with ST-segment elevation myocardial infarction. Int J Cardiol 2021; 342: 15−22. doi: 10.1016/j.ijcard.2021.07.047
|
| [28] |
Guerrero C, Garay A, Ariza-Solé A, et al. Anemia in patients with acute coronary syndromes treated with prasugrel or ticagrelor: insights from the RENAMI registry. Thromb Res 2018; 167: 142−148. doi: 10.1016/j.thromres.2018.05.024
|
Figures(3) / Tables(4)
Supported by: Beijing Renhe Information Technology Co., Ltd. 
| Variables | Non-drop group (n = 1962) | Mild drop group (n = 4567) | Severe drop group (n = 382) | P-value |
| Haemoglobin at admission, g/dL | 13.39 ± 1.74 | 14.17 ± 1.61 | 15.29 ± 1.58 | < 0.001 |
| Haemoglobin at discharge, g/dL | 13.99 ± 4.03 | 13.02 ± 1.62 | 11.44 ± 1.87 | < 0.001 |
| Demographics | ||||
| Age, yrs | 63.17 ± 12.69 | 64.59 ± 12.78 | 65.90 ± 12.57 | < 0.001 |
| Male | 1560 (79.5%) | 3570 (78.2%) | 293 (76.7%) | 0.331 |
| Medical history | ||||
| Diabetes mellitus | 511 (26.0%) | 1212 (26.5%) | 115 (30.1%) | 0.256 |
| Hypertension | 1155 (58.9%) | 2718 (59.5%) | 236 (61.8%) | 0.565 |
| Dyslipidemia | 1025 (52.2%) | 2269 (49.7%) | 188 (49.2%) | 0.148 |
| Peripheral artery disease | 106 (5.4%) | 336 (7.4%) | 34 (8.9%) | 0.005 |
| Prior acute myocardial infarction | 268 (13.7%) | 567 (12.4%) | 34 (8.9%) | 0.032 |
| Prior percutaneous coronary intervention | 285 (14.5%) | 560 (12.3%) | 35 (9.2%) | 0.004 |
| Prior coronary artery bypass graft | 77 (3.9%) | 173 (3.8%) | 12 (3.1%) | 0.764 |
| Prior stroke | 123 (6.3%) | 258 (5.6%) | 31 (8.1%) | 0.117 |
| Prior chronic heart failure | 59 (3.0%) | 127 (2.8%) | 12 (3.1%) | 0.834 |
| Prior bleeding | 100 (5.1%) | 166 (3.7%) | 11 (3.0%) | 0.016 |
| Diagnosis at admission | < 0.001 | |||
| Acute myocardial infarction | 1616 (82.4%) | 3952 (86.5%) | 359 (94.0%) | |
| ST-segment elevation myocardial infarction | 1004 (51.2%) | 2306 (50.5%) | 244 (63.9%) | |
| Non-ST-segment elevation myocardial infarction | 612 (31.2%) | 1646 (36.0%) | 115 (30.1%) | |
| Unstable angina | 346 (17.6%) | 615 (13.5%) | 23 (6.0%) | |
| Killip class > 2 | 220 (12.1%) | 552 (12.5%) | 100 (26.5%) | < 0.001 |
| Baseline tests | ||||
| Left ventricular ejection fraction, % | 53.7 (47.0–60.0)* | 54.5 (48.0–60.0)* | 49.8 (40.0–60.0)* | < 0.001 |
| Creatinine at admission, mg/dL | 0.9 (0.7–1.0)* | 0.9 (0.8–1.0)* | 1.0 (0.8–1.1)* | < 0.001 |
| Procedure data | ||||
| Femoral access | 859 (48.4%) | 1529 (40.2%) | 172 (49.9%) | < 0.001 |
| Multivessel | 810 (45.7%) | 1849 (48.7%) | 182 (52.8%) | 0.021 |
| Using of drug-eluting stent | 920 (46.9%) | 2307 (50.5%) | 193 (50.5%) | 0.025 |
| Percutaneous coronary intervention without stent | 51 (2.6%) | 93 (2.0%) | 23 (6.0%) | < 0.001 |
| Thrombolysis | 48 (2.4%) | 99 (2.2%) | 17 (4.5%) | 0.018 |
| Revascularization complete | 1205 (66.2%) | 2643 (62.0%) | 182 (52.1%) | < 0.001 |
| In-hospital outcomes | ||||
| In-hospital reinfarction | 15 (0.8%) | 86 (1.9%) | 12 (3.1%) | < 0.001 |
| In-hospital heart failure | 83 (4.2%) | 191 (4.2%) | 54 (14.1%) | < 0.001 |
| Medication at discharge | ||||
| Aspirin | 1950 (99.4%) | 4544 (99.5%) | 377 (98.7%) | 0.134 |
| Clopidogrel | 1465 (74.7%) | 4017 (88.0%) | 324 (84.8%) | < 0.001 |
| Ticagrelor or prasugrel | 458 (23.8%) | 492 (10.9%) | 39 (10.7%) | < 0.001 |
| Ticagrelor | 235 (12.0%) | 195 (4.3%) | 12 (3.1%) | < 0.001 |
| Prasugrel | 223 (11.4%) | 297 (6.5%) | 27 (7.1%) | < 0.001 |
| Oral anticoagulation (warfarin or dicumarinic) | 93 (4.7%) | 235 (5.1%) | 22 (5.8%) | 0.646 |
| Beta-blockers | 1624 (82.9%) | 3823 (83.8%) | 311 (81.4%) | 0.379 |
| Angiotensin-converting enzyme inhibitors/Angiotensin II receptor blockers | 1567 (79.9%) | 3664 (80.3%) | 316 (82.7%) | 0.456 |
| Statin | 1795 (91.5%) | 4321 (94.6%) | 344 (90.1%) | < 0.001 |
| Data are presented as means ± SD or n (%). *Presented as median (interquartile range). | ||||
DownLoad:
CSV
| Outcome | Non-drop group (n = 1962) | Mild drop group (n = 4567) | Severe drop group (n = 382) | P-value |
| Major adverse cardiac endpoint | 84 (4.3%) | 264 (5.8%) | 32 (8.4%) | 0.002 |
| Death | 51 (2.6%) | 151 (3.3%) | 23 (6.0%) | 0.002 |
| Reinfarction | 37 (1.9%) | 134 (2.9%) | 14 (3.7%) | 0.027 |
| Bleeding | 54 (2.8%) | 108 (2.4%) | 13 (3.4%) | 0.354 |
DownLoad:
CSV
| Outcome | Hazard ratio (95% CI) | |||||||||
| Reference | Unadjusted | Adjusted 1 | Adjusted 2 | |||||||
| Non-drop | Mild drop | Severe drop | Mild drop | Severe drop | Mild drop | Severe drop | ||||
| Major adverse cardiac endpoint | – | 1.36 (1.06–1.74) | 2.01 (1.34–3.02) | 1.36 (1.03–1.80) | 1.70 (1.07–2.68) | 1.30 (0.97–1.73) | 1.75 (1.10–2.80) | |||
| Death | – | 1.28 (0.93–1.76) | 2.36 (1.44–3.86) | 1.26 (0.86–1.85) | 2.04 (1.15–3.61) | 1.24 (0.83–1.84) | 2.18 (1.21–3.93) | |||
| Reinfarction | – | 1.56 (1.09–2.25) | 1.99 (1.08–3.69) | 1.50 (1.01–2.22) | 1.70 (0.89–3.27) | 1.39 (0.94–2.05) | 1.56 (0.80–3.04) | |||
| Bleeding | – | 0.86 (0.62–1.19) | 1.27 (0.69–2.32) | 0.92 (0.63–1.33) | 1.22 (0.61–2.46) | 0.95 (0.65–1.39) | 1.22 (0.59–2.54) | |||
| Adjusted 1: adjusted for age, female sex, diabetes mellitus, hypertension, prior acute myocardial infarction, prior percutaneous coronary intervention, prior coronary artery bypass graft, prior ischemic stroke, prior bleeding, acute coronary syndrome diagnosis at admission, Killip classification ≥ 2 at admission, femoral access, multivessel disease, using of drug-eluting stent, percutaneous coronary intervention without stent, thrombolysis, complete revascularization, prescription for aspirin, prescription for oral anticoagulation, and prescription for statin. Adjusted 2: adjusted for variables in Adjusted 1 plus prescription for potent P2Y12 inhibitors. | ||||||||||
DownLoad:
CSV
| Outcome | Adverse outcomes | Adjusted hazard ratio (95% CI) | |||||||||||
| Before PSM | After PSM | Before PSM* | After PSM** | ||||||||||
| Non-drop (n = 458) | Mild drop (n = 492) | P-value | Non-drop (n = 271) | Mild drop (n = 271) | P-value | Mild drop | P-value | Mild drop | P-value | ||||
| Major adverse cardiac endpoint | 8 (1.8%) | 19 (3.9%) | 0.051 | 5 (1.9%) | 8 (3.0%) | 0.400 | 2.28 (0.95–5.02) | 0.067 | 1.52 (0.49–4.72) | 0.466 | |||
| Death | 6 (1.3%) | 12 (2.4%) | 0.202 | 3 (1.1%) | 4 (1.5%) | > 0.999 | 2.00 (0.74–5.39) | 0.171 | 1.62 (0.50–7.39) | 0.537 | |||
| Reinfarction | 2 (0.4%) | 7 (1.4%) | 0.119 | 2 (0.7%) | 4 (1.5%) | 0.686 | 3.10 (0.64–15.02) | 0.161 | 2.20 (0.38–12.81) | 0.380 | |||
| Bleeding | 17 (3.7%) | 14 (2.8%) | 0.453 | 7 (2.6%) | 8 (3.0%) | 0.793 | 0.73 (0.46–1.49%) | 0.394 | 1.28 (0.45–3.64) | 0.641 | |||
| *Referred to variables included in the adjust model before PSM: history of peripheral artery disease, prior stroke, diagnosis at admission [acute myocardial infarction, unstable angina (referent)], left ventricle ejection fraction, using of drug-eluting stent, and in-hospital heart failure. **Referred to variables included in the adjust model after PSM: prior stroke and in-hospital heart failure. PSM: propensity score matching. | |||||||||||||
DownLoad:
CSV