Please cite this article as: Maraey A, Salem M, Dawoud N, Khalil M, Elzanaty A, Elsharnoby H, Younes A, Hashim A, Alam A. Predictors of thirty-day readmission in nonagenarians presenting with acute heart failure with preserved ejection fraction: a nationwide analysis. J Geriatr Cardiol 2021; 18(12): 1008−1018. DOI: 10.11909/j.issn.1671-5411.2021.12.005.
Citation:
Please cite this article as: Maraey A, Salem M, Dawoud N, Khalil M, Elzanaty A, Elsharnoby H, Younes A, Hashim A, Alam A. Predictors of thirty-day readmission in nonagenarians presenting with acute heart failure with preserved ejection fraction: a nationwide analysis. J Geriatr Cardiol 2021; 18(12): 1008−1018. DOI: 10.11909/j.issn.1671-5411.2021.12.005.
Please cite this article as: Maraey A, Salem M, Dawoud N, Khalil M, Elzanaty A, Elsharnoby H, Younes A, Hashim A, Alam A. Predictors of thirty-day readmission in nonagenarians presenting with acute heart failure with preserved ejection fraction: a nationwide analysis. J Geriatr Cardiol 2021; 18(12): 1008−1018. DOI: 10.11909/j.issn.1671-5411.2021.12.005.
Citation:
Please cite this article as: Maraey A, Salem M, Dawoud N, Khalil M, Elzanaty A, Elsharnoby H, Younes A, Hashim A, Alam A. Predictors of thirty-day readmission in nonagenarians presenting with acute heart failure with preserved ejection fraction: a nationwide analysis. J Geriatr Cardiol 2021; 18(12): 1008−1018. DOI: 10.11909/j.issn.1671-5411.2021.12.005.
BACKGROUD Acute heart failure with preserved ejection fraction (HFpEF) is a common but poorly studied cause of hospital admissions among nonagenarians. This study aimed to evaluate predictors of thirty-day readmission, in-hospital mortality, length of stay, and hospital charges in nonagenarians hospitalized with acute HFpEF.
METHODS Patients hospitalized between January 2016 and December 2018 with a primary diagnosis of diastolic heart failure were identified using ICD-10 within the Nationwide Readmission Database. We excluded patients who died in index admission, and discharged in December each year to allow thirty-day follow-up. Univariate regression was performed on each variable. Variables with P-value < 0.2 were included in the multivariate regression model.
RESULTS From a total of 45,393 index admissions, 43,646 patients (96.2%) survived to discharge. A total of 7,437 patients (15.6%) had a thirty-day readmission. Mean cost of readmission was 43,265 United States dollars (USD) per patient. Significant predictors of thirty-day readmission were chronic kidney disease stage III or higher [adjusted odds ratio (aOR) = 1.20, 95% CI: 1.07−1.34, P = 0.002] and diabetes mellitus (aOR = 1.18, 95% CI: 1.07−1.29, P = 0.001). Meanwhile, female (aOR = 0.90, 95% CI: 0.82−0.99, P = 0.028) and palliative care encounter (aOR = 0.27, 95% CI: 0.21−0.34, P < 0.001) were associated with lower odds of readmission. Cardiac arrhythmia (aOR = 1.46, 95% CI: 1.11−1.93, P = 0.007) and aortic stenosis (aOR = 1.36, 95% CI: 1.05−1.76, P = 0.020) were amongst predictors of in-hospital mortality.
CONCLUSIONS In nonagenarians hospitalized with acute HFpEF, thirty-day readmission is common and costly. Chronic comorbidities predict poor outcomes. Further strategies need to be developed to improve the quality of care and prevent the poor outcome in nonagenarians.
By 2030, it is estimated that one every thirty-three patients will have the diagnosis of heart failure (HF). The projected cost estimates of treating HF are 160 billion United States dollars (USD) in direct costs. Because of the aging of the population, greater increase in HF prevalence will be seen in older adults. It is projected that the number of patients > 80 years with HF will grow by 66% by 2030.[1]
HF incidence and prevalence rise dramatically with age due to structural and functional alterations in the cardiovascular system, making HF the most prevalent cardiovascular disease among elderly. HF was reported to be the second leading cause of hospitalization for patients aged 75 years and above from 2013 to 2018.[2]
Most elderly patients with HF have impaired left ventricular diastolic function without significant impairment in left ventricular systolic function, which is called heart failure with preserved ejection fraction (HFpEF).[3–6] Increased levels of brain natriuretic peptide, older age, myocardial infarction history, and reduced diastolic function make the prognosis of HFpEF worse.[7–9]
Over the years, there have been advances in the treatment of HF, however, the mortality, hospitalization, and readmission rates are still high.
In this study, we aimed to assess the predictors and causes of readmissions with acute HFpEF among nonagenarians in the United States, by using the National Readmission Database (NRD).
METHODS
Data Source
This is a retrospective cohort study using the Agency for Healthcare Research and Quality’s Healthcare Cost and Utilization Project (HCUP) NRD from January 2016 to December 2018.[10] The NRD is the largest publicly available all-payer inpatient health care readmission database in the United States. The NRD is drawn from HCUP State Inpatient Databases containing verified patient linkage numbers that can be used to track a person across hospitals within a State, while adhering to strict privacy guidelines. Unweighted, the NRD contains data from approximately 18 million discharges in the United States each year. Weighted, it estimates roughly 35 million discharges in the United States each year.
The NRD contains both patient and hospital-level information. Up to forty discharge diagnoses and twenty-five procedures are collected for each patient using the International Classification of Diseases, Tenth Revision, Clinical Modification (ICD-10-CM). Patients were tracked during the same year using the variable “nrd_visitlink”, and time between two admissions was calculated using variable “nrd_daystoevent”. National estimates were produced using sampling weights provided by the sponsor. All values presented are weighted estimates.
Study Population
Our study population was patients aged 90 years and above admitted between January 2016 and December 2018 with a primary diagnosis of diastolic HF (ICD-10 codes: I50.30, I50.31, and I50.33). Unfortunately, no ICD codes exclusively existed for HFpEF for our patient population. We excluded patients with systolic failure or combined systolic/diastolic HF, and patients who were discharged in December each year to allow thirty-day follow-up. Patients who died in index admission were excluded from evaluating readmission outcomes but included in other secondary outcomes pertaining to index admission only.
NRD variables were used to identify patients and hospital characteristics. Patient characteristics included age, gender, median household income, and primary insurance. Hospital characteristics included hospital bed size and teaching status. ICD-10 codes used in our analysis are included in Table 1.
Table
1.
The ICD-10-CM used to identify key variables.
In accordance with the HCUP data use agreement, we excluded any variable containing a small number of observations (≤ 10) that could pose risk of person identification or data privacy violation.
Missing Data
Data on median household income and primary insurance were missing in 1.09% and 0.06% of hospitalizations, respectively. Other key variables had no missing values. In-hospital mortality and total charges outcomes were missing in 0.06% and 1.54% of hospitalizations, respectively. All hospitalizations with missing values were excluded from our analysis.
Study Outcomes
Primary outcome was thirty-day readmission. Secondary outcomes were in-hospital mortality, length of stay (LOS), and total hospital charges in index admission. In-hospital morality, LOS, and total hospital charges were directly coded in NRD.
Index admission was defined as the first admission with the primary diagnosis of diastolic HF without prior admission in the thirty-day period. A readmission was defined as any readmission within thirty days of the index admission. For patients who were readmitted multiple times during the thirty-day post admission, only the first readmission was included.
Statistical Analysis
Data analysis was performed using STATA 17.0 (StataCorp, College Station, Texas, USA). Data were expressed as a percentage for categorical variables and mean ± SD for continuous variables. Univariate regression analysis was used to calculate unadjusted odds ratio for the primary and secondary outcomes. Multivariate regression analysis was used to adjust for the potential confounders and calculate adjusted odds ratio (aOR). A logistic regression model was used for binary outcome and linear regression for continuous outcome. The models were built by including the variables that were associated with the outcome of interest on univariable regression analysis with a cut-off P-value of 0.20. Continuous variables were compared using the independent Student’s t-test and categorical variables were compared using the Pearson’s chi-squared test. All statistical tests were two-sided, and P-value < 0.05 was considered statistically significant.
RESULTS
Patient Characteristics
From 107 million discharges included in NRD from January 2016 to December 2018, our cohort included 45,393 index admissions of whom 43,646 patients (96.2%) survived to discharge. A total of 7,437 patients were readmitted in thirty-day period post discharge from index hospitalization. Baseline characteristics were stratified according to readmission status.
Female constituted 70.3% of readmitted patients. Medicare was the primary insurance in both groups (P = 0.042). Patients who were readmitted were more likely to have chronic ischemic heart disease (40.8% vs. 36.8%, P < 0.001), chronic kidney disease (CKD) stage III or higher (21.8% vs. 16.8%, P < 0.001), chronic pulmonary disease (33.2% vs. 29.8%, P < 0.001), diabetes mellitus (25.6% vs. 21.6%, P < 0.001), and hypertension (77.7% vs. 75.2%, P = 0.002). Readmitted patients had less palliative care encounter (2.3% vs. 7.8%, P < 0.001). Other patient and hospital characteristics are included in Table 2.
Table
2.
Baseline characteristics according to readmission status.
Characteristics
Thirty-day readmission
P-value
No readmission (n = 36,209)
Readmission (n = 7,437)
Female
26,470 (73.1%)
5,226 (70.3%)
0.001
Median household income quartile for zip code in percentile
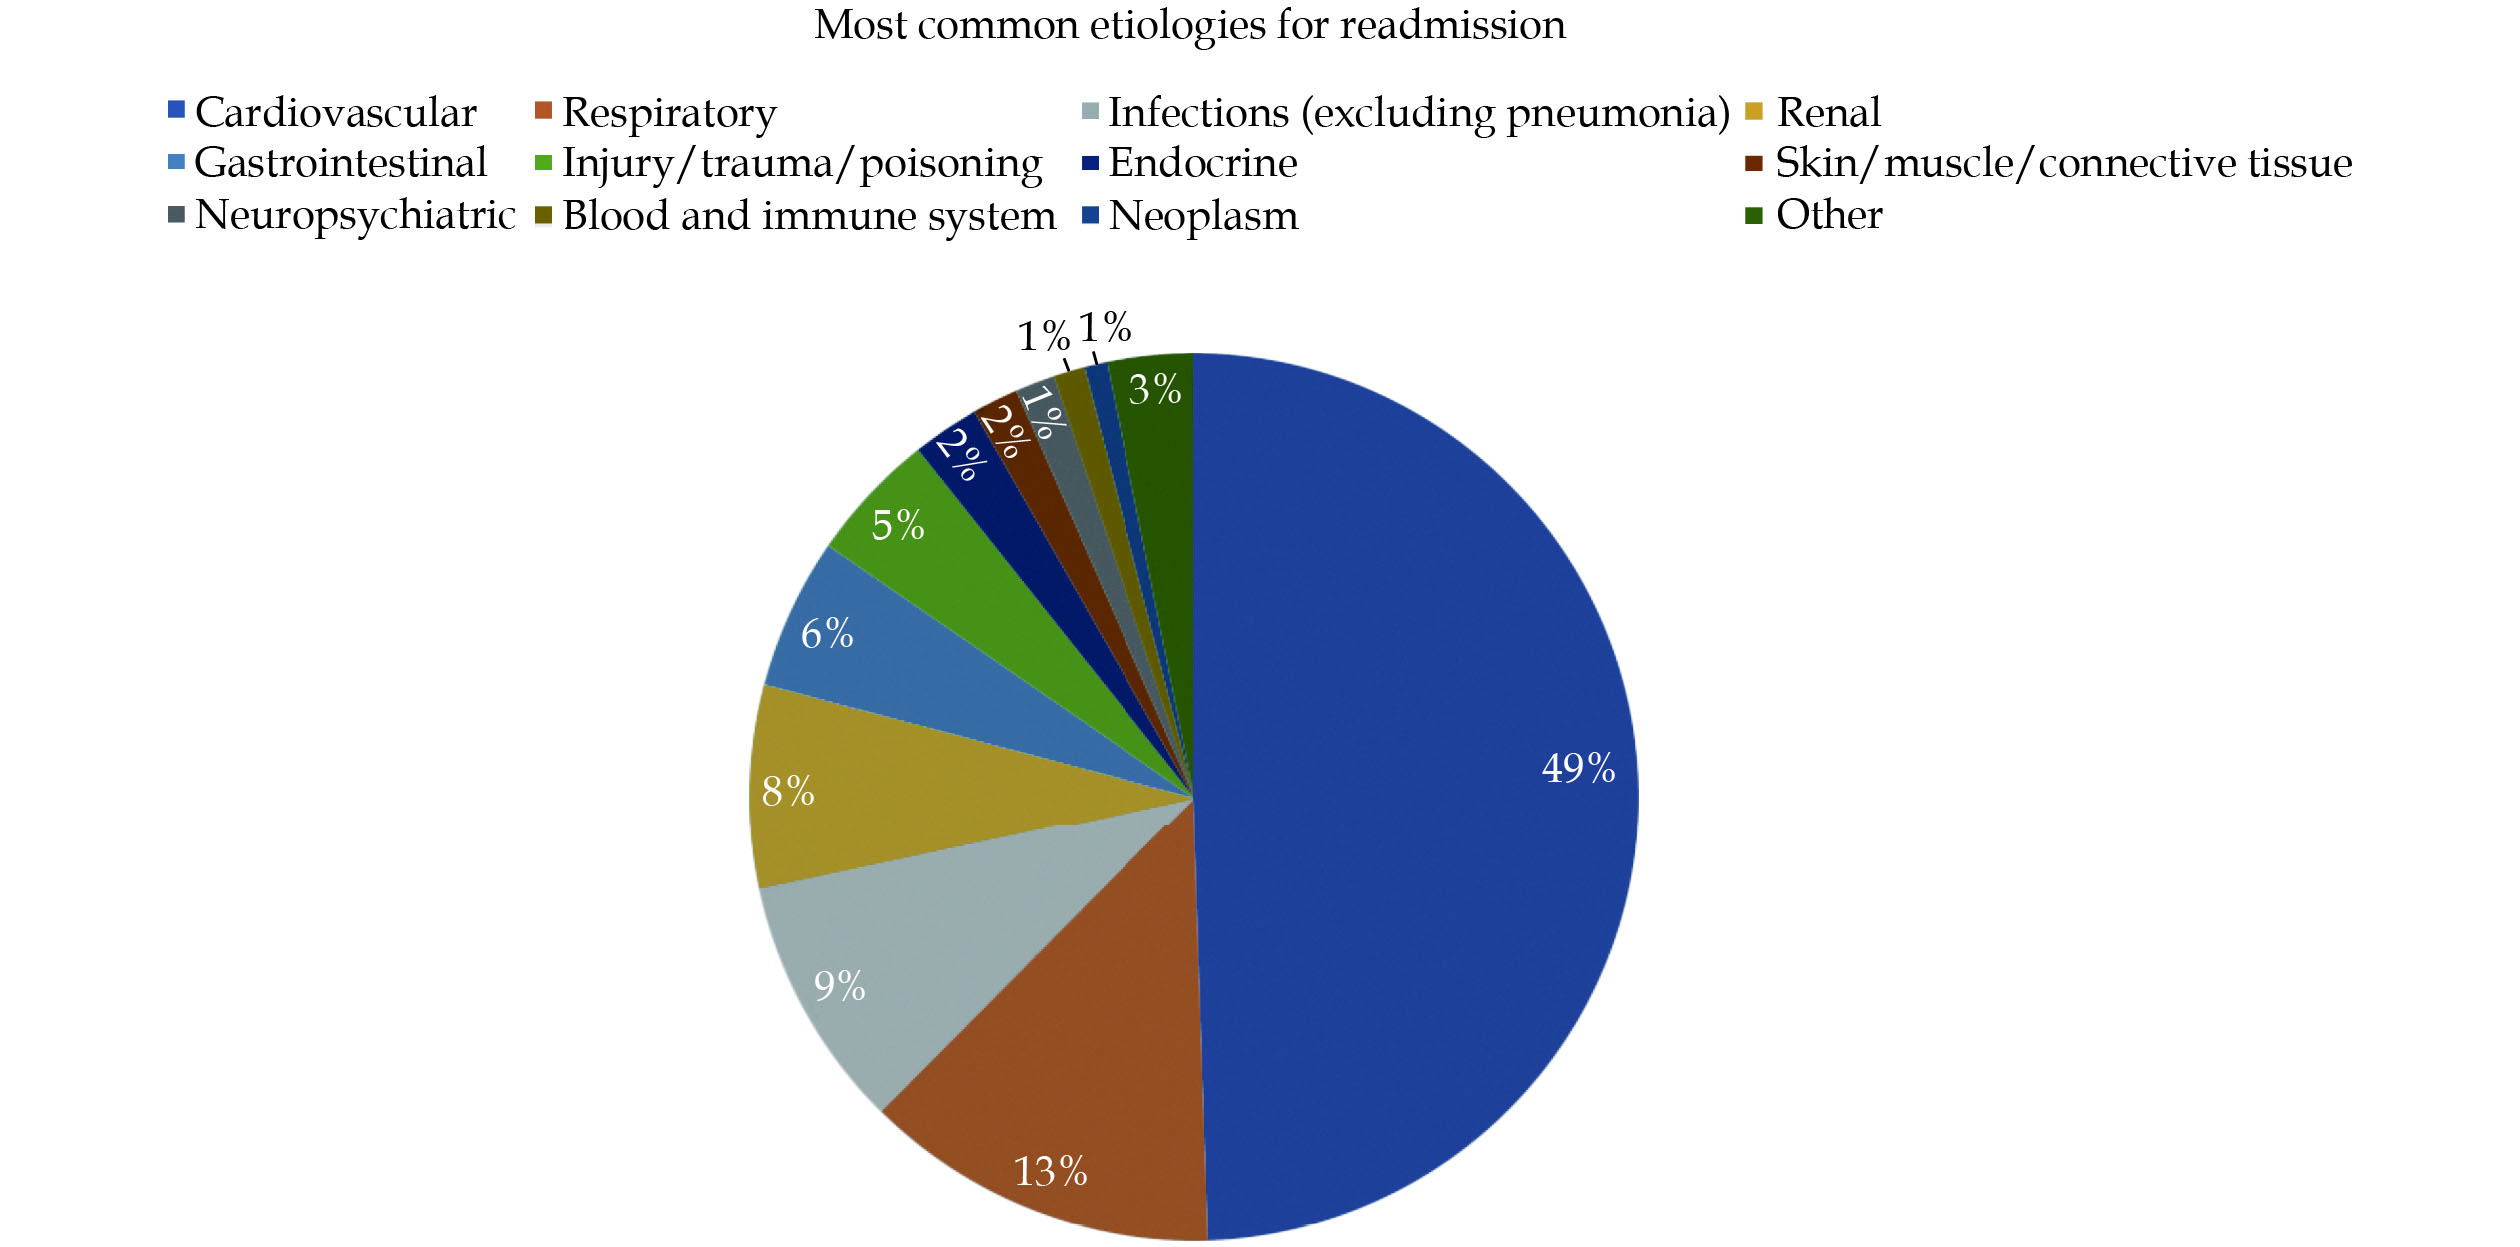
Of 43,646 patients who survived to discharge from index admission, 7,437 patients (17.0%) were readmitted within thirty days. Of those readmitted, 24 patients (0.32%) were discharged to a nursing facility. The mean cost of readmission was 43,265 USD per patient. Mean LOS of readmission was 5.46 days. Readmission due to cardiovascular etiologies constituted 49% of all readmissions followed by respiratory etiologies (13%) and infectious etiologies (9%). The most common specific causes of readmission were HF (37%) followed by sepsis (8%) and pneumonia (6%). Etiologies of readmission are presented in Figure 1.
Mean LOS in our cohort was 4.72 days in index admission. Teaching hospital and large hospital size were associated with mean increased LOS of 0.29 days, and 0.44 days, respectively. Palliative care encounter was similarly associated with mean increased LOS of 0.79 days. Other patient characteristics such as chronic ischemic heart disease, CKD stage III or higher, pulmonary hypertension, chronic pulmonary disease, weight loss, were independently associated with mean increased LOS. All differences mentioned above were statistically significant (P < 0.05) (Table 5).
Table
5.
Predictors of increased length of stay outcome.
Predictor
Coefficient
95% CI
P−value
Lower limit
Upper limit
Admission in weekend
−0.1815489
−0.2946481
−0.0684497
0.002
Hospital bed size
Large
0.4448497
0.2913729
0.5983266
< 0.001
Median household income quartile for zip code in percentile
Mean total hospital charges in our cohort was 32,554 USD in index admission. Size of the hospital (moderate and large) and teaching hospitals were independent predictors of increased cost of hospitalization. Medicaid insurance and palliative care encounter were similarly associated with increased cost. Other patient characteristics such as CKD stage III or higher, cardiac arrhythmias, pulmonary circulation disorders, peripheral vascular disorders, liver disease, fluid and electrolyte disorders, blood loss anemia, and aortic stenosis were amongst predictors of increased hospitalization cost (Table 6).
Table
6.
Predictors of total hospital charges outcome.
Predictor
Coefficient
95% CI
P−value
Lower limit
Upper limit
Medicare insurance
15,215.58
6,895.664
23,535.5
< 0.001
Hospital bed size
Small
Reference
Reference
Reference
Medium
4,446.771
2,346.773
6,546.77
< 0.001
Large
11,161.2
8,971.176
13,351.23
< 0.001
Median household income quartile for zip code in percentile
Patients above the age of 85 years constitute more than 9% of patients admitted to hospitals in the United States.[11] Hospitalizations and health care spending for elderly are expected to rise as the population continues to age. Disease-specific interventions are not well studied in elderly population.[12] Several studies have documented predictors of readmission of HF in the general population.[13–17] However, few small studies evaluated HF in general or HFpEF in elderly population.[18,19] Our study is the largest and first to report data exclusively in nonagenarians presenting with HFpEF.
In our analysis, we identified several independent predictors of readmission, in-hospital mortality, increased LOS, and total hospital costs in nonagenarians presenting with acute or acute on chronic HFpEF.
We observed a 17% thirty-day readmission rate in HFpEF nonagenarian population, which was comparable to other previous studies that documented thirty-day readmission rates from 18% to 25%.[15,20–22] Cardiovascular etiologies were responsible for 49% of readmissions, particularly HF (37%), followed by pulmonary etiologies (17%), pneumonia (6%), infectious etiologies (9%), and renal etiologies (7%). General etiologies of readmissions were similar to a study done by Arora, et al.[20] However, a higher percentage of HF readmissions was observed in our analysis which was done exclusively in nonagenarians. Our population had a high burden of chronic comorbidities, which likely have impacted readmission outcomes. We found chronic ischemic heart disease, CKD stage III or higher, chronic pulmonary disease, and diabetes mellitus to be independent predictors of readmission in nonagenarians. Although females constituted the majority of our cohort (72.6%), female was associated with less readmission odds, which was observed by Stolfo, et al.[23] in a prior study. In contrast to a prior study done using NRD,[20] blood loss anemia, packed red blood cells transfusion, and discharge to a nursing facility were not found to be independent predictors of readmission in nonagenarians. LOS greater than two days in index admission predicted readmission. This could be explained by the higher comorbidity burden in this age group. Our study demonstrated the strong impact of palliative care encounter on prevention of future readmission although it was poorly utilized (only 6.9% of our cohort received palliative care service). This finding could open avenues for palliative care utilization in this age group with emphasis on quality of life rather than quantity.
In-hospital mortality rate in index admission was 3.8% in our cohort, which is close to average mortality in hospitalized patients aged 75 years and higher (4.3%−4.6%).[24]
Compared to readmission predictors, chronic comorbidities such as cardiac arrhythmias, aortic stenosis, liver disease, pulmonary circulatory disorders, and CKD stage III or higher were independently associated with increased odds of in-hospital mortality. Interestingly, dyslipidemia and history of percutaneous coronary intervention were associated with lower odds of in-hospital mortality, which was thought to be due to prescribed statins and other goal-directed medical therapy for coronary artery disease. However, Organized Program to Initiate Lifesaving Treatment in Hospitalized Patients with Heart Failure (The OPTIMIZE-HF) study on 48,612 hospitalized patients with acute HF showed similar results regarding hyperlipidemia despite that only 66% of patients diagnosed with hyperlipidemia were on statins or other lipid lowering therapy.[16]
Chronic comorbidities were also identified as predictors of increased LOS and total hospital charges such as hypertension, diabetes mellitus, and chronic pulmonary disease. Blood transfusion was associated with increased LOS and increased total hospital charges, but it did not affect readmission nor in-hospital mortality outcomes. Readmission within thirty days was more costly on average compared to index admission (mean cost: 43,265 USD vs. 32,554 USD), which is likely due to increased LOS in the readmitted cohort (mean LOS: 5.46 days vs. 4.72 days). It is worth mentioning that discharge to nursing facilities was higher in the second admission compared to the index admission (0.32% vs. 0.15%, P = 0.29), which probably added to the overall health care cost.
LIMITATIONS
Our study has certain limitations. Firstly, NRD uses ICD codes for diagnosis, which is subject to coding errors. Secondly, the differentiation between volume overload due to HFpEF and advanced CKD can be challenging. Both conditions often co-exist, and we are unable to differentiate between the primary disease processes driving the hospitalization. The primary outcome of our study is the rate of thirty-day readmission post-discharge and in-hospital mortality may be a competing risk endpoint, particularly in this age group, thus assessing the composite endpoint of thirty-day readmission or death would be an area of future research. We cannot identify patients who may have expired without being re-hospitalized in our database. The information pertaining to the longitudinal follow-up of patients, information related to race, ethnicity, individual operator, and procedure level is also not available in the NRD. Moreover, factors influencing patient prognosis such as medications and echocardiography findings such as diastolic grading are absent. Last but not least, the study was retrospective, which is subject to confounding bias not typically seen in prospective trials.
CONCLUSIONS
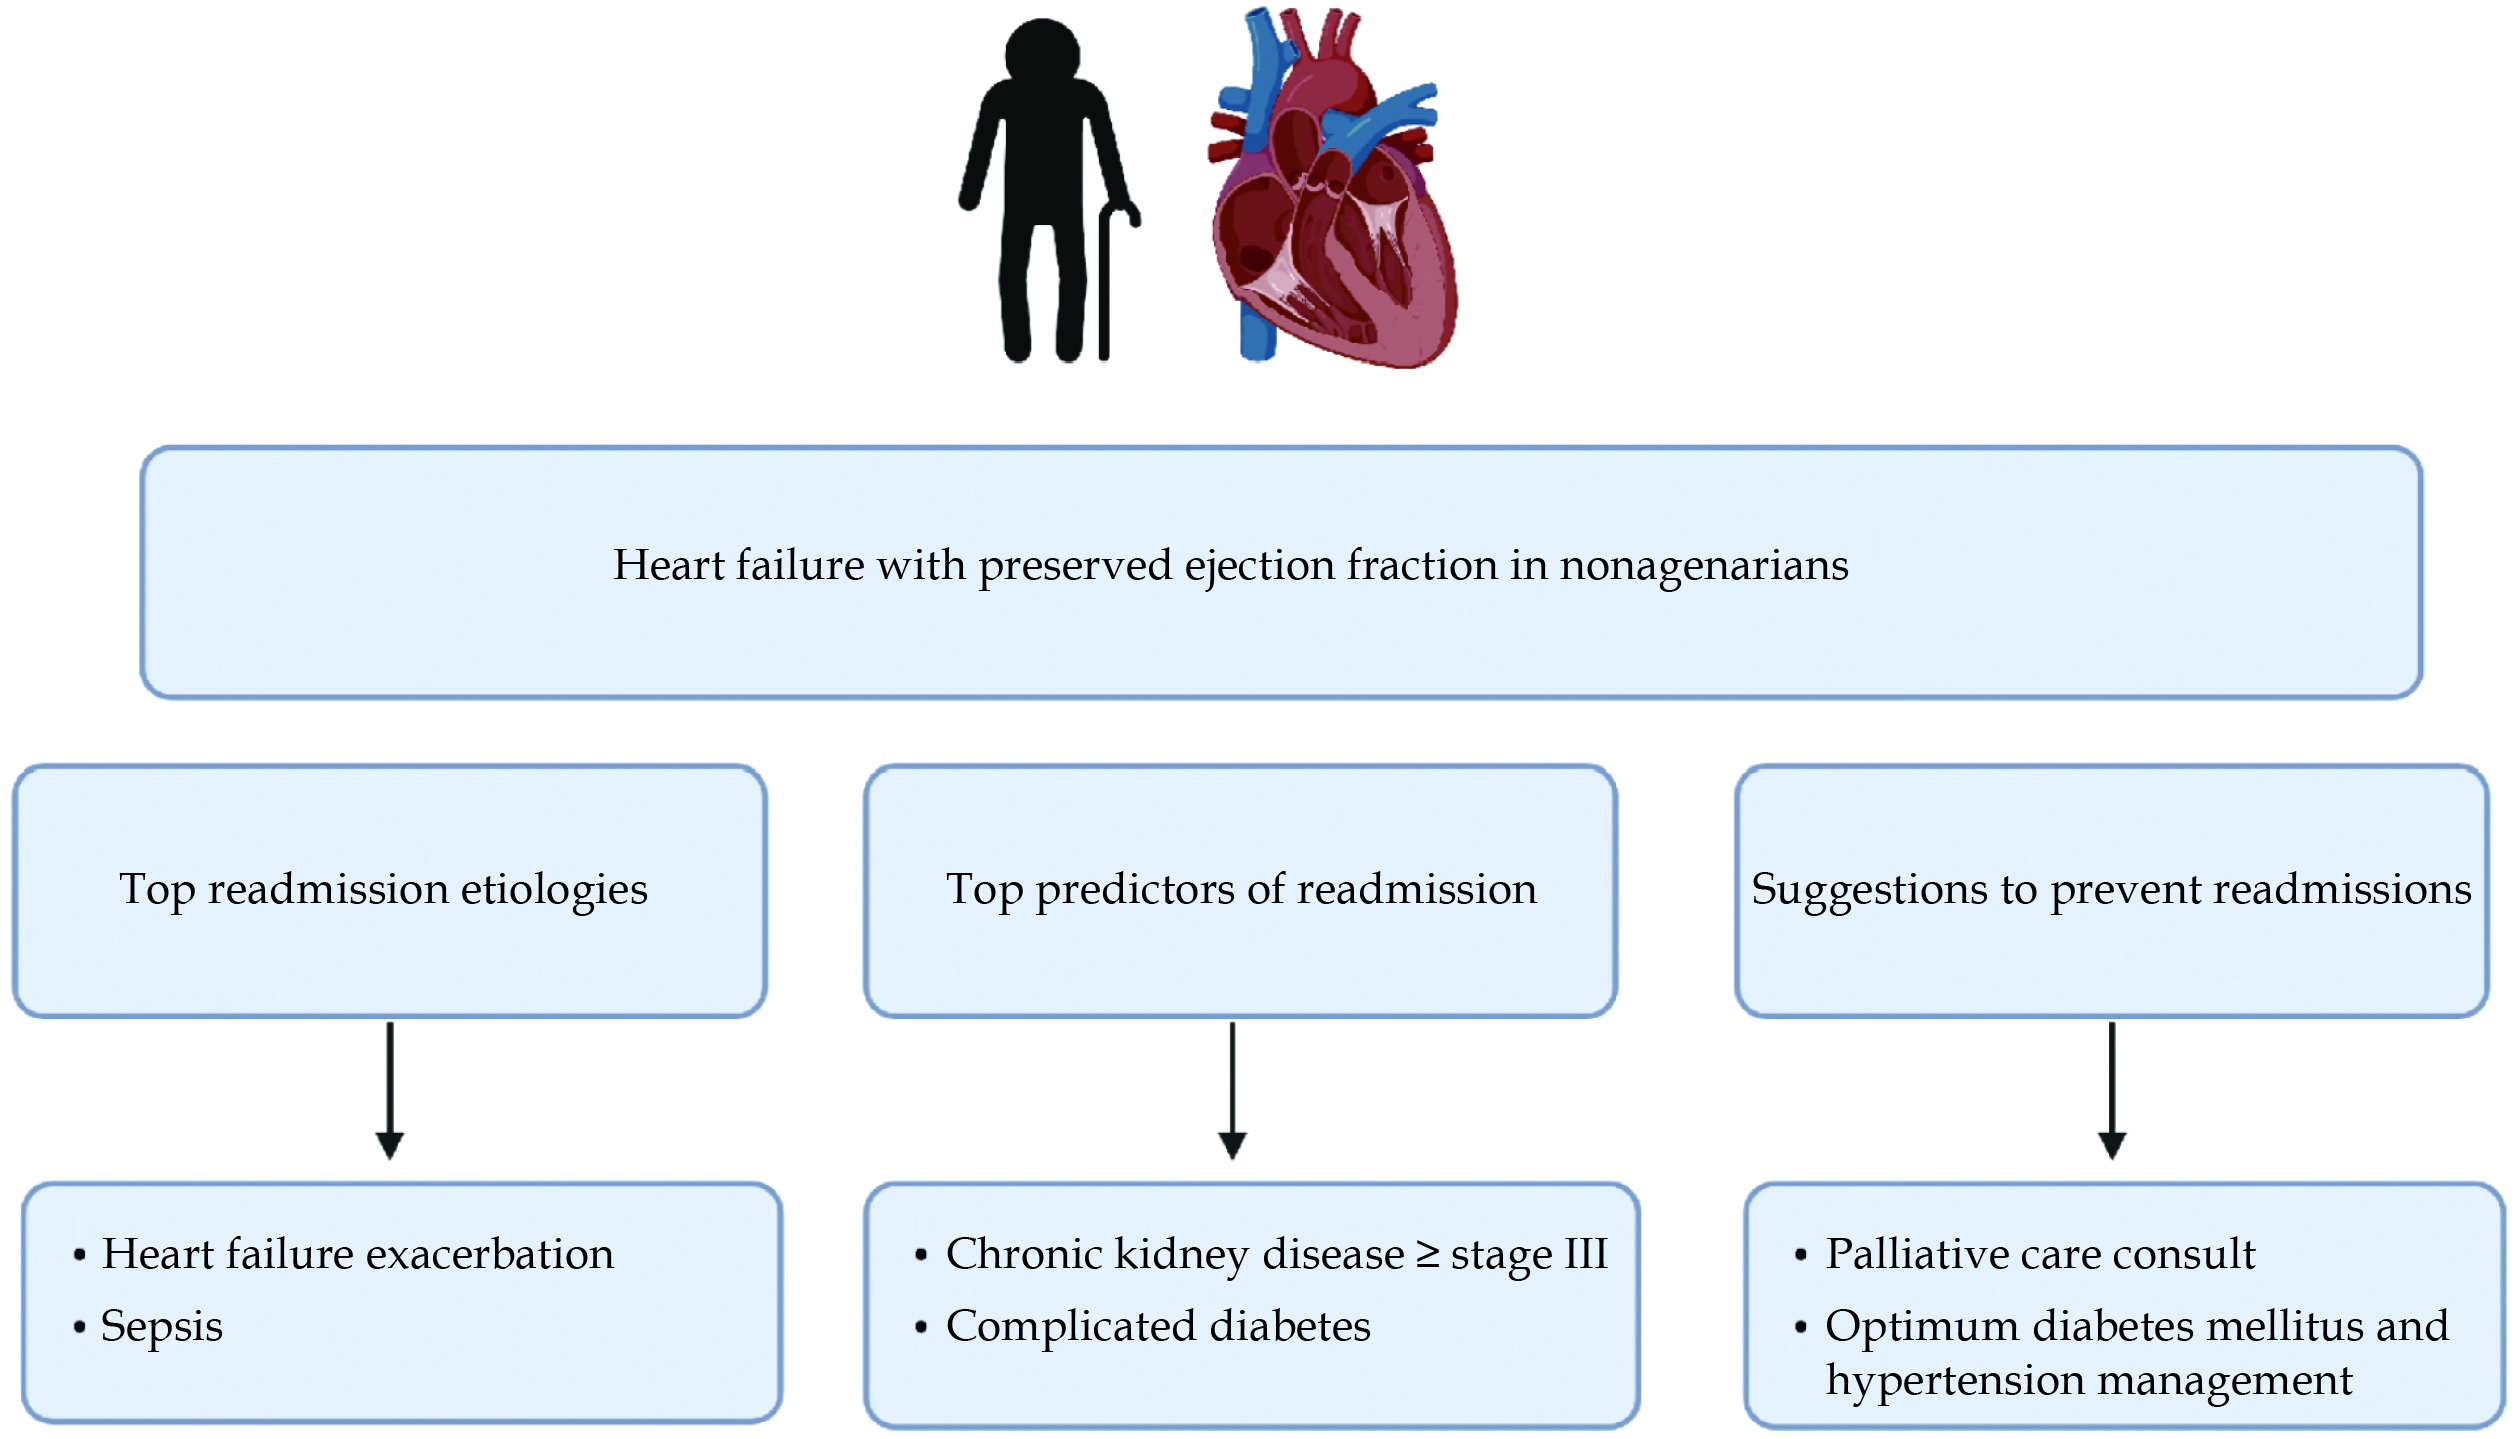
We identified several predictors of thirty-day readmissions, in-hospital mortality, increased LOS, and hospitalization cost amongst nonagenarians admitted with HFpEF. Having knowledge of these predictors should help guide further strategies targeting reduction of readmissions, decreasing healthcare costs, and improving the quality of care patients receive (Figure 2).
ACKNOWLEDGMENTS
All authors had no conflicts of interest to disclose.
Heidenreich PA, Albert NM, Allen LA, et al. Forecasting the impact of heart failure in the United States: a policy statement from the American Heart Association. Circ Heart Fail 2013; 6: 606−619. doi: 10.1161/HHF.0b013e318291329a
Gaasch WH, Zile MR. Left ventricular diastolic dysfunction and diastolic heart failure. Annu Rev Med 2004; 55: 373−394. doi: 10.1146/annurev.med.55.091902.104417
[4]
Redfield MM, Jacobsen SJ, Burnett JC Jr, et al. Burden of systolic and diastolic ventricular dysfunction in the community: appreciating the scope of the heart failure epidemic. JAMA 2003; 289: 194−202. doi: 10.1001/jama.289.2.194
[5]
Zile MR, Baicu CF, Gaasch WH. Diastolic heart failure: abnormalities in active relaxation and passive stiffness of the left ventricle. N Engl J Med 2004; 350: 1953−1959. doi: 10.1056/NEJMoa032566
[6]
Zile MR, Brutsaert DL. New concepts in diastolic dysfunction and diastolic heart failure: Part I: diagnosis, prognosis, and measurements of diastolic function. Circulation 2002; 105: 1387−1393. doi: 10.1161/hc1102.105289
[7]
Komajda M, Carson PE, Hetzel S, et al. Factors associated with outcome in heart failure with preserved ejection fraction: findings from the Irbesartan in Heart Failure with Preserved Ejection Fraction Study (I-PRESERVE). Circ Heart Fail 2011; 4: 27−35. doi: 10.1161/CIRCHEARTFAILURE.109.932996
[8]
Cleland JG, Swedberg K, Follath F, et al. The EuroHeart Failure survey programme: a survey on the quality of care among patients with heart failure in Europe. Part 1: patient characteristics and diagnosis. Eur Heart J 2003; 24: 442−463. doi: 10.1016/s0195-668x(02)00823-0
[9]
Burke MA, Katz DH, Beussink L, et al. Prognostic importance of pathophysiologic markers in patients with heart failure and preserved ejection fraction. Circ Heart Fail 2014; 7: 288−299. doi: 10.1161/CIRCHEARTFAILURE.113.000854
[10]
Agency for Healthcare Research and Quality. Overview of the Nationwide Readmissions Database (NRD) Web site. https://www.hcup-us.ahrq.gov/nrdoverview.jsp (accessed June 8, 2021).
Landefeld CS. Care of hospitalized older patients: opportunities for hospital-based physicians. J Hosp Med 2006; 1: 42−47. doi: 10.1002/jhm.11
[13]
Bhatia RS, Tu JV, Lee DS, et al. Outcome of heart failure with preserved ejection fraction in a population-based study. N Engl J Med 2006; 355: 260−269. doi: 10.1056/NEJMoa051530
[14]
Steinberg BA, Zhao X, Heidenreich PA, et al. Trends in patients hospitalized with heart failure and preserved left ventricular ejection fraction: prevalence, therapies, and outcomes. Circulation 2012; 126: 65−75. doi: 10.1161/CIRCULATIONAHA.111.080770
[15]
Krumholz HM, Merrill AR, Schone EM, et al. Patterns of hospital performance in acute myocardial infarction and heart failure 30-day mortality and readmission. Circ Cardiovasc Qual Outcomes 2009; 2: 407−413. doi: 10.1161/CIRCOUTCOMES.109.883256
[16]
Fonarow GC, Stough WG, Abraham WT, et al. Characteristics, treatments, and outcomes of patients with preserved systolic function hospitalized for heart failure: a report from the OPTIMIZE-HF Registry. J Am Coll Cardiol 2007; 50: 768−777. doi: 10.1016/j.jacc.2007.04.064
[17]
Setoguchi S, Stevenson LW, Schneeweiss S. Repeated hospitalizations predict mortality in the community population with heart failure. Am Heart J 2007; 154: 260−266. doi: 10.1016/j.ahj.2007.01.041
[18]
Elshaer F, Hassan W, Fawzy ME, et al. The prevalence, clinical characteristics, and prognosis of diastolic heart failure: a clinical study in elderly Saudi patients with up to 5 years follow-up. Congest Heart Fail 2009; 15: 117−122. doi: 10.1111/j.1751-7133.2008.00043.x
[19]
Mogensen UM, Ersbøll M, Andersen M, et al. Clinical characteristics and major comorbidities in heart failure patients more than 85 years of age compared with younger age groups. Eur J Heart Fail 2011; 13: 1216−1223. doi: 10.1093/eurjhf/hfr116
[20]
Arora S, Lahewala S, Hassan Virk HU, et al. Etiologies, trends, and predictors of 30-day readmissions in patients with diastolic heart failure. Am J Cardiol 2017; 120: 616−624. doi: 10.1016/j.amjcard.2017.05.028
[21]
Eastwood CA, Howlett JG, King-Shier KM, et al. Determinants of early readmission after hospitalization for heart failure. Can J Cardiol 2014; 30: 612−618. doi: 10.1016/j.cjca.2014.02.017
[22]
Dharmarajan K, Hsieh AF, Lin Z, et al. Diagnoses and timing of 30-day readmissions after hospitalization for heart failure, acute myocardial infarction, or pneumonia. JAMA 2013; 309: 355−363. doi: 10.1001/jama.2012.216476
[23]
Stolfo D, Uijl A, Vedin O, et al. Sex-based differences in heart failure across the ejection fraction spectrum: phenotyping, and prognostic and therapeutic implications. JACC Heart Fail 2019; 7: 505−515. doi: 10.1016/j.jchf.2019.03.011


 DownLoad: