Figure
1.
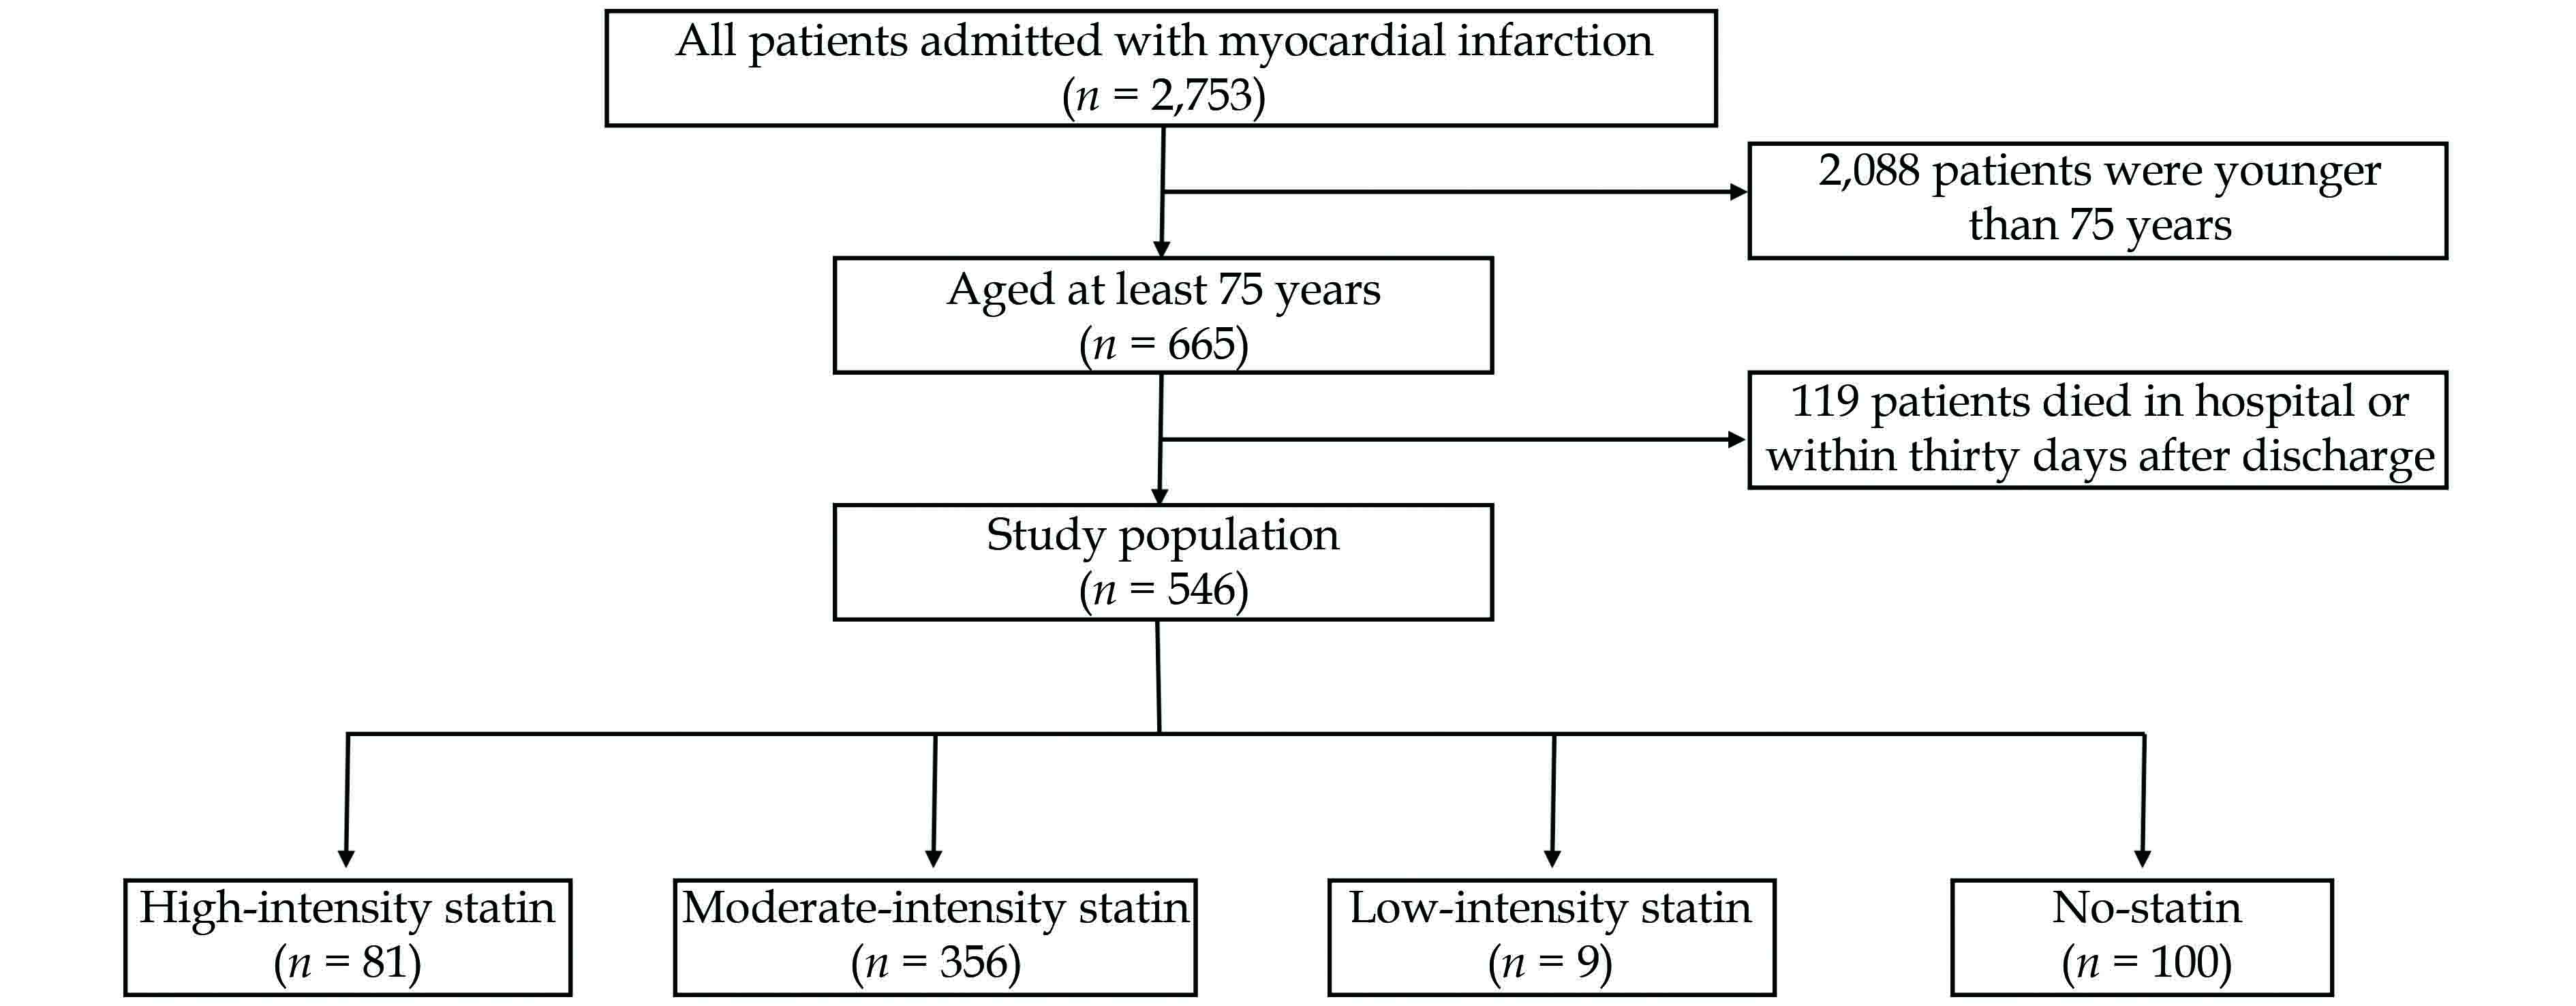
Flow chart of the study population selection.

| Citation: |
Please cite this article as: Moon IT, Kang SH, Lee W, Cho Y, Park JJ, Yoon YE, Oh IY, Yoon CH, Suh JW, Youn TJ, Chae IH, Choi DJ, Cho YS. Impact of statin intensity on adverse cardiac and cerebrovascular events in older adult patients with myocardial infarction. J Geriatr Cardiol 2021; 18(8): 609−622. DOI: 10.11909/j.issn.1671-5411.2021.08.005.

|
The prevalence and mortality of atherosclerotic cardiovascular disease increase with age.[1] The 2013 American College of Cardiology (ACC)/American Heart Association (AHA) guideline on the treatment of blood cholesterol recommend moderate-intensity statin as secondary prevention to reduce atherosclerotic cardiovascular risk in adults aged over 75 years.[2] Prior to the publication of the guidelines, statins were prescribed based on risk factors and cholesterol levels according to the National Cholesterol Education Program Adult Treatment Panel III guideline.[3] The guideline recommended lowering low-density lipoprotein cholesterol (LDL-C) to less than 100 mg/dL in patients with coronary heart disease, and this concept was contained in the 2004 ACC/AHA guidelines for the management of patients with ST-segment elevation myocardial infarction (MI).[4] In 2004, National Cholesterol Education Program released a modification report, adding an optional goal of LDL-C less than 70 mg/dL in very high risk patients.[5] And, this optional goal was included in the 2007 ACC/AHA guidelines for the management of patients with unstable angina (UA)/non-ST-segment elevation MI.[6]
Although more recent guidelines recommend high-intensity statin for high-risk older adult MI patients,[7,8] the supporting reference showed only a marginal reduction in the risk of major vascular events.[9,10] Moreover, the patients enrolled in the randomized trials comparing statin intensities were not older than 75 years or 80 years.[11–14] Therefore, there is a lack of evidence on the use of high-intensity statins for patients with MI at least 75 years old and whether a high-intensity statin is sufficiently effective for secondary prevention in comparison with low-to-moderate intensity statins. Therefore, we aimed to investigate the prescription intensities of statins in real-world practice and the long-term cardiac and cerebrovascular outcomes according to statin intensity in older adult patients with MI.
We enrolled consecutive patients aged ≥ 75 years admitted with MI between 2005 and 2015 at the Seoul National University Bundang Hospital, Seongnam, South Korea. Irrespective of ST-segment changes, MI included type Ι MI, according to its universal definition.[15] Those who died in-hospital and within thirty days after discharge were excluded. The study protocol was approved by the Institutional Review Board (No.B-2009-636-101), and written informed consent was waived by the Institutional Review Board because of the retrospective design and minimal hazard to the subjects. The study complied with the principles of the Declaration of Helsinki.
Similar to the 2013 ACC/AHA guideline on the treatment of blood cholesterol, statin intensity was classified as either high-intensity, moderate-intensity, or low-intensity. Atorvastatin of 40−80 mg and rosuvastatin of 20−40 mg were categorized as high-intensity statins, and simvastatin of 10 mg, pravastatin of 10−20 mg, lovastatin of 20 mg, fluvastatin of 20−40 mg, and pitavastatin of 1 mg were classified in low-intensity statins, and the others were categorized as moderate-intensity statins. Data on statin intensity were acquired as the main intensity of three years, which is the intensity of statin prescribed for the longest period within the first three years of follow-up after discharge from the index hospitalization. Patients were classified into four groups according to their three-year main intensity: high-intensity statin group, moderate-intensity statin group, low-intensity statin group, and no-statin group. Non-statin lipid-lowering agents, including Niemann-Pick C1-like 1 inhibitor or fibric acid derivatives, were not considered to affect the intensity-based categorization of statins significantly. Furthermore, proprotein convertase subtilisin/kexin type 9 inhibitors were not introduced to the country until the end of the enrollment period.
The primary endpoint was the occurrence of major adverse cardiac and cerebrovascular events (MACCE), defined as a composite endpoint of all-cause death, recurrent MI, rehospitalization due to UA, repeat revascularization (including percutaneous coronary intervention and coronary artery bypass graft surgery), and ischemic stroke (including transient ischemic attack) during the follow-up period of thirty days to seven years after discharge. The secondary endpoints included the components of MACCE: all-cause death, recurrent MI, rehospitalization due to UA, repeat revascularization, ischemic stroke, and the last follow-up lipid profiles.
The all-cause death data of all the study patients were collected by requesting the Ministry of Public Administration and Security the date of resident registration cancelation to avoid missing the deaths at home or other hospitals. Rehospitalization due to heart failure or non-cardiovascular cause was not classified as an occurrence of the study outcome events.
After analyzing the baseline characteristics and outcomes in the four unadjusted statin-intensity groups, we compared the outcomes in patients with low-to-moderate intensity statin versus high-intensity statin. Differences in baseline demographics and comorbid conditions were corrected through propensity score matching.
The continuous variables are presented as mean ± SD, and the categorical variables are presented as frequency or percentage. To compare the four statin groups, the Pearson’s chi-squared test or Fisher’s exact test was used for the categorical variables, while the one-way ANOVA or Kruskal-Wallis H test was used for the continuous variables. Kaplan-Meier analysis was performed to calculate the cumulative incidence of the primary and secondary outcomes.
To compare the variables of the high-intensity statin group and the low-to-moderate intensity statin group, the Pearson’s chi-squared test or Fisher’s exact test was used for the categorical variables, and Student’s t-test or Mann-Whitney U test was used for the continuous variables.
Propensity score matching was initiated in 437 patients after excluding the no-statin group (n = 100), the patient without baseline coronary angiography (n = 1), the patient whose baseline body mass index data were missing (n = 1), and the patient without baseline lipid profile (n = 1). The matching variables comprised mostly of the baseline characteristics, including age, sex, hypertension, diabetes mellitus, dyslipidemia, smoking history, prior MI, prior percutaneous coronary intervention, prior coronary artery bypass graft, prior stroke, prior congestive heart failure, prior chronic kidney disease, height, body weight, body mass index, admission systolic blood pressure, diastolic blood pressure, heart rate, Killip class, clinical diagnosis, troponin I, creatine kinase-MB isoform, serum creatinine, estimated glomerular filtration rate, total cholesterol, triglyceride, high-density lipoprotein cholesterol (HDL-C), LDL-C, plasma glucose, echocardiographic left ventricular end-diastolic dimension, left ventricular end-systolic dimension, and left ventricular ejection fraction. One-to-one matching was performed for each group without replacement, and a caliper width with a standard deviation of 0.05 was used.
Baseline and follow-up lipid profiles were compared using the paired t-test after performing a normality test. Data analysis was performed using IBM SPSS Statistics for Windows, version 25.0 (SPSS, Chicago, NY, USA), and graphs were drawn using R statistical version 3.6.
Of the 2,753 patients admitted with MI, 665 patients were aged at least 75 years, with 119 patients dying in the hospital or within thirty days after discharge. Finally, 546 patients were included in this study (Figure 1). The average age of the whole study population was 81 years, and 51% of patients were male (Table 1). Among all the patients, 46% of patients had ST-segment elevation MI, 84% of patients underwent percutaneous coronary intervention, and 10% of patients underwent coronary artery bypass graft surgery. The proportions of Killip classes 3 and 4 were 14% and 8%, respectively.
| Characteristics | High-intensity statin (n = 81) | Moderate-intensity statin (n = 356) | Low-intensity statin (n = 9) | No-statin (n = 100) | Total (n = 546) | P-value |
| General characteristics | ||||||
| Age, yrs | 80.3 ± 3.9 | 80.2 ± 4.3 | 83.1 ± 7.2 | 81.1 ± 5.1 | 80.5 ± 4.5 | 0.107 |
| Sex, male | 37 (45.7%) | 184 (51.7%) | 6 (66.7%) | 50 (50.0%) | 277 (50.7%) | 0.595 |
| Body mass index, kg/m2 | 23.1 ± 3.4 | 22.8 ± 3.9 | 21.5 ± 4.2 | 21.3 ± 3.1 | 22.6 ± 3.8 | 0.002 |
| Height, cm | 157.7 ± 7.9 | 158.8 ± 8.8 | 161.1 ± 7.6 | 158.0 ± 9.8 | 158.5 ± 8.9 | 0.556 |
| Weight, kg | 57.3 ± 9.6 | 57.4 ± 11.2 | 56.3 ± 13.3 | 53.5 ± 10.4 | 56.7 ± 11.0 | 0.015 |
| Lipid profiles | ||||||
| Total cholesterol, mg/dL | 173.4 ± 42.3 | 164.1 ± 39.9 | 133.4 ± 22.0 | 143.9 ± 41.3 | 161.3 ± 41.4 | < 0.001 |
| Triglyceride, mg/dL | 99.0 ± 48.4 | 105.3 ± 64.4 | 69.9 ± 22.9 | 89.6 ± 56.6 | 100.9 ± 60.7 | 0.053 |
| HDL-C, mg/dL | 45.0 ± 9.2 | 44.2 ± 13.8 | 46.2 ± 12.2 | 43.2 ± 12.6 | 44.2 ± 12.9 | 0.779 |
| LDL-C, mg/dL | 106.4 ± 35.1 | 97.6 ± 33.2 | 67.8 ± 16.2 | 81.7 ± 34.0 | 95.6 ± 34.4 | < 0.001 |
| Clinical presentation | ||||||
| STEMI/NSTEMI | 40/41 (49.4%/50.6%) | 163/193 (45.8%/54.2%) | 6/3 (66.7%/33.3%) | 41/59 (41.0%/59.0%) | 250/296 (45.8%/54.2%) | 0.403 |
| Killip class I/II/III/IV | 55/6/13/7 (67.9%/7.4%/16.0%/8.6%) | 233/53/45/25 (65.4%/14.9%/12.6%/7.0%) | 5/0/1/3 (55.6%/0/11.1%/33.3%) | 60/14/19/7 (60.0%/14.0%/19.0%/7.0%) | 353/73/78/42 (64.7%/13.4%/14.3%/7.7%) | 0.087 |
| Risk factors | ||||||
| Hypertension | 57 (70.4%) | 232 (65.2%) | 7 (77.8%) | 70 (70.0%) | 366 (67.0%) | 0.607 |
| Diabetes mellitus | 22 (27.2%) | 109 (30.6%) | 2 (22.2%) | 31 (31.0%) | 164 (30.0%) | 0.877 |
| Dyslipidemia | 20 (24.7%) | 70 (19.7%) | 0 | 16 (16.0%) | 106 (19.4%) | 0.224 |
| Smoking current/former/never | 10/20/51 (12.3%/24.7%/63.0%) | 54/102/200 (15.2%/28.7%/56.2%) | 2/3/4 (22.2%/33.3%/44.4%) | 17/30/53 (17.0%/30.0%/53.0%) | 83/155/308 (15.2%/28.4%/56.4%) | 0.862 |
| Prior MI | 2 (2.5%) | 20 (5.6%) | 1 (11.1%) | 8 (8.0%) | 31 (5.7%) | 0.382 |
| Prior PCI | 13 (16.0%) | 50 (14.0%) | 2 (22.2%) | 8 (8.0%) | 73 (13.4%) | 0.291 |
| Prior CABG | 4 (4.9%) | 9 (2.5%) | 0 | 4 (4.0%) | 17 (3.1%) | 0.604 |
| Prior stroke | 7 (8.6%) | 36 (10.1%) | 2 (22.2%) | 12 (12.0%) | 57 (10.4%) | 0.590 |
| Prior CHF | 2 (2.5%) | 1 (0.3%) | 0 | 5 (5.0%) | 8 (1.5%) | 0.005 |
| Prior CKD | 4 (4.9%) | 19 (5.3%) | 0 | 11 (11.0%) | 34 (6.2%) | 0.157 |
| Laboratory findings | ||||||
| CK-MB, ng/mL | 56.7 ± 130.3 | 51.6 ± 102.1 | 58.8 ± 116.5 | 53.0 ± 84.1 | 52.8 ± 103.8 | 0.979 |
| Troponin-I, ng/mL | 75.9 ± 117.4 | 60.6 ± 94.0 | 49.1 ± 62.9 | 63.2 ± 111.6 | 63.2 ± 100.6 | 0.636 |
| NT-proBNP, pg/mL | 5231.5 ± 8794.3 | 5286.7 ± 11590.9 | 2812.1 ± 4426.8 | 9769.7 ± 21349.5 | 6055.3 ± 13584.0 | 0.044 |
| Serum creatinine, mg/dL | 1.16 ± 0.84 | 1.24 ± 0.96 | 1.06 ± 0.34 | 1.46 ± 1.19 | 1.27 ± 0.98 | 0.154 |
| eGFR by MDRD, mL/min per 1.73 m2 | 65.3 ± 25.9 | 62.7 ± 26.8 | 68.7 ± 26.4 | 57.6 ± 29.9 | 62.2 ± 27.3 | 0.216 |
| Glucose, mg/dL | 92.0 ± 28.6 | 88.3 ± 21.7 | 88.7 ± 18.5 | 87.6 ± 27.9 | 88.7 ± 24.0 | 0.618 |
| Hemoglobin A1c, % | 5.9 ± 0.7 | 5.9 ± 0.7 | 5.9 ± 0.5 | 5.9 ± 0.9 | 5.9 ± 0.7 | 0.674 |
| LVEF, % | 48.5 ± 13.1 | 51.2 ± 12.4 | 51.5 ± 16.2 | 48.7 ± 12.8 | 50.3 ± 12.7 | 0.164 |
| LVEDD, mm | 47.4 ± 5.3 | 47.7 ± 6.4 | 49.8 ± 11.7 | 47.3 ± 6.4 | 47.6 ± 6.3 | 0.686 |
| LVESD, mm | 34.0 ± 7.0 | 33.0 ± 7.5 | 35.7 ± 13.0 | 33.6 ± 7.3 | 33.3 ± 7.5 | 0.502 |
| Systolic BP, mmHg | 138.0 ± 29.0 | 138.3 ± 33.1 | 126.6 ± 27.2 | 138.0 ± 32.0 | 138.0 ± 32.2 | 0.760 |
| Diastolic BP, mmHg | 74.7 ± 19.5 | 74.4 ± 18.7 | 69.2 ± 14.2 | 74.0 ± 14.6 | 74.3 ± 18.1 | 0.856 |
| Heart rate, beat/ mim | 77.0 ± 19.8 | 77.1 ± 22.3 | 85.1 ± 33.6 | 83.0 ± 23.2 | 78.3 ± 22.4 | 0.086 |
| CAG findings | ||||||
| CAD extent 0/1/2/3 vessel disease | 0/15/26/40 (0/18.5%/32.1%/49.4%) | 1/87/109/159 (0.3%/24.4%/30.6%/44.7%) | 0/3/3/2 (0/37.5%/37.5%/25.0%) | 1/21/26/52 (1.0%/21.0%/26.0%/52.0%) | 2/126/164/253 (0.4%/23.1%/30.1%/6.4%) | 0.729 |
| Left main disease | 6 (7.4%) | 30 (8.4%) | 0 | 13 (13.0%) | 49 (9.0%) | 0.370 |
| Treatment strategy | ||||||
| Thrombolysis | 1 (1.2%) | 7 (2.0%) | 0 | 4 (4.0%) | 12 (2.2%) | 0.542 |
| PCI | 73 (90.1%) | 304 (85.4%) | 7 (77.8%) | 72 (72.0%) | 456 (83.5%) | 0.004 |
| CABG | 3 (3.7%) | 31 (8.7%) | 0 | 19 (19.0%) | 53 (9.7%) | 0.002 |
| Discharge medication | ||||||
| Aspirin | 81 (100.0%) | 355 (99.7%) | 9 (100.0%) | 98 (98.0%) | 543 (99.5%) | 0.186 |
| P2Y12 inhibitor | 81 (100.0%) | 346 (97.2%) | 9 (100.0%) | 96 (96.0%) | 532 (97.4%) | 0.351 |
| Beta blocker | 65 (80.2%) | 233 (65.4%) | 6 (66.7%) | 58 (58.0%) | 362 (66.3%) | 0.017 |
| ACEI | 50 (61.7%) | 210 (59.0%) | 7 (77.8%) | 47 (47.0%) | 314 (57.5%) | 0.074 |
| ARB | 14 (17.3%) | 78 (21.9%) | 2 (22.2%) | 27 (27.0%) | 121 (22.2%) | 0.478 |
| ACEI or ARB | 62 (76.5%) | 278 (78.1%) | 9 (100.0%) | 72 (72.0%) | 421 (77.1%) | 0.225 |
| Calcium channel blocker | 11 (13.6%) | 60 (16.9%) | 0 | 23 (23.0%) | 94 (17.2%) | 0.172 |
| Loop diuretics | 27 (33.3%) | 162 (45.5%) | 3 (33.3%) | 54 (54.0%) | 246 (45.1%) | 0.041 |
| Spironolactone | 11 (13.6%) | 44 (12.4%) | 1 (11.1%) | 18 (18.0%) | 74 (13.6%) | 0.539 |
| Vitamin K antagonist | 6 (7.4%) | 18 (5.1%) | 0 | 8 (8.0%) | 32 (5.9%) | 0.540 |
| Data are presented as means ± SD or n (%). ACEI: angiotensin converting enzyme inhibitor; ARB: angiotensin receptor blocker; BP: blood pressure; CABG: coronary artery bypass surgery; CAD: coronary artery disease; CHF: congestive heart failure; CKD: chronic kidney disease; CK-MB: creatine kinase-myocardial band; eGFR: estimated glomerular filtration rate; HDL-C: high-density lipoprotein cholesterol; LDL-C: low-density lipoprotein cholesterol; LVEDD: left ventricular end diastolic dimension; LVEF: left ventricular ejection fraction; LVESD: left ventricular end systolic dimension; MDRD: modification of diet in renal disease; MI: myocardial infarction; NSTEMI: non-ST-segment elevation myocardial infarction; NT-proBNP: N-terminal pro-B-type natriuretic peptide; PCI: percutaneous coronary intervention; STEMI: ST-segment elevation myocardial infarction. | ||||||
 DownLoad:
CSV
DownLoad:
CSV
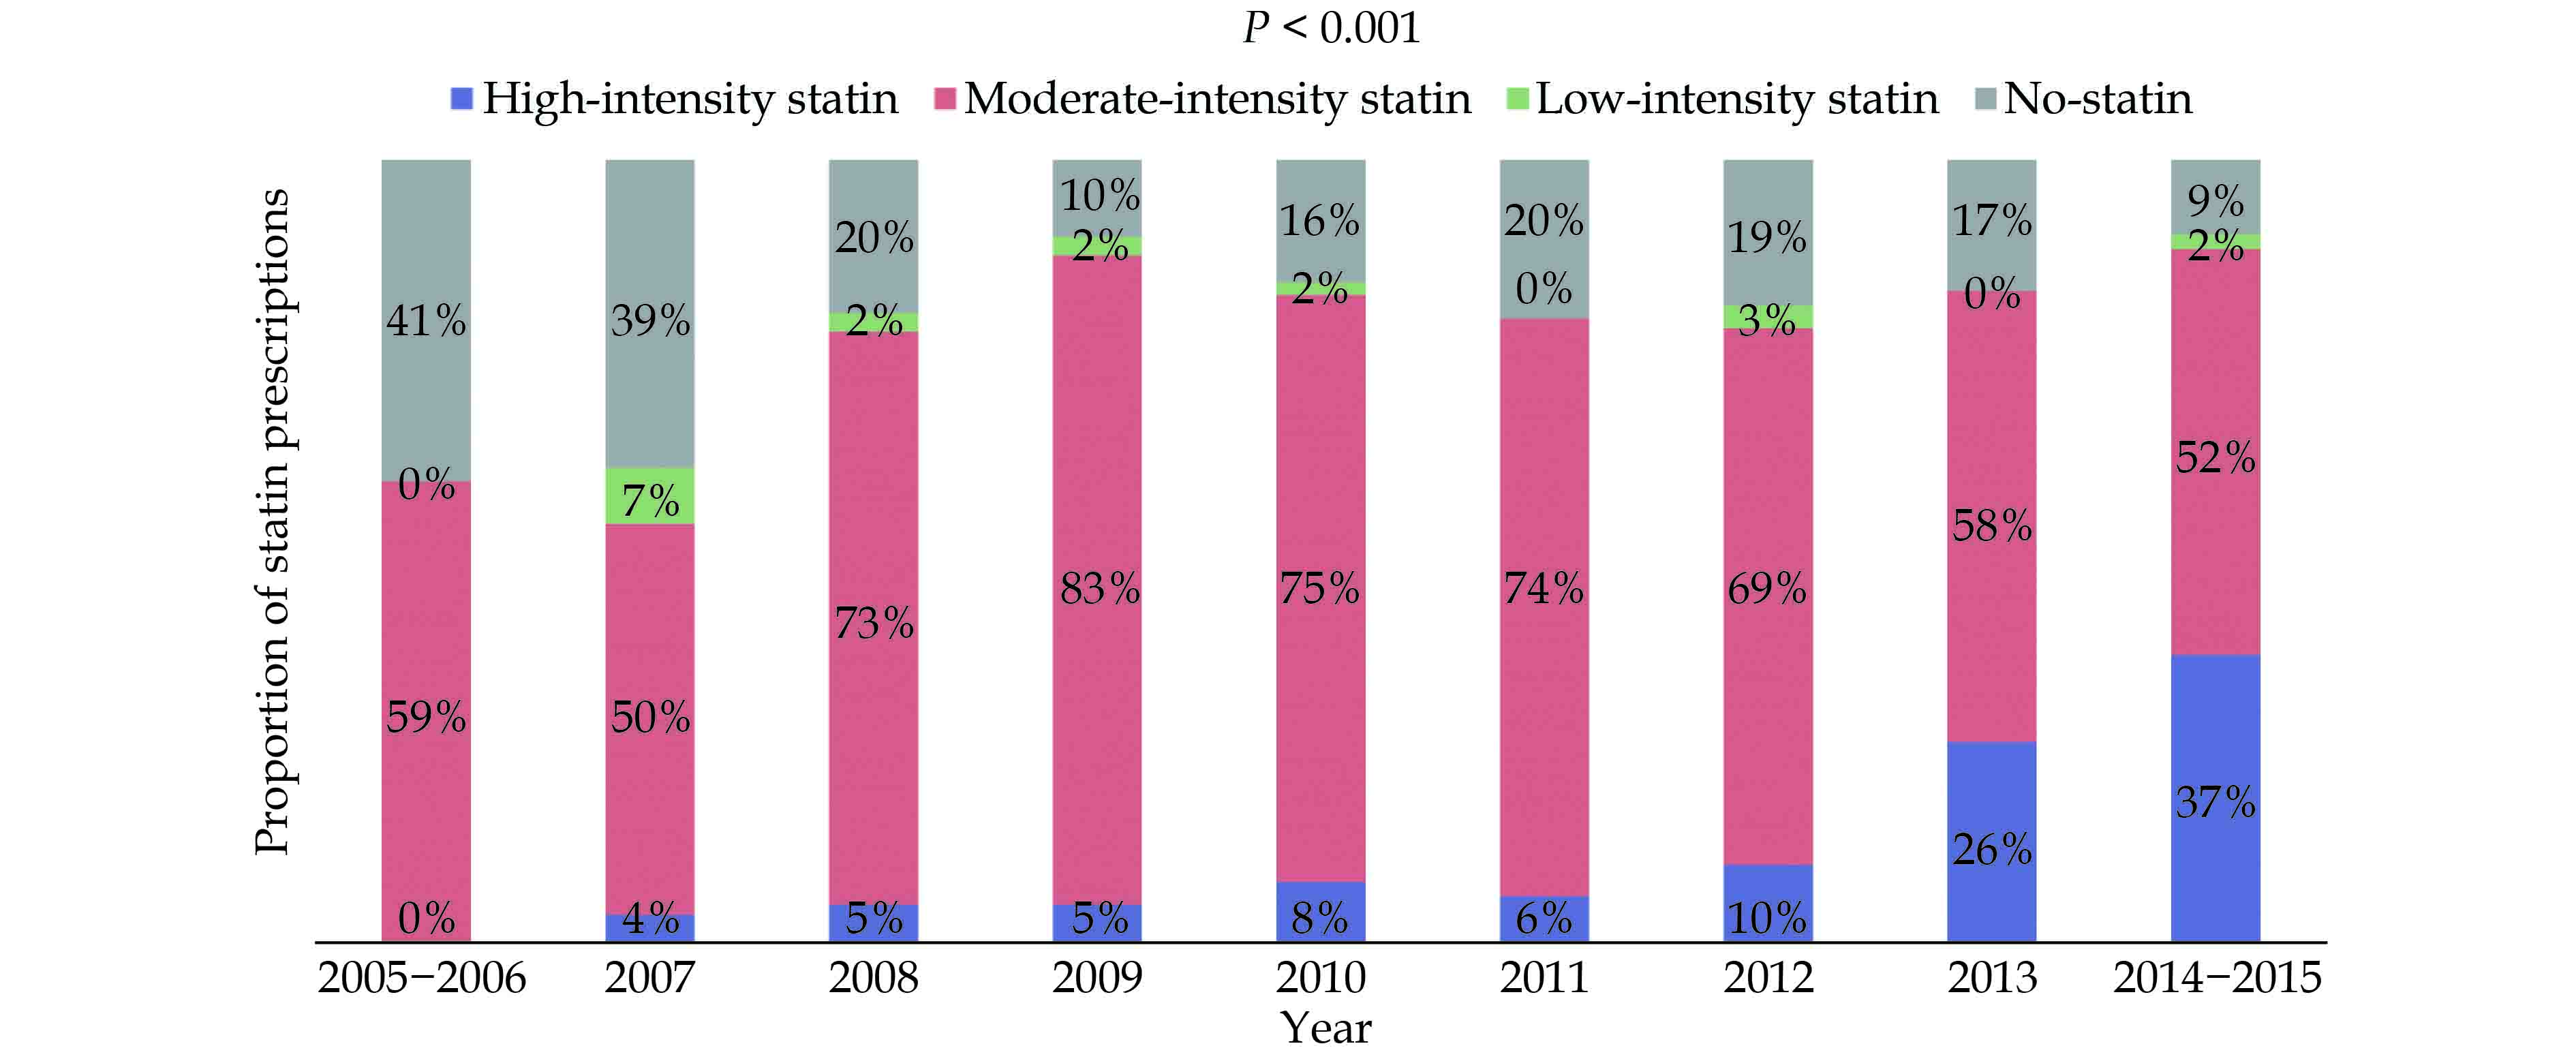
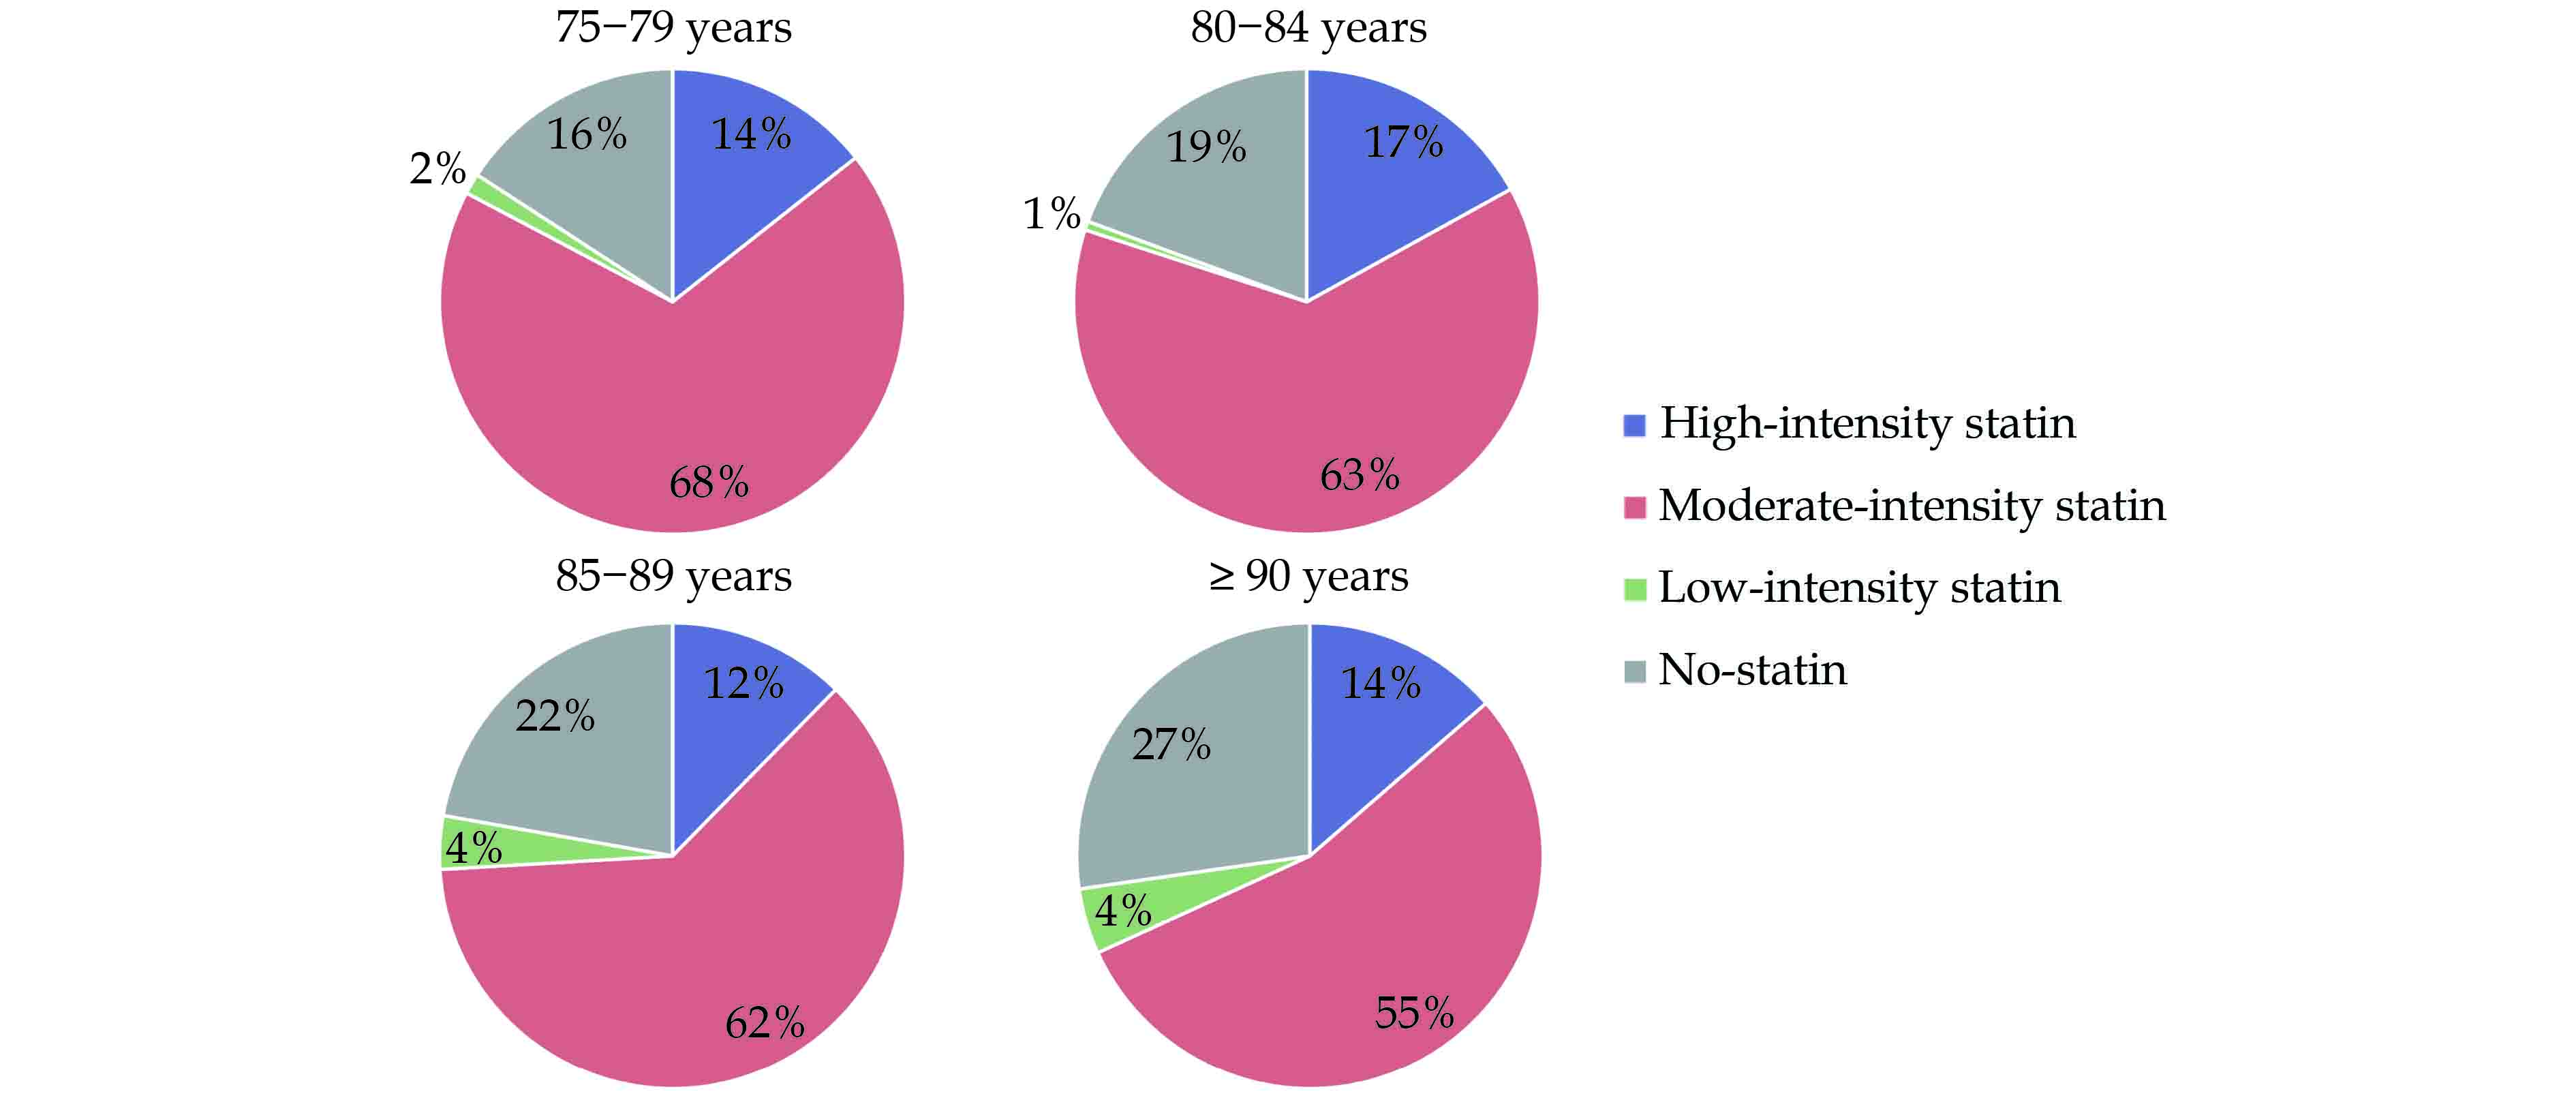
The proportion of high-intensity statin prescription at discharge was 24%. However, 35% of the patients had their statin intensity changed after discharge. The trends of the three-year main intensity according to discharge year showed that the prescription of high-intensity statin significantly increased each year (P < 0.001) (Figure 2). Meanwhile, the proportion of high-intensity statin according to the three-year main intensity was not significantly different among the age groups divided by five years (75−79 years: 14%, 80−84 years: 17%, 85−89 years: 12%, and at least 90 years: 14%; P = 0.856) (Figure 3).
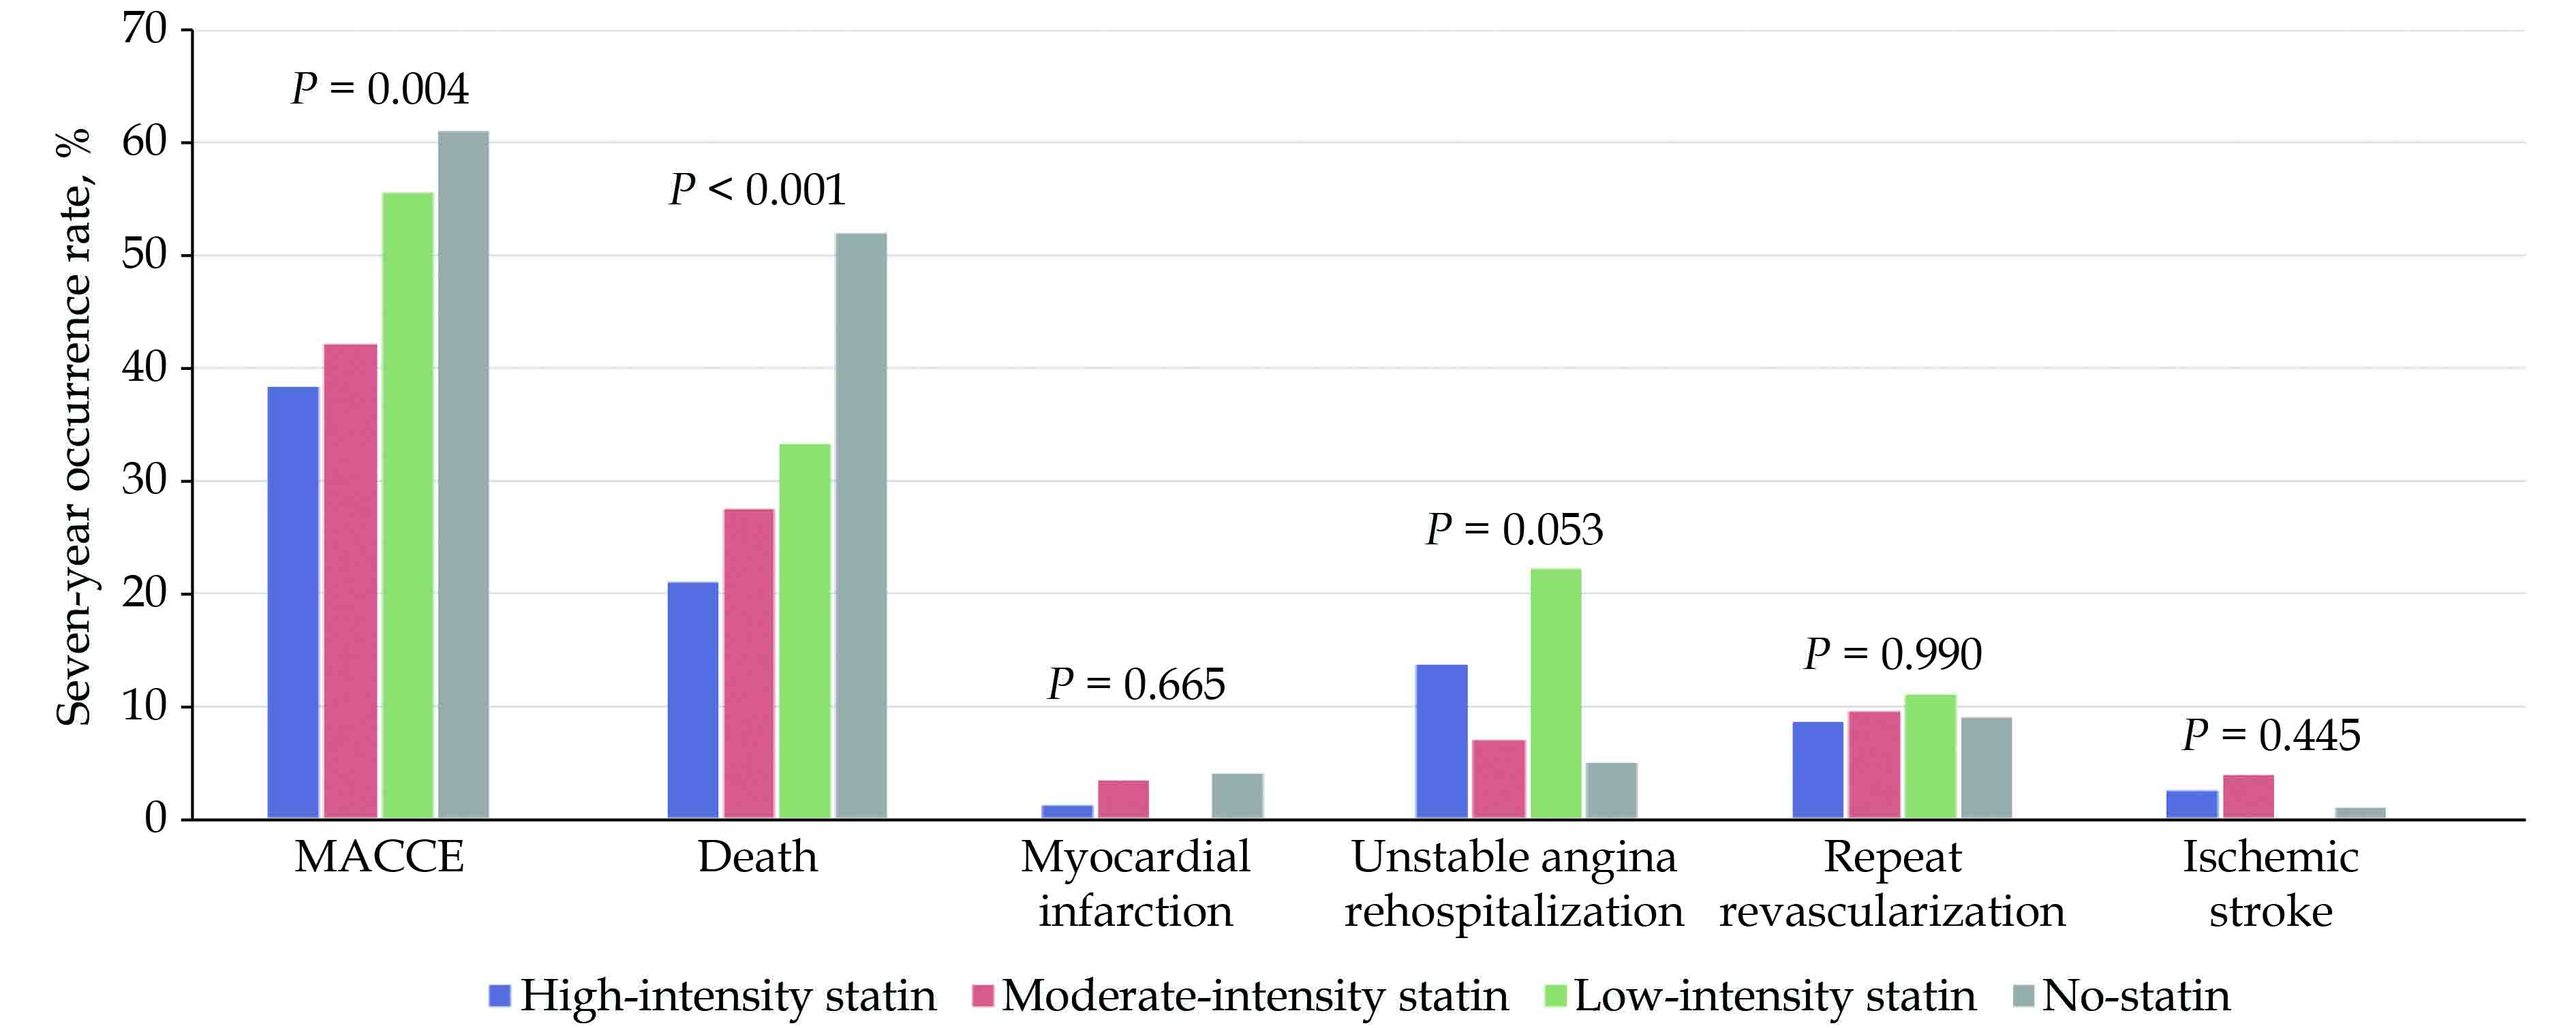
Among the four statin-intensity groups, body weight, body mass index, history of prior heart failure, dyslipidemia, lipid profiles, N-terminal-pro-brain natriuretic peptide, revascularization strategy, and discharge medication were significantly different (Table 1). The unadjusted seven-year MACCE rate was also significantly different between the four groups (high-intensity statin group: 38%, moderate-intensity statin group: 42%, low-intensity statin group: 56%, and no-statin group: 61%, P = 0.004) (Figure 4).
When the patients were re-grouped into high-intensity group and low-to-moderate intensity group after excluding the no-statin group, significant differences in the baseline total cholesterol, LDL-C, and discharge prescription of beta-blockers were still noted (Table 2).
| Characteristics | High-intensity statin (n = 81) | Low-to-moderate intensity statin (n = 365) | P-value |
| General characteristics | |||
| Age, yrs | 80.3 ± 3.9 | 80.3 ± 4.4 | 0.954 |
| Sex, male | 37 (45.7%) | 190 (52.1%) | 0.299 |
| Body mass index, kg/m2 | 23.1 ± 3.4 | 22.8 ± 3.9 | 0.491 |
| Height, cm | 157.7 ± 7.9 | 158.8 ± 8.8 | 0.303 |
| Weight, kg | 57.3 ± 9.6 | 57.4 ± 11.3 | 0.937 |
| Lipid profiles | |||
| Total cholesterol, mg/dL | 173.4 ± 42.3 | 163.4 ± 39.8 | 0.043 |
| Triglyceride, mg/dL | 99.0 ± 48.4 | 104.4 ± 64.0 | 0.475 |
| HDL-C, mg/dL | 45.0 ± 9.2 | 44.2 ± 13.7 | 0.551 |
| LDL-C, mg/dL | 106.4 ± 35.1 | 96.9 ± 33.2 | 0.021 |
| Clinical presentation | |||
| STEMI/NSTEMI | 40/41 (49.4%/50.6%) | 169/196 (46.3%/53.7%) | 0.615 |
| Killip class I/II/III/IV | 55/6/13/7 (67.9%/7.4%/16.0%/8.6%) | 238/53/46/28 (65.2%/14.5%/12.6%/7.7%) | 0.615 |
| Risk factors | |||
| Hypertension | 57 (70.4%) | 239 (65.5%) | 0.399 |
| Diabetes mellitus | 22 (27.2%) | 111 (30.4%) | 0.563 |
| Dyslipidemia | 20 (24.7%) | 70 (19.2%) | 0.263 |
| Smoking, current/former/never | 10/20/51 (12.3%/24.7%/63.0%) | 56/105/204 (15.3%/28.8%/55.9%) | 0.503 |
| Prior MI | 2 (2.5%) | 21 (5.8%) | 0.401 |
| Prior PCI | 13 (16.0%) | 52 (14.2%) | 0.677 |
| Prior CABG | 4 (4.9%) | 9 (2.5%) | 0.267 |
| Prior stroke | 7 (8.6%) | 38 (10.4%) | 0.633 |
| Prior CHF | 2 (2.5%) | 1 (0.3%) | 0.086 |
| Prior CKD | 4 (4.9%) | 19 (5.2%) | 1.000 |
| Laboratory findings | |||
| CK-MB, ng/mL | 56.7 ± 130.3 | 51.8 ± 102.3 | 0.710 |
| Troponin-I, ng/mL | 75.9 ± 117.4 | 60.3 ± 93.3 | 0.196 |
| NT-proBNP, pg/mL | 5231.5 ± 8794.3 | 5232.1 ± 11483.8 | 1.000 |
| Serum creatinine, mg/dL | 1.16 ± 0.84 | 1.24 ± 0.95 | 0.528 |
| eGFR by MDRD, mL/min per 1.73 m2 | 65.3 ± 25.9 | 62.8 ± 26.8 | 0.440 |
| Glucose, mg/dL | 92.0 ± 28.6 | 88.3 ± 21.6 | 0.200 |
| Hemoglobin A1c, % | 5.85 ± 0.73 | 5.95 ± 0.68 | 0.282 |
| LVEF, % | 48.5 ± 13.1 | 51.2 ± 12.5 | 0.079 |
| LVEDD, mm | 47.4 ± 5.3 | 47.7 ± 6.5 | 0.620 |
| LVESD, mm | 34.0 ± 7.0 | 33.1 ± 7.6 | 0.300 |
| Systolic BP, mmHg | 138.0 ± 29.0 | 138.0 ± 33.0 | 0.987 |
| Diastolic BP, mmHg | 74.7 ± 19.5 | 74.2 ± 18.6 | 0.846 |
| Heart rate, beat/ mim | 77.0 ± 19.8 | 77.3 ± 22.6 | 0.896 |
| CAG findings | |||
| CAD extent, 0/1/2/3 vessel disease | 0/15/26/40 (0/18.5%/32.1%/49.4%) | 1/90/112/161 (0.3%/24.7%/30.8%/44.2%) | 0.630 |
| Left main disease | 6 (7.4%) | 30 (8.2%) | 0.803 |
| Treatment strategy | |||
| Thrombolysis | 1 (1.2%) | 7 (1.9%) | 1.000 |
| PCI | 73 (90.1%) | 311 (85.2%) | 0.247 |
| CABG | 3 (3.7%) | 31 (8.5%) | 0.142 |
| Discharge medication | |||
| Aspirin | 81 (100.0%) | 364 (99.7%) | 1.000 |
| P2Y12 inhibitor | 81 (100.0%) | 355 (97.3%) | 0.132 |
| Beta blocker | 65 (80.2%) | 239 (65.5%) | 0.010 |
| ACEI or ARB | 62 (76.5%) | 287 (78.6%) | 0.680 |
| Calcium channel blocker | 11 (13.6%) | 60 (16.4%) | 0.525 |
| Loop diuretics | 27 (33.3%) | 165 (45.2%) | 0.051 |
| Spironolactone | 11 (13.6%) | 45 (12.3%) | 0.758 |
| Vitamin K antagonist | 6 (7.4%) | 18 (4.9%) | 0.412 |
| Data are presented as means ± SD or n (%). ACEI: angiotensin converting enzyme inhibitor; ARB: angiotensin receptor blocker; BP: blood pressure; CABG: coronary artery bypass surgery; CAD: coronary artery disease; CHF: congestive heart failure; CKD: chronic kidney disease; CK-MB: creatine kinase-myocardial band; eGFR: estimated glomerular filtration rate; HDL-C: high-density lipoprotein cholesterol; LDL-C: low-density lipoprotein cholesterol; LVEDD: left ventricular end diastolic dimension; LVEF: left ventricular ejection fraction; LVESD: left ventricular end systolic dimension; MDRD: modification of diet in renal disease; MI: myocardial infarction; NSTEMI: non-ST-segment elevation myocardial infarction; NT-proBNP: N-terminal pro-B-type natriuretic peptide; PCI: percutaneous coronary intervention; STEMI: ST-segment elevation myocardial infarction. | |||
DownLoad:
CSV
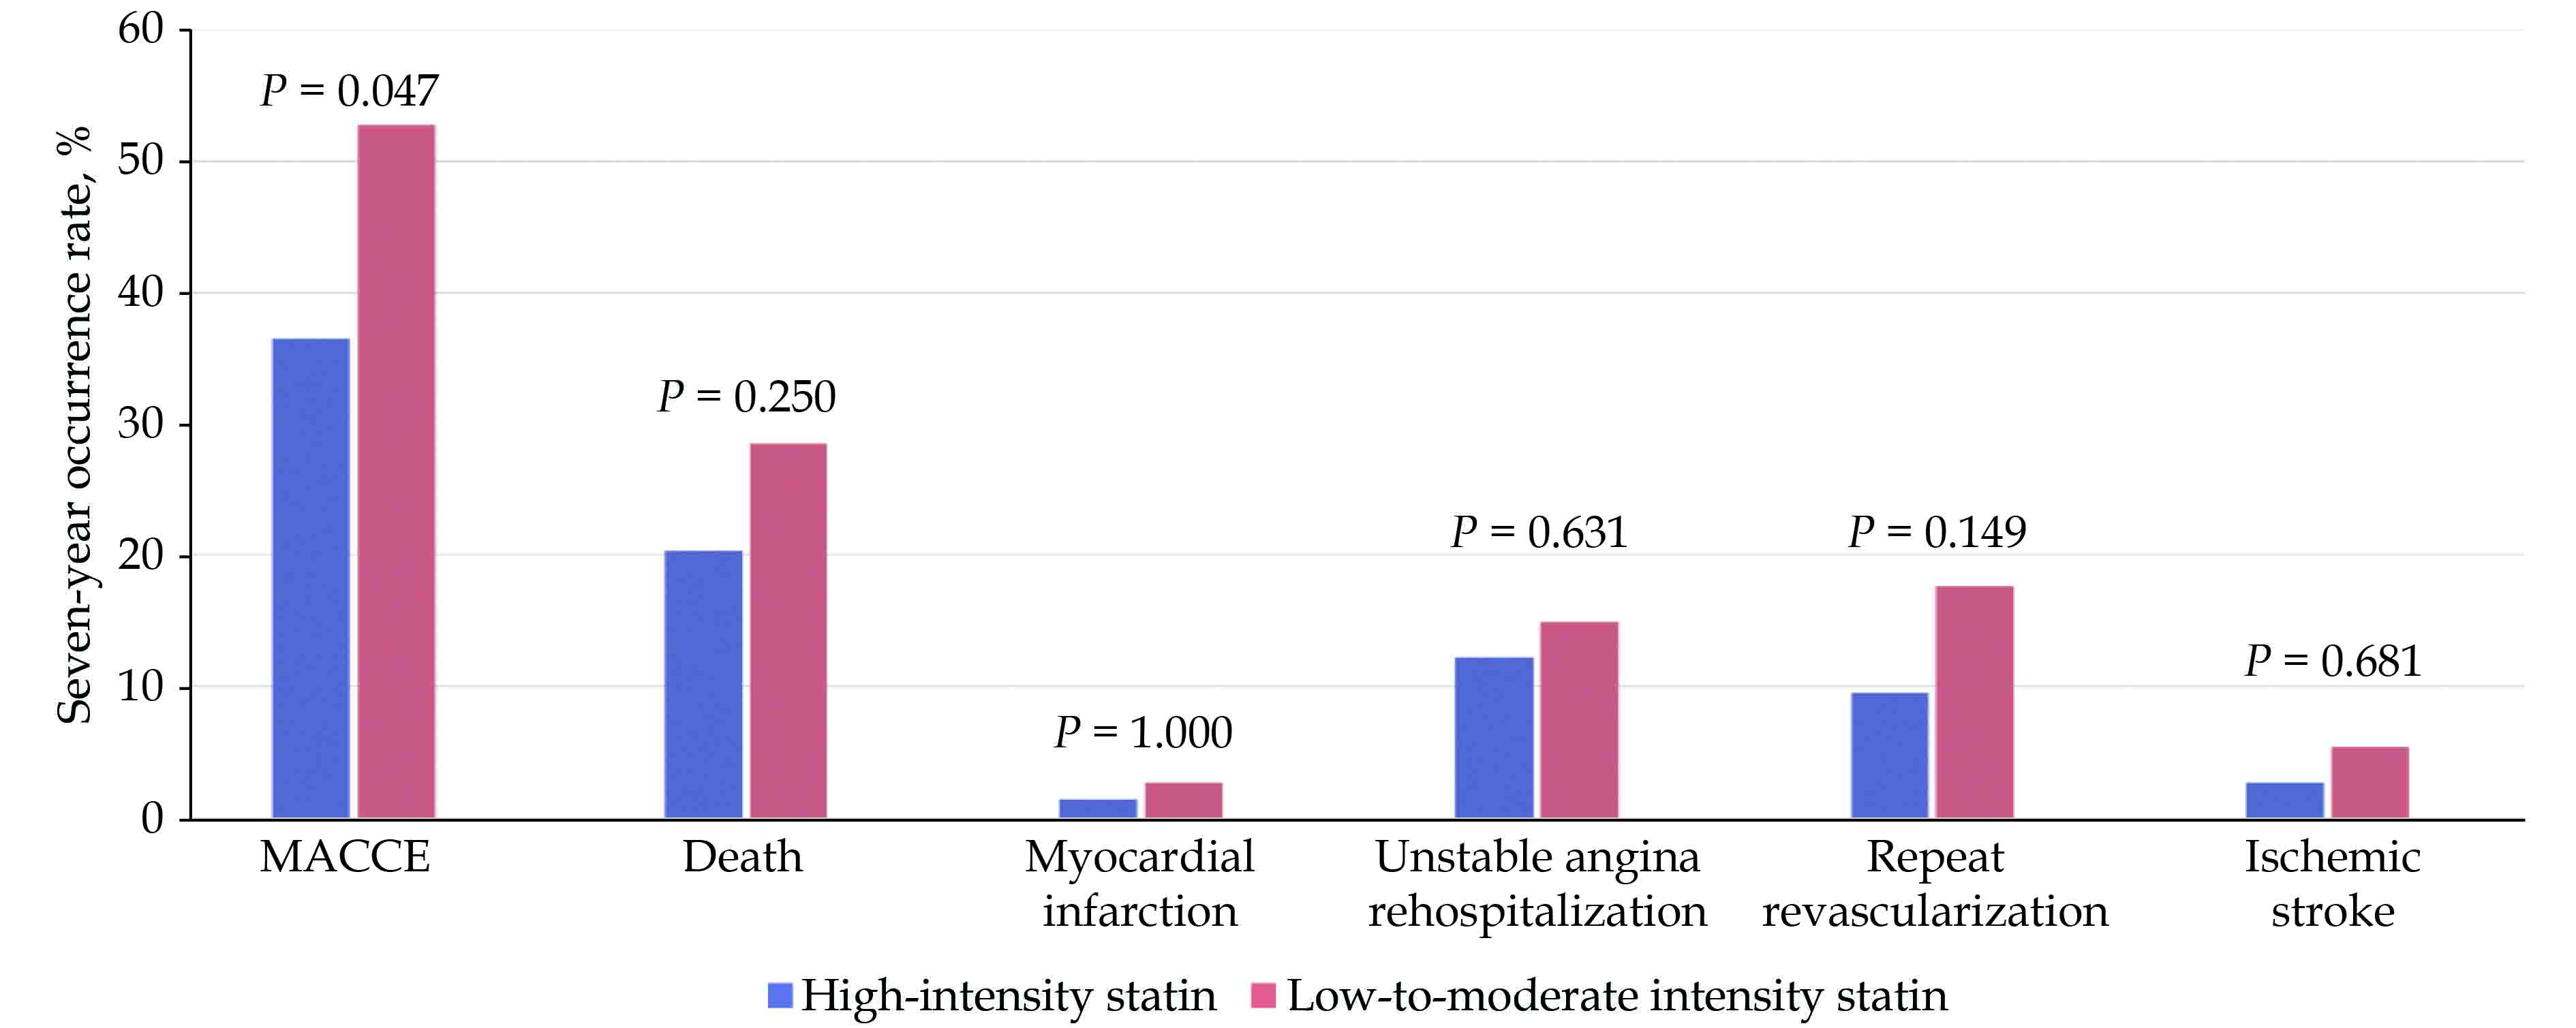
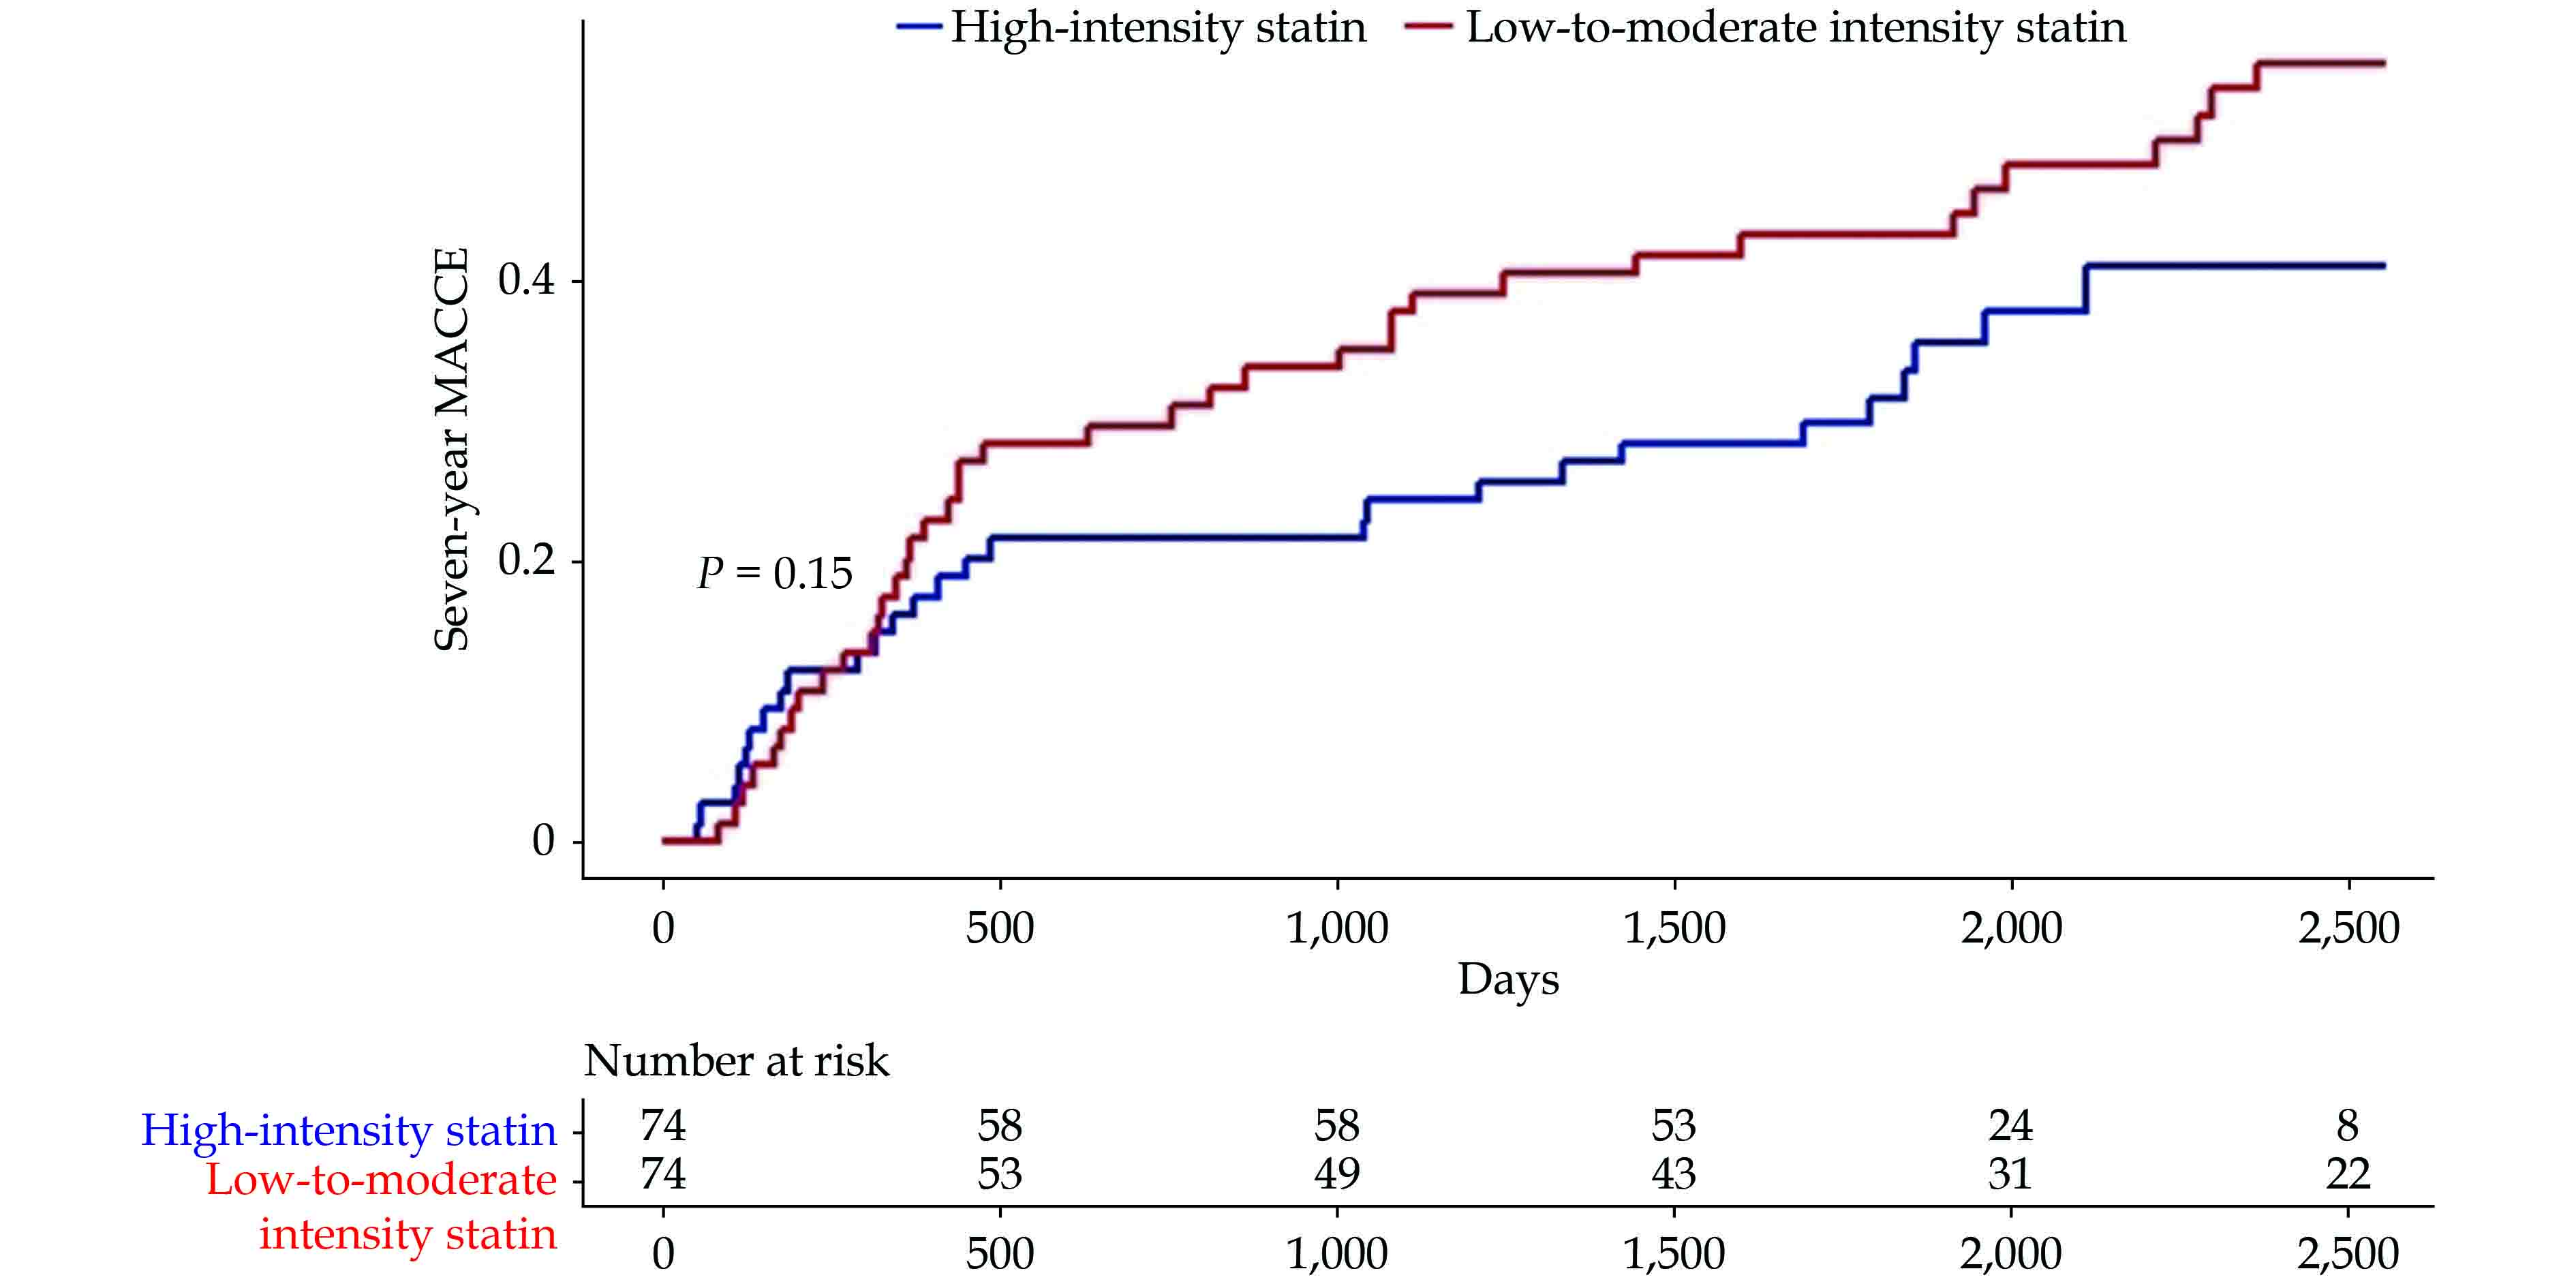
Among the 74 propensity score-matched pairs, which lacked any significant differences in all the baseline characteristics (Table 3), the high-intensity group had a significantly lower rate of seven-year MACCE compared to that in the low-to-moderate intensity group (37% vs. 53%, P = 0.047), showing a risk reduction of 31%. Furthermore, the high-intensity group had numerically less events in the MACCE components, including the rate of all-cause death (21% vs. 29%, P = 0.250), MI (1% vs. 3%, P = 1.000), UA rehospitalization (12% vs. 15%, P = 0.631), repeat revascularization (10% vs. 18%, P = 0.149), and ischemic stroke (3% vs. 5%, P = 0.681) (Figure 5). In the incidence curve analysis, the occurrence of MACCE within the seven-year follow-up period was numerically lower in the high-intensity group than that in the low-to-moderate intensity group, with a hazard ratio of 0.698 (95% CI: 0.426−1.143, P = 0.153) (Figure 6).
| Characteristics | High-intensity statin (n = 74) | Low-to-moderate intensity statin (n = 74) | Total (n = 148) | P-value |
| General characteristics | ||||
| Age, yrs | 80.4 ± 3.8 | 80.5 ± 4.7 | 80.4 ± 4.3 | 0.893 |
| Sex, male | 36 (48.6%) | 39 (52.7%) | 75 (50.7%) | 0.622 |
| Body mass index, kg/m2 | 23.1 ± 3.4 | 23.5 ± 3.3 | 23.3 ± 3.3 | 0.486 |
| Height, cm | 158.2 ± 8.1 | 159.4 ± 8.0 | 158.8 ± 8.0 | 0.341 |
| Weight, kg | 57.6 ± 9.8 | 59.8 ± 10.2 | 58.7 ± 10.0 | 0.181 |
| Lipid profiles | ||||
| Total cholesterol, mg/dL | 169.6 ± 39.7 | 171.8 ± 43.9 | 170.7 ± 41.7 | 0.748 |
| Triglyceride, mg/dL | 98.6 ± 47.4 | 97.1 ± 46.5 | 98.0 ± 46.8 | 0.853 |
| HDL-C, mg/dL | 44.8 ± 9.0 | 46.7 ± 11.8 | 45.8 ± 10.5 | 0.279 |
| LDL-C, mg/dL | 103.5 ± 33.0 | 100.8 ± 34.0 | 102.1 ± 33.4 | 0.629 |
| Clinical presentation | ||||
| STEMI/NSTEMI | 38/36 (51.4%/48.6%) | 33/41 (44.6%/55.4%) | 71/77 (48.0%/52.0%) | 0.411 |
| Killip class I/II/III/IV | 52/5/12/5 (70.3%/6.8%/16.2%/6.8%) | 52/9/10/3 (70.3%/12.2%/13.5%/4.1%) | 104/14/22/8 (70.3%/9.5%/14.9%/5.4%) | 0.610 |
| Risk factors | ||||
| Hypertension | 51 (68.9%) | 53 (71.6%) | 104 (70.3%) | 0.719 |
| Diabetes mellitus | 19 (25.7%) | 26 (35.1%) | 45 (30.4%) | 0.211 |
| Dyslipidemia | 18 (24.3%) | 25 (33.8%) | 43 (29.1%) | 0.205 |
| Smoking, current/former/never | 9/20/45 (12.2%/27.0%/60.8%) | 5/20/49 (6.8%/27.0%/66.2%) | 14/40/94 (9.5%/27.0%/63.5%) | 0.519 |
| Prior MI | 1 (1.4%) | 4 (5.4%) | 5 (3.4%) | 0.366 |
| Prior PCI | 11 (14.9%) | 19 (25.7%) | 30 (20.3%) | 0.102 |
| Prior CABG | 3 (4.1%) | 3 (4.1%) | 6 (4.1%) | 1.000 |
| Prior stroke | 7 (9.5%) | 13 (17.6%) | 20 (13.5%) | 0.149 |
| Prior CHF | 0 | 1 (1.4%) | 1 (0.7%) | 1.000 |
| Prior CKD | 4 (5.4%) | 7 (9.5%) | 11 (7.4%) | 0.347 |
| Laboratory findings | ||||
| CK-MB, ng/mL | 60.4 ± 135.5 | 53.7 ± 104.9 | 57.0 ± 120.8 | 0.737 |
| Troponin-I, ng/mL | 77.9 ± 121.0 | 62.5 ± 113.4 | 70.2 ± 117.1 | 0.426 |
| Serum creatinine, mg/dL | 1.20 ± 0.86 | 1.40 ± 1.62 | 1.30 ± 1.30 | 0.345 |
| eGFR by MDRD, mL/min per 1.73 m2 | 63.9 ± 25.4 | 63.1 ± 28.0 | 63.5 ± 26.6 | 0.856 |
| Glucose, mg/dL | 88.5 ± 17.7 | 89.2 ± 21.3 | 88.8 ± 19.5 | 0.831 |
| LVEF, % | 48.8 ± 13.2 | 51.0 ± 11.6 | 49.9 ± 12.4 | 0.284 |
| LVEDD, mm | 47.4 ± 5.2 | 47.3 ± 6.8 | 47.4 ± 6.0 | 0.930 |
| LVESD, mm | 33.7 ± 6.9 | 32.8 ± 7.3 | 33.2 ± 7.1 | 0.477 |
| Systolic BP, mmHg | 139.3 ± 27.6 | 142.6 ± 30.4 | 141.0 ± 29.0 | 0.486 |
| Diastolic BP, mmHg | 75.4 ± 19.0 | 74.6 ± 19.1 | 75.0 ± 19.0 | 0.792 |
| Heart rate, beat/ mim | 76.6 ± 20.4 | 74.5 ± 19.5 | 75.5 ± 20.0 | 0.508 |
| CAG findings | ||||
| CAD extent, 0/1/2/3 vessel disease | 15/25/34 (20.3%/33.8%/45.9%) | 19/23/32 (25.7%/31.1%/43.2%) | 34/48/66 (23.0%/32.4%/44.6%) | 0.735 |
| Left main disease | 6 (8.1%) | 7 (9.5%) | 13 (8.8%) | 0.772 |
| Treatment strategy | ||||
| Thrombolysis | 1 (1.4%) | 1 (1.4%) | 2 (1.4%) | 1.000 |
| PCI | 66 (89.2%) | 67 (90.5%) | 133 (89.9%) | 0.785 |
| CABG | 3 (4.1%) | 3 (4.1%) | 6 (4.1%) | 1.000 |
| Discharge medication | ||||
| Aspirin | 74 (100.0%) | 74 (100.0%) | 148 (100.0%) | − |
| P2Y12 inhibitor | 74 (100.0%) | 74 (100.0%) | 148 (100.0%) | − |
| Beta blocker | 58 (78.4%) | 57 (77.0%) | 115 (77.7%) | 0.843 |
| ACEI or ARB | 58 (78.4%) | 57 (77.0%) | 115 (77.7%) | 0.843 |
| Calcium channel blocker | 10 (13.5%) | 14 (18.9%) | 24 (16.2%) | 0.372 |
| Loop diuretics | 24 (32.4%) | 22 (29.7%) | 46 (31.1%) | 0.722 |
| Spironolactone | 10 (13.5%) | 4 (5.4%) | 14 (9.5%) | 0.092 |
| Vitamin K antagonist | 5 (6.8%) | 6 (8.1%) | 11 (7.4%) | 0.754 |
| Data are presented as means ± SD or n (%). ACEI: angiotensin converting enzyme inhibitor; ARB: angiotensin receptor blocker; BP: blood pressure; CABG: coronary artery bypass surgery; CAD: coronary artery disease; CHF: congestive heart failure; CKD: chronic kidney disease; CK-MB: creatine kinase-myocardial band; eGFR: estimated glomerular filtration rate; HDL-C: high-density lipoprotein cholesterol; LDL-C: low-density lipoprotein cholesterol; LVEDD: left ventricular end diastolic dimension; LVEF: left ventricular ejection fraction; LVESD: left ventricular end systolic dimension; MDRD: modification of diet in renal disease; MI: myocardial infarction; NSTEMI: non-ST-segment elevation myocardial infarction; PCI: percutaneous coronary intervention; STEMI: ST-segment elevation myocardial infarction. | ||||
DownLoad:
CSV
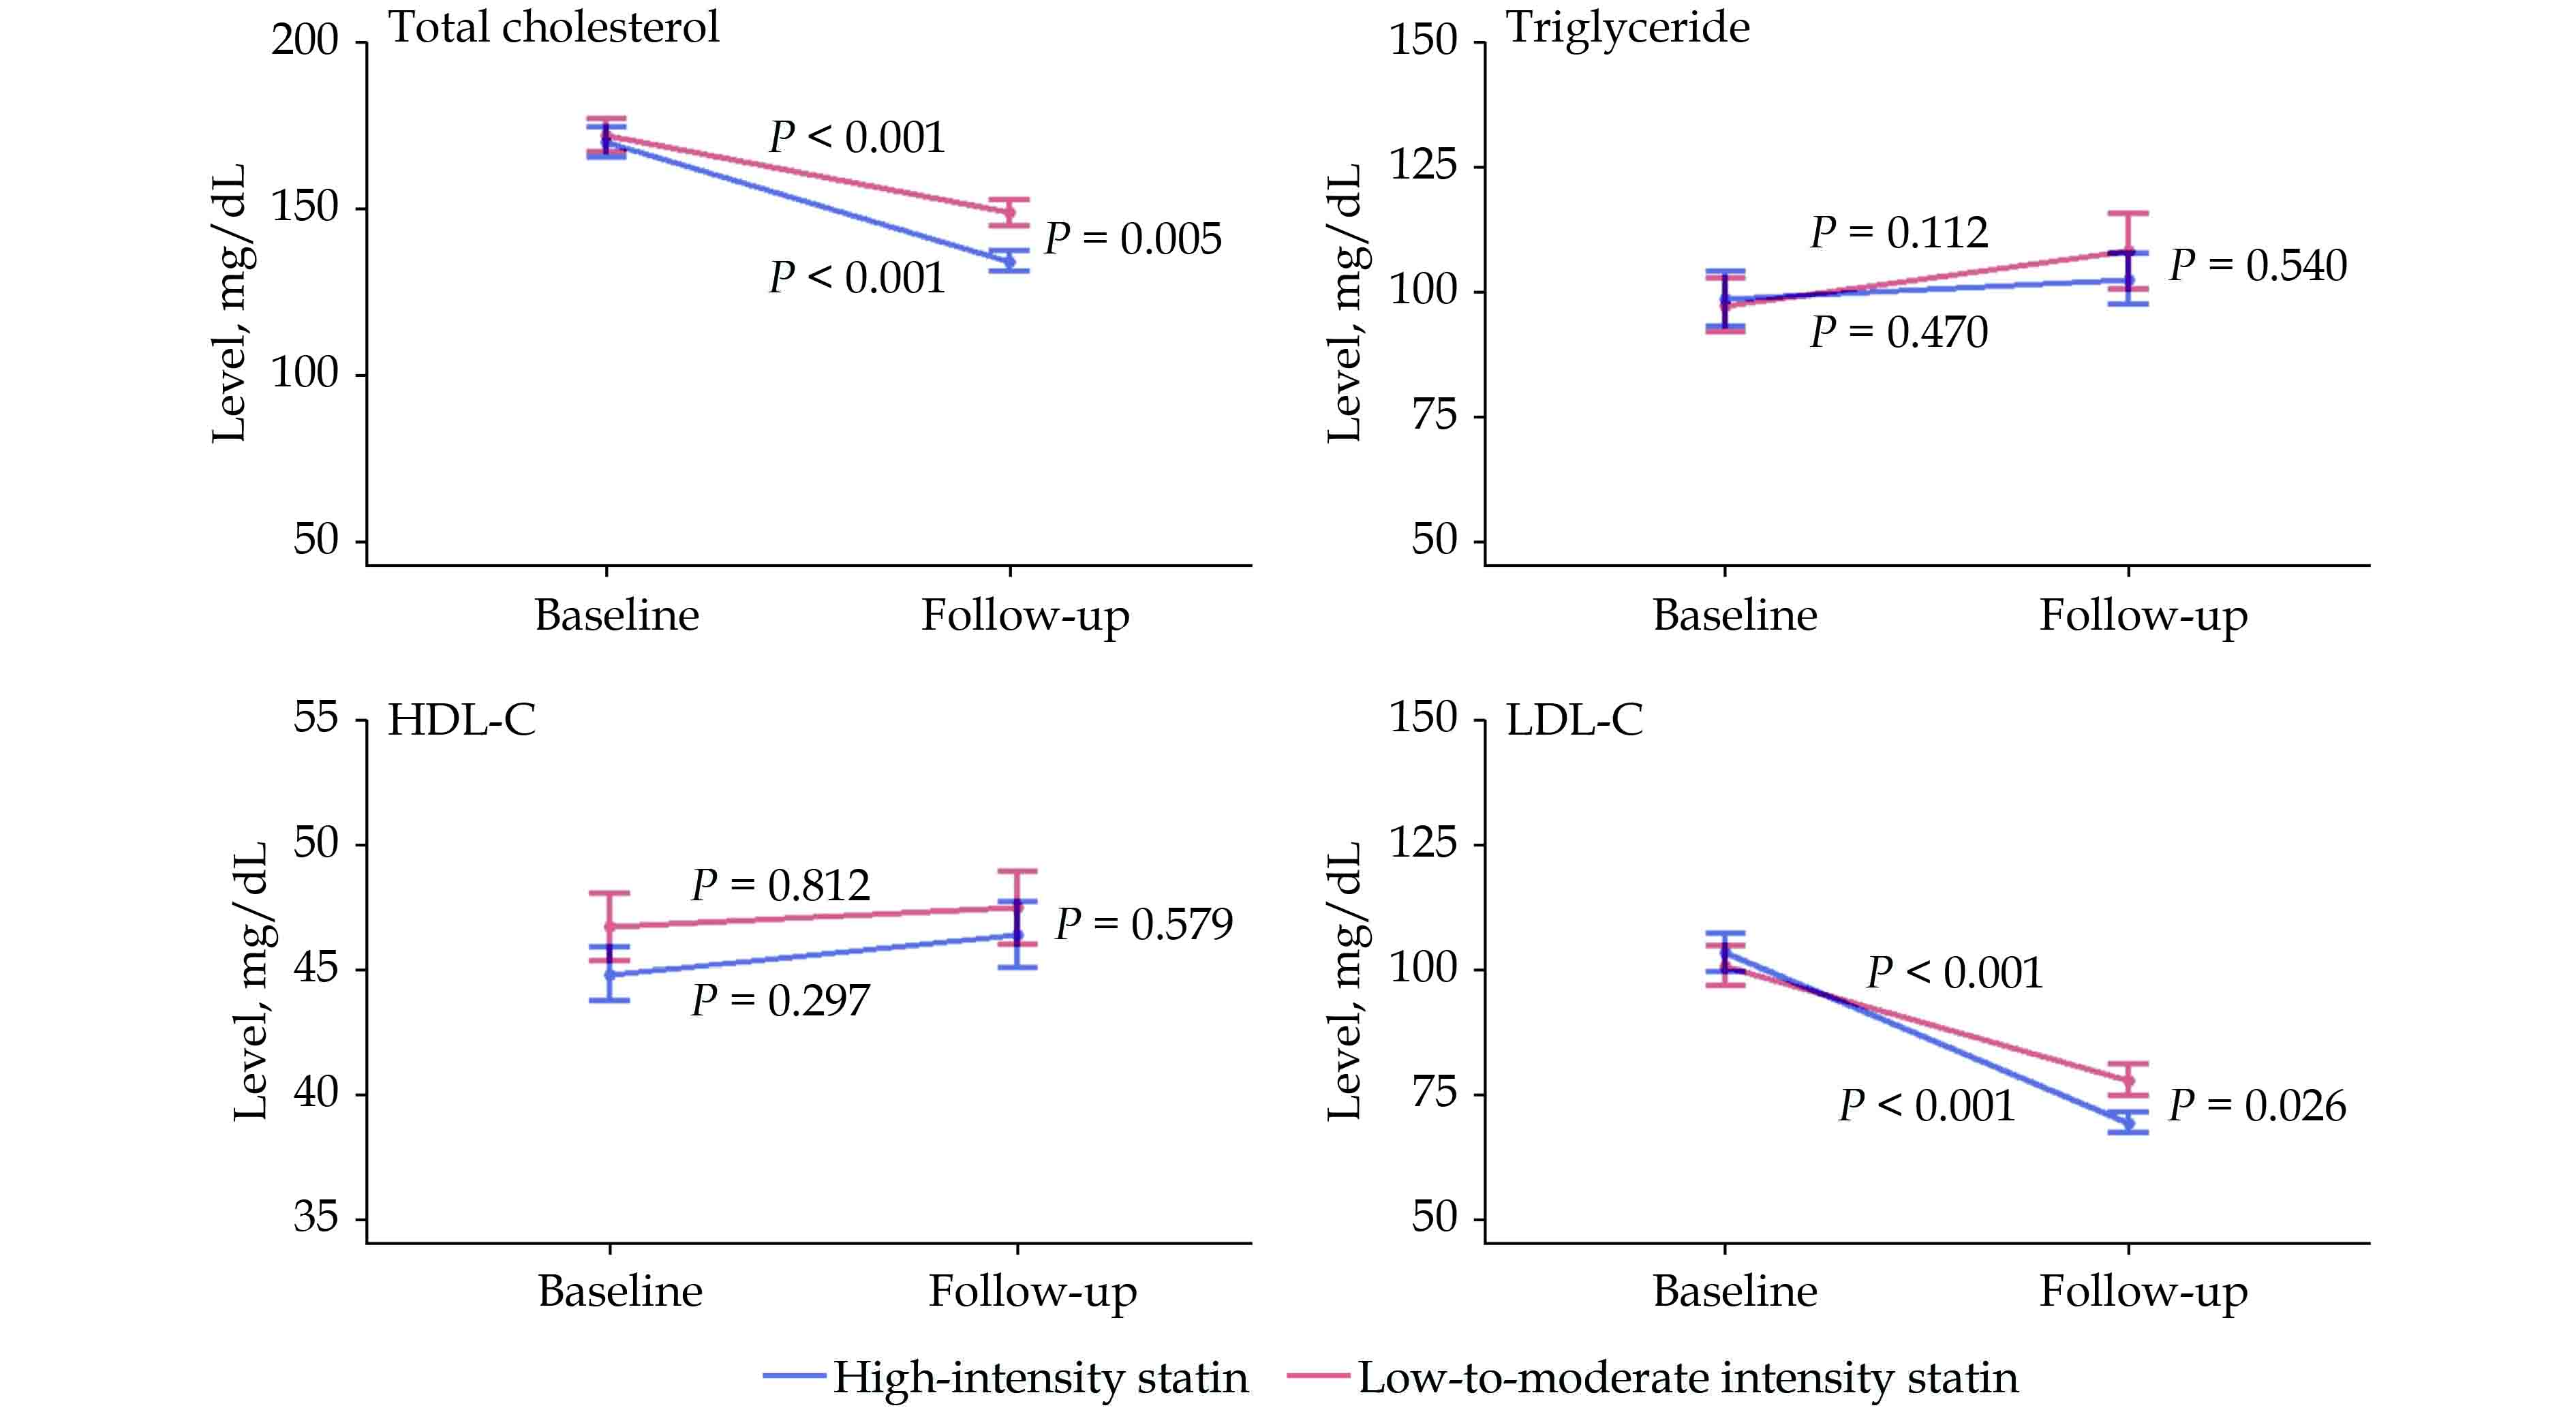
In the follow-up lipid profiles, performed a median of 2.4 years after index MI, both groups saw significant decreases in the total cholesterol (high-intensity group: 169.6 ± 40.9 mg/dL to 133.9 ± 25.3 mg/dL, P < 0.001; low-to-moderate intensity group: 171.6 ± 44.7 mg/dL to 148.8 ± 33.1 mg/dL, P < 0.001) and the LDL-C (high-intensity group: 101.2 ± 31.6 mg/dL to 69.4 ± 16.0 mg/dL, P < 0.001; low-to-moderate intensity group: 100.4 ± 34.9 mg/dL to 77.9 ± 25.9 mg/dL, P < 0.001). Among the follow-up lipid profiles, both total cholesterol (133.9 ± 25.3 mg/dL vs. 148.8 ± 33.1 mg/dL, P = 0.005) and LDL-C (69.4 ± 16.0 mg/dL vs. 77.9 ± 25.9 mg/dL, P = 0.026) levels were significantly lower in the high-intensity group than that in the low-to-moderate intensity group (Figure 7). In triglyceride or HDL-C, no significant changes from baseline and no significant difference in follow-up level were observed between the two groups.
The subgroup analysis according to the age of 80 years, sex, type of index MI, and baseline LDL-C level of 100 mg/dL showed no significant differences in the risk of MACCE among the subgroups (Table 4).
| Characteristics | Number of patients | Hazard ratio | 95% CI | P-value |
| Age, yrs | ||||
| 75–79 | 74 | 0.598 | 0.275–1.299 | 0.194 |
| ≥ 80 | 74 | 0.778 | 0.409–1.482 | 0.445 |
| Sex | ||||
| Male | 75 | 0.678 | 0.339–1.355 | 0.271 |
| Female | 73 | 0.728 | 0.360–1.475 | 0.379 |
| Index myocardial infarction | ||||
| ST-segment elevation myocardial infarction | 77 | 0.525 | 0.252–1.096 | 0.086 |
| Non-ST-segment elevation myocardial infarction | 71 | 0.905 | 0.465–1.760 | 0.769 |
| Low-density lipoprotein cholesterol, mg/dL | ||||
| ≥ 100 | 74 | 0.546 | 0.269–1.107 | 0.093 |
| < 100 | 74 | 0.919 | 0.460–1.838 | 0.842 |
DownLoad:
CSV
In this study, the frequency of prescription of high-intensity statin in older adult patients with MI increased annually during the study period. The high-intensity statin group showed significantly lower MACCE than that in the low-to-moderate intensity statin group in the propensity score-matched cohort. Furthermore, high-intensity statins effectively lowered total cholesterol and LDL-C compared to low-to-moderate intensity statins.
In our study, the annual prescription of high-intensity statin increased stiffly especially after the release of the 2013 ACC/AHA guideline on the treatment of blood cholesterol recommending its use for secondary prevention of MI. This trend was consistent with those seen in other East Asian countries, with both the frequency of statin prescription and the proportion of high-intensity statins seeing an increase.[16]
In our data, the proportion of high-intensity statin at discharge was 24%, similar to the 23.5% reported in a previous United States nationwide report on the use of high-intensity statin as secondary prevention of atherosclerotic cardiovascular disease for patients aged over 75 years.[17] There were no age-related differences in the frequency of statin prescription as the rate of prescription of high-intensity statins was similar in extremely old patients over 90 years. There was a previous report on the tendency of physicians to prescribe fewer statins in patients whose life expectancies were expected to be short, such as high-risk patients and extremely old ages.[18] However, this was not observed in our data.
Recent primary prevention studies have demonstrated the effect of statin on all-cause and cardiovascular mortalities,[19] and on composite of cardiovascular death, MI, and stroke,[20] in adults at least 75 years old. In the aspect of secondary prevention in older adults, however, previous Korean reports have shown that the effect of high-intensity statin was not significantly better than that of low-to-moderate intensity statin in older adult patients.[21–23] Above-mentioned studies, however, have tended to classify patients based on the dosages of statins prescribed at the time of discharge. Meanwhile, our data revealed that statin intensity changed at least once during the follow-up period in almost one-third of the patients. Therefore, classifying the patient groups according to the discharge medications may lead to incorrect conclusions. We classified the patients based on the dosages prescribed for most of the follow-up period, the three-year main intensity. As such, in contrast with the previous data, our results showed that the seven-year MACCE occurred less in the high-intensity statin group, suggesting that this might be beneficial in older adult patients with MI.
In this study, the total cholesterol and LDL-C levels were significantly decreased from baseline in both statin intensity groups, with a more significant decline seen in the high-intensity statin group. These findings were consistent with the changes in lipid profiles in previous prospective statin intensity trials.[11–13,24] Meanwhile, no significant changes were noted in the triglyceride and HDL-C levels, consistent with the varying results in previous reports.[11,24]
This study had some limitations. Firstly, this was a retrospective study. Therefore, the baseline characteristics of the patients were not well balanced. However, we tried to investigate and adjust as many baseline characteristics as possible through a thorough medical record review and by utilizing propensity score matching, although there might have been hidden unadjusted confounding variables. Secondly, there were no data on the adverse effects of statins, which may be important due to the previous reports of higher frequency of adverse effects in high-intensity statins compared to low-to-moderate intensity statins.[11,13,14] However, another report suggested that adverse effects did not increase in the older adult patients compared to those in younger patients.[17] Therefore, it might be possible to assume that older adult patients have adverse effects similar to those in younger patients. Thirdly, the exact cause of death was not investigated since many patients died at home or in other hospitals. Last but not least, the size of the study population was small, especially after propensity score matching. To overcome this limitation, we investigated longer-term follow-up data than previous reports,[21–23] which showed outcome differences as early as six months to two years.[24,25]
In older adult patients with MI, the use of high-intensity statin significantly reduced the occurrence of MACCE in comparison to low-to-moderate intensity for up to seven years of follow-up. It is anticipated that further large-scale prospective studies on statin intensity, especially in older adult patients, will confirm our results and reinforce statin treatment in older adult patients.
All authors had no conflicts of interest to disclose.
| [1] |
Benjamin EJ, Muntner P, Alonso A, et al. Heart disease and stroke statistics-2019 update: a report from the American Heart Association. Circulation 2019; 139: e56−e528. doi: 10.1161/CIR.0000000000000659
|
| [2] |
Stone NJ, Robinson JG, Lichtenstein AH, et al. 2013 ACC/AHA guideline on the treatment of blood cholesterol to reduce atherosclerotic cardiovascular risk in adults: a report of the American College of Cardiology/American Heart Association Task Force on Practice Guidelines. J Am Coll Cardiol 2014; 63: 2889−2934. doi: 10.1016/j.jacc.2013.11.002
|
| [3] |
National Cholesterol Education Program (NCEP) Expert Panel on Detection, Evaluation, and Treatment of High Blood Cholesterol in Adults (Adult Treatment Panel III). Third Report of the National Cholesterol Education Program (NCEP) Expert Panel on Detection, Evaluation, and Treatment of High Blood Cholesterol in Adults (Adult Treatment Panel III) final report. Circulation 2002; 106: 3143−3421. doi: 10.1161/circ.106.25.3143
|
| [4] |
Antman EM, Anbe DT, Armstrong PW, et al. ACC/AHA guidelines for the management of patients with ST-elevation myocardial infarction; a report of the American College of Cardiology/American Heart Association Task Force on Practice Guidelines (Committee to Revise the 1999 Guidelines for the Management of patients with acute myocardial infarction). J Am Coll Cardiol 2004; 44: E1−E211. doi: 10.1016/j.jacc.2004.07.014
|
| [5] |
Grundy SM, Cleeman JI, Merz CN, et al. Implications of recent clinical trials for the National Cholesterol Education Program Adult Treatment Panel III guidelines. Circulation 2004; 110: 227−239. doi: 10.1161/01.CIR.0000133317.49796.0E
|
| [6] |
Anderson JL, Adams CD, Antman EM, et al. ACC/AHA 2007 guidelines for the management of patients with unstable angina/non-ST-Elevation myocardial infarction: a report of the American College of Cardiology/American Heart Association Task Force on Practice Guidelines (Writing Committee to Revise the 2002 Guidelines for the Management of Patients With Unstable Angina/Non-ST-Elevation Myocardial Infarction) developed in collaboration with the American College of Emergency Physicians, the Society for Cardiovascular Angiography and Interventions, and the Society of Thoracic Surgeons endorsed by the American Association of Cardiovascular and Pulmonary Rehabilitation and the Society for Academic Emergency Medicine. J Am Coll Cardiol 2007; 50: e1−e157. doi: 10.1016/j.jacc.2007.11.004
|
| [7] |
Grundy SM, Stone NJ, Bailey AL, et al. 2018 AHA/ACC/AACVPR/AAPA/ABC/ACPM/ADA/AGS/APhA/ASPC/NLA/PCNA guideline on the management of blood cholesterol: a report of the American College of Cardiology/American Heart Association Task Force on Clinical Practice Guidelines. Circulation 2019; 139: e1082−e1143. doi: 10.1161/CIR.0000000000000625
|
| [8] |
Mach F, Baigent C, Catapano AL, et al. 2019 ESC/EAS guidelines for the management of dyslipidaemias: lipid modification to reduce cardiovascular risk. Eur Heart J 2020; 41: 111−188. doi: 10.1093/eurheartj/ehz455
|
| [9] |
Collins R, Reith C, Emberson J, et al. Interpretation of the evidence for the efficacy and safety of statin therapy. Lancet 2016; 388: 2532−2561. doi: 10.1016/S0140-6736(16)31357-5
|
| [10] |
Armitage J, Baigent C, Barnes E, et al. Efficacy and safety of statin therapy in older people: a meta-analysis of individual participant data from 28 randomised controlled trials. Lancet 2019; 393: 407−415. doi: 10.1016/S0140-6736(18)31942-1
|
| [11] |
Pedersen TR, Faergeman O, Kastelein JJ, et al. High-dose atorvastatin vs usual-dose simvastatin for secondary prevention after myocardial infarction: the IDEAL study: a randomized controlled trial. JAMA 2005; 294: 2437−2445. doi: 10.1001/jama.294.19.2437
|
| [12] |
de Lemos JA, Blazing MA, Wiviott SD, et al. Early intensive vs a delayed conservative simvastatin strategy in patients with acute coronary syndromes: phase Z of the A to Z trial. JAMA 2004; 292: 1307−1316. doi: 10.1001/jama.292.11.1307
|
| [13] |
Armitage J, Bowman L, Wallendszus K, et al. Intensive lowering of LDL cholesterol with 80 mg versus 20 mg simvastatin daily in 12, 064 survivors of myocardial infarction: a double-blind randomised trial. Lancet 2010; 376: 1658−1669. doi: 10.1016/S0140-6736(10)60310-8
|
| [14] |
LaRosa JC, Grundy SM, Waters DD, et al. Intensive lipid lowering with atorvastatin in patients with stable coronary disease. N Engl J Med 2005; 352: 1425−1435. doi: 10.1056/NEJMoa050461
|
| [15] |
Thygesen K, Alpert JS, Jaffe AS, et al. Fourth universal definition of myocardial infarction (2018). Eur Heart J 2019; 40: 237−269. doi: 10.1093/eurheartj/ehy462
|
| [16] |
Liu Y, Lv X, Xie N, et al. Time trends analysis of statin prescription prevalence, therapy initiation, dose intensity, and utilization from the hospital information system of Jinshan Hospital, Shanghai (2012–2018). BMC Cardiovasc Disord 2020; 20: 201. doi: 10.1186/s12872-020-01482-5
|
| [17] |
Nanna MG, Navar AM, Wang TY, et al. Statin use and adverse effects among adults > 75 years of age: insights from the patient and Provider Assessment of Lipid Management (PALM) registry. J Am Heart Assoc 2018; 7: e008546. doi: 10.1161/JAHA.118.008546
|
| [18] |
Benner JS, Glynn RJ, Mogun H, et al. Long-term persistence in use of statin therapy in elderly patients. JAMA 2002; 288: 455−461. doi: 10.1001/jama.288.4.455
|
| [19] |
Orkaby AR, Driver JA, Ho YL, et al. Association of statin use with all-cause and cardiovascular mortality in US veterans 75 years and older. JAMA 2020; 324: 68−78. doi: 10.1001/jama.2020.7848
|
| [20] |
Zhou Z, Ofori-Asenso R, Curtis AJ, et al. Association of statin use with disability-free survival and cardiovascular disease among healthy older adults. J Am Coll Cardiol 2020; 76: 17−27. doi: 10.1016/j.jacc.2020.05.016
|
| [21] |
Kim M, Kim HK, Ahn Y, et al. Comparing high-intensity versus low-to moderate-intensity statin therapy in Korean patients with acute myocardial infarction. J Lipid Atheroscler 2014; 3: 97. doi: 10.12997/jla.2014.3.2.97
|
| [22] |
Park MW, Park GM, Han S, et al. Moderate-intensity versus high-intensity statin therapy in Korean patients with angina undergoing percutaneous coronary intervention with drug-eluting stents: a propensity-score matching analysis. PLoS One 2018; 13: e0207889. doi: 10.1371/journal.pone.0207889
|
| [23] |
Hwang D, Kim HK, Lee JM, et al. Effects of statin intensity on clinical outcome in acute myocardial infarction patients. Circ J 2018; 82: 1112−1120. doi: 10.1253/circj.CJ-17-1221
|
| [24] |
Cannon CP, Braunwald E, McCabe CH, et al. Intensive versus moderate lipid lowering with statins after acute coronary syndromes. N Engl J Med 2004; 350: 1495−1504. doi: 10.1056/NEJMoa040583
|
| [25] |
Randomised trial of cholesterol lowering in 4444 patients with coronary heart disease: the Scandinavian Simvastatin Survival Study (4S). Randomised trial of cholesterol lowering in 4444 patients with coronary heart disease: the Scandinavian Simvastatin Survival Study (4S). Lancet 1994; 344: 1383−1389. doi: 10.1016/s0140-6736(94)90566-5
|
Figures(7) / Tables(4)
Supported by: Beijing Renhe Information Technology Co., Ltd. 
| Characteristics | High-intensity statin (n = 81) | Moderate-intensity statin (n = 356) | Low-intensity statin (n = 9) | No-statin (n = 100) | Total (n = 546) | P-value |
| General characteristics | ||||||
| Age, yrs | 80.3 ± 3.9 | 80.2 ± 4.3 | 83.1 ± 7.2 | 81.1 ± 5.1 | 80.5 ± 4.5 | 0.107 |
| Sex, male | 37 (45.7%) | 184 (51.7%) | 6 (66.7%) | 50 (50.0%) | 277 (50.7%) | 0.595 |
| Body mass index, kg/m2 | 23.1 ± 3.4 | 22.8 ± 3.9 | 21.5 ± 4.2 | 21.3 ± 3.1 | 22.6 ± 3.8 | 0.002 |
| Height, cm | 157.7 ± 7.9 | 158.8 ± 8.8 | 161.1 ± 7.6 | 158.0 ± 9.8 | 158.5 ± 8.9 | 0.556 |
| Weight, kg | 57.3 ± 9.6 | 57.4 ± 11.2 | 56.3 ± 13.3 | 53.5 ± 10.4 | 56.7 ± 11.0 | 0.015 |
| Lipid profiles | ||||||
| Total cholesterol, mg/dL | 173.4 ± 42.3 | 164.1 ± 39.9 | 133.4 ± 22.0 | 143.9 ± 41.3 | 161.3 ± 41.4 | < 0.001 |
| Triglyceride, mg/dL | 99.0 ± 48.4 | 105.3 ± 64.4 | 69.9 ± 22.9 | 89.6 ± 56.6 | 100.9 ± 60.7 | 0.053 |
| HDL-C, mg/dL | 45.0 ± 9.2 | 44.2 ± 13.8 | 46.2 ± 12.2 | 43.2 ± 12.6 | 44.2 ± 12.9 | 0.779 |
| LDL-C, mg/dL | 106.4 ± 35.1 | 97.6 ± 33.2 | 67.8 ± 16.2 | 81.7 ± 34.0 | 95.6 ± 34.4 | < 0.001 |
| Clinical presentation | ||||||
| STEMI/NSTEMI | 40/41 (49.4%/50.6%) | 163/193 (45.8%/54.2%) | 6/3 (66.7%/33.3%) | 41/59 (41.0%/59.0%) | 250/296 (45.8%/54.2%) | 0.403 |
| Killip class I/II/III/IV | 55/6/13/7 (67.9%/7.4%/16.0%/8.6%) | 233/53/45/25 (65.4%/14.9%/12.6%/7.0%) | 5/0/1/3 (55.6%/0/11.1%/33.3%) | 60/14/19/7 (60.0%/14.0%/19.0%/7.0%) | 353/73/78/42 (64.7%/13.4%/14.3%/7.7%) | 0.087 |
| Risk factors | ||||||
| Hypertension | 57 (70.4%) | 232 (65.2%) | 7 (77.8%) | 70 (70.0%) | 366 (67.0%) | 0.607 |
| Diabetes mellitus | 22 (27.2%) | 109 (30.6%) | 2 (22.2%) | 31 (31.0%) | 164 (30.0%) | 0.877 |
| Dyslipidemia | 20 (24.7%) | 70 (19.7%) | 0 | 16 (16.0%) | 106 (19.4%) | 0.224 |
| Smoking current/former/never | 10/20/51 (12.3%/24.7%/63.0%) | 54/102/200 (15.2%/28.7%/56.2%) | 2/3/4 (22.2%/33.3%/44.4%) | 17/30/53 (17.0%/30.0%/53.0%) | 83/155/308 (15.2%/28.4%/56.4%) | 0.862 |
| Prior MI | 2 (2.5%) | 20 (5.6%) | 1 (11.1%) | 8 (8.0%) | 31 (5.7%) | 0.382 |
| Prior PCI | 13 (16.0%) | 50 (14.0%) | 2 (22.2%) | 8 (8.0%) | 73 (13.4%) | 0.291 |
| Prior CABG | 4 (4.9%) | 9 (2.5%) | 0 | 4 (4.0%) | 17 (3.1%) | 0.604 |
| Prior stroke | 7 (8.6%) | 36 (10.1%) | 2 (22.2%) | 12 (12.0%) | 57 (10.4%) | 0.590 |
| Prior CHF | 2 (2.5%) | 1 (0.3%) | 0 | 5 (5.0%) | 8 (1.5%) | 0.005 |
| Prior CKD | 4 (4.9%) | 19 (5.3%) | 0 | 11 (11.0%) | 34 (6.2%) | 0.157 |
| Laboratory findings | ||||||
| CK-MB, ng/mL | 56.7 ± 130.3 | 51.6 ± 102.1 | 58.8 ± 116.5 | 53.0 ± 84.1 | 52.8 ± 103.8 | 0.979 |
| Troponin-I, ng/mL | 75.9 ± 117.4 | 60.6 ± 94.0 | 49.1 ± 62.9 | 63.2 ± 111.6 | 63.2 ± 100.6 | 0.636 |
| NT-proBNP, pg/mL | 5231.5 ± 8794.3 | 5286.7 ± 11590.9 | 2812.1 ± 4426.8 | 9769.7 ± 21349.5 | 6055.3 ± 13584.0 | 0.044 |
| Serum creatinine, mg/dL | 1.16 ± 0.84 | 1.24 ± 0.96 | 1.06 ± 0.34 | 1.46 ± 1.19 | 1.27 ± 0.98 | 0.154 |
| eGFR by MDRD, mL/min per 1.73 m2 | 65.3 ± 25.9 | 62.7 ± 26.8 | 68.7 ± 26.4 | 57.6 ± 29.9 | 62.2 ± 27.3 | 0.216 |
| Glucose, mg/dL | 92.0 ± 28.6 | 88.3 ± 21.7 | 88.7 ± 18.5 | 87.6 ± 27.9 | 88.7 ± 24.0 | 0.618 |
| Hemoglobin A1c, % | 5.9 ± 0.7 | 5.9 ± 0.7 | 5.9 ± 0.5 | 5.9 ± 0.9 | 5.9 ± 0.7 | 0.674 |
| LVEF, % | 48.5 ± 13.1 | 51.2 ± 12.4 | 51.5 ± 16.2 | 48.7 ± 12.8 | 50.3 ± 12.7 | 0.164 |
| LVEDD, mm | 47.4 ± 5.3 | 47.7 ± 6.4 | 49.8 ± 11.7 | 47.3 ± 6.4 | 47.6 ± 6.3 | 0.686 |
| LVESD, mm | 34.0 ± 7.0 | 33.0 ± 7.5 | 35.7 ± 13.0 | 33.6 ± 7.3 | 33.3 ± 7.5 | 0.502 |
| Systolic BP, mmHg | 138.0 ± 29.0 | 138.3 ± 33.1 | 126.6 ± 27.2 | 138.0 ± 32.0 | 138.0 ± 32.2 | 0.760 |
| Diastolic BP, mmHg | 74.7 ± 19.5 | 74.4 ± 18.7 | 69.2 ± 14.2 | 74.0 ± 14.6 | 74.3 ± 18.1 | 0.856 |
| Heart rate, beat/ mim | 77.0 ± 19.8 | 77.1 ± 22.3 | 85.1 ± 33.6 | 83.0 ± 23.2 | 78.3 ± 22.4 | 0.086 |
| CAG findings | ||||||
| CAD extent 0/1/2/3 vessel disease | 0/15/26/40 (0/18.5%/32.1%/49.4%) | 1/87/109/159 (0.3%/24.4%/30.6%/44.7%) | 0/3/3/2 (0/37.5%/37.5%/25.0%) | 1/21/26/52 (1.0%/21.0%/26.0%/52.0%) | 2/126/164/253 (0.4%/23.1%/30.1%/6.4%) | 0.729 |
| Left main disease | 6 (7.4%) | 30 (8.4%) | 0 | 13 (13.0%) | 49 (9.0%) | 0.370 |
| Treatment strategy | ||||||
| Thrombolysis | 1 (1.2%) | 7 (2.0%) | 0 | 4 (4.0%) | 12 (2.2%) | 0.542 |
| PCI | 73 (90.1%) | 304 (85.4%) | 7 (77.8%) | 72 (72.0%) | 456 (83.5%) | 0.004 |
| CABG | 3 (3.7%) | 31 (8.7%) | 0 | 19 (19.0%) | 53 (9.7%) | 0.002 |
| Discharge medication | ||||||
| Aspirin | 81 (100.0%) | 355 (99.7%) | 9 (100.0%) | 98 (98.0%) | 543 (99.5%) | 0.186 |
| P2Y12 inhibitor | 81 (100.0%) | 346 (97.2%) | 9 (100.0%) | 96 (96.0%) | 532 (97.4%) | 0.351 |
| Beta blocker | 65 (80.2%) | 233 (65.4%) | 6 (66.7%) | 58 (58.0%) | 362 (66.3%) | 0.017 |
| ACEI | 50 (61.7%) | 210 (59.0%) | 7 (77.8%) | 47 (47.0%) | 314 (57.5%) | 0.074 |
| ARB | 14 (17.3%) | 78 (21.9%) | 2 (22.2%) | 27 (27.0%) | 121 (22.2%) | 0.478 |
| ACEI or ARB | 62 (76.5%) | 278 (78.1%) | 9 (100.0%) | 72 (72.0%) | 421 (77.1%) | 0.225 |
| Calcium channel blocker | 11 (13.6%) | 60 (16.9%) | 0 | 23 (23.0%) | 94 (17.2%) | 0.172 |
| Loop diuretics | 27 (33.3%) | 162 (45.5%) | 3 (33.3%) | 54 (54.0%) | 246 (45.1%) | 0.041 |
| Spironolactone | 11 (13.6%) | 44 (12.4%) | 1 (11.1%) | 18 (18.0%) | 74 (13.6%) | 0.539 |
| Vitamin K antagonist | 6 (7.4%) | 18 (5.1%) | 0 | 8 (8.0%) | 32 (5.9%) | 0.540 |
| Data are presented as means ± SD or n (%). ACEI: angiotensin converting enzyme inhibitor; ARB: angiotensin receptor blocker; BP: blood pressure; CABG: coronary artery bypass surgery; CAD: coronary artery disease; CHF: congestive heart failure; CKD: chronic kidney disease; CK-MB: creatine kinase-myocardial band; eGFR: estimated glomerular filtration rate; HDL-C: high-density lipoprotein cholesterol; LDL-C: low-density lipoprotein cholesterol; LVEDD: left ventricular end diastolic dimension; LVEF: left ventricular ejection fraction; LVESD: left ventricular end systolic dimension; MDRD: modification of diet in renal disease; MI: myocardial infarction; NSTEMI: non-ST-segment elevation myocardial infarction; NT-proBNP: N-terminal pro-B-type natriuretic peptide; PCI: percutaneous coronary intervention; STEMI: ST-segment elevation myocardial infarction. | ||||||
DownLoad:
CSV
| Characteristics | High-intensity statin (n = 81) | Low-to-moderate intensity statin (n = 365) | P-value |
| General characteristics | |||
| Age, yrs | 80.3 ± 3.9 | 80.3 ± 4.4 | 0.954 |
| Sex, male | 37 (45.7%) | 190 (52.1%) | 0.299 |
| Body mass index, kg/m2 | 23.1 ± 3.4 | 22.8 ± 3.9 | 0.491 |
| Height, cm | 157.7 ± 7.9 | 158.8 ± 8.8 | 0.303 |
| Weight, kg | 57.3 ± 9.6 | 57.4 ± 11.3 | 0.937 |
| Lipid profiles | |||
| Total cholesterol, mg/dL | 173.4 ± 42.3 | 163.4 ± 39.8 | 0.043 |
| Triglyceride, mg/dL | 99.0 ± 48.4 | 104.4 ± 64.0 | 0.475 |
| HDL-C, mg/dL | 45.0 ± 9.2 | 44.2 ± 13.7 | 0.551 |
| LDL-C, mg/dL | 106.4 ± 35.1 | 96.9 ± 33.2 | 0.021 |
| Clinical presentation | |||
| STEMI/NSTEMI | 40/41 (49.4%/50.6%) | 169/196 (46.3%/53.7%) | 0.615 |
| Killip class I/II/III/IV | 55/6/13/7 (67.9%/7.4%/16.0%/8.6%) | 238/53/46/28 (65.2%/14.5%/12.6%/7.7%) | 0.615 |
| Risk factors | |||
| Hypertension | 57 (70.4%) | 239 (65.5%) | 0.399 |
| Diabetes mellitus | 22 (27.2%) | 111 (30.4%) | 0.563 |
| Dyslipidemia | 20 (24.7%) | 70 (19.2%) | 0.263 |
| Smoking, current/former/never | 10/20/51 (12.3%/24.7%/63.0%) | 56/105/204 (15.3%/28.8%/55.9%) | 0.503 |
| Prior MI | 2 (2.5%) | 21 (5.8%) | 0.401 |
| Prior PCI | 13 (16.0%) | 52 (14.2%) | 0.677 |
| Prior CABG | 4 (4.9%) | 9 (2.5%) | 0.267 |
| Prior stroke | 7 (8.6%) | 38 (10.4%) | 0.633 |
| Prior CHF | 2 (2.5%) | 1 (0.3%) | 0.086 |
| Prior CKD | 4 (4.9%) | 19 (5.2%) | 1.000 |
| Laboratory findings | |||
| CK-MB, ng/mL | 56.7 ± 130.3 | 51.8 ± 102.3 | 0.710 |
| Troponin-I, ng/mL | 75.9 ± 117.4 | 60.3 ± 93.3 | 0.196 |
| NT-proBNP, pg/mL | 5231.5 ± 8794.3 | 5232.1 ± 11483.8 | 1.000 |
| Serum creatinine, mg/dL | 1.16 ± 0.84 | 1.24 ± 0.95 | 0.528 |
| eGFR by MDRD, mL/min per 1.73 m2 | 65.3 ± 25.9 | 62.8 ± 26.8 | 0.440 |
| Glucose, mg/dL | 92.0 ± 28.6 | 88.3 ± 21.6 | 0.200 |
| Hemoglobin A1c, % | 5.85 ± 0.73 | 5.95 ± 0.68 | 0.282 |
| LVEF, % | 48.5 ± 13.1 | 51.2 ± 12.5 | 0.079 |
| LVEDD, mm | 47.4 ± 5.3 | 47.7 ± 6.5 | 0.620 |
| LVESD, mm | 34.0 ± 7.0 | 33.1 ± 7.6 | 0.300 |
| Systolic BP, mmHg | 138.0 ± 29.0 | 138.0 ± 33.0 | 0.987 |
| Diastolic BP, mmHg | 74.7 ± 19.5 | 74.2 ± 18.6 | 0.846 |
| Heart rate, beat/ mim | 77.0 ± 19.8 | 77.3 ± 22.6 | 0.896 |
| CAG findings | |||
| CAD extent, 0/1/2/3 vessel disease | 0/15/26/40 (0/18.5%/32.1%/49.4%) | 1/90/112/161 (0.3%/24.7%/30.8%/44.2%) | 0.630 |
| Left main disease | 6 (7.4%) | 30 (8.2%) | 0.803 |
| Treatment strategy | |||
| Thrombolysis | 1 (1.2%) | 7 (1.9%) | 1.000 |
| PCI | 73 (90.1%) | 311 (85.2%) | 0.247 |
| CABG | 3 (3.7%) | 31 (8.5%) | 0.142 |
| Discharge medication | |||
| Aspirin | 81 (100.0%) | 364 (99.7%) | 1.000 |
| P2Y12 inhibitor | 81 (100.0%) | 355 (97.3%) | 0.132 |
| Beta blocker | 65 (80.2%) | 239 (65.5%) | 0.010 |
| ACEI or ARB | 62 (76.5%) | 287 (78.6%) | 0.680 |
| Calcium channel blocker | 11 (13.6%) | 60 (16.4%) | 0.525 |
| Loop diuretics | 27 (33.3%) | 165 (45.2%) | 0.051 |
| Spironolactone | 11 (13.6%) | 45 (12.3%) | 0.758 |
| Vitamin K antagonist | 6 (7.4%) | 18 (4.9%) | 0.412 |
| Data are presented as means ± SD or n (%). ACEI: angiotensin converting enzyme inhibitor; ARB: angiotensin receptor blocker; BP: blood pressure; CABG: coronary artery bypass surgery; CAD: coronary artery disease; CHF: congestive heart failure; CKD: chronic kidney disease; CK-MB: creatine kinase-myocardial band; eGFR: estimated glomerular filtration rate; HDL-C: high-density lipoprotein cholesterol; LDL-C: low-density lipoprotein cholesterol; LVEDD: left ventricular end diastolic dimension; LVEF: left ventricular ejection fraction; LVESD: left ventricular end systolic dimension; MDRD: modification of diet in renal disease; MI: myocardial infarction; NSTEMI: non-ST-segment elevation myocardial infarction; NT-proBNP: N-terminal pro-B-type natriuretic peptide; PCI: percutaneous coronary intervention; STEMI: ST-segment elevation myocardial infarction. | |||
DownLoad:
CSV
| Characteristics | High-intensity statin (n = 74) | Low-to-moderate intensity statin (n = 74) | Total (n = 148) | P-value |
| General characteristics | ||||
| Age, yrs | 80.4 ± 3.8 | 80.5 ± 4.7 | 80.4 ± 4.3 | 0.893 |
| Sex, male | 36 (48.6%) | 39 (52.7%) | 75 (50.7%) | 0.622 |
| Body mass index, kg/m2 | 23.1 ± 3.4 | 23.5 ± 3.3 | 23.3 ± 3.3 | 0.486 |
| Height, cm | 158.2 ± 8.1 | 159.4 ± 8.0 | 158.8 ± 8.0 | 0.341 |
| Weight, kg | 57.6 ± 9.8 | 59.8 ± 10.2 | 58.7 ± 10.0 | 0.181 |
| Lipid profiles | ||||
| Total cholesterol, mg/dL | 169.6 ± 39.7 | 171.8 ± 43.9 | 170.7 ± 41.7 | 0.748 |
| Triglyceride, mg/dL | 98.6 ± 47.4 | 97.1 ± 46.5 | 98.0 ± 46.8 | 0.853 |
| HDL-C, mg/dL | 44.8 ± 9.0 | 46.7 ± 11.8 | 45.8 ± 10.5 | 0.279 |
| LDL-C, mg/dL | 103.5 ± 33.0 | 100.8 ± 34.0 | 102.1 ± 33.4 | 0.629 |
| Clinical presentation | ||||
| STEMI/NSTEMI | 38/36 (51.4%/48.6%) | 33/41 (44.6%/55.4%) | 71/77 (48.0%/52.0%) | 0.411 |
| Killip class I/II/III/IV | 52/5/12/5 (70.3%/6.8%/16.2%/6.8%) | 52/9/10/3 (70.3%/12.2%/13.5%/4.1%) | 104/14/22/8 (70.3%/9.5%/14.9%/5.4%) | 0.610 |
| Risk factors | ||||
| Hypertension | 51 (68.9%) | 53 (71.6%) | 104 (70.3%) | 0.719 |
| Diabetes mellitus | 19 (25.7%) | 26 (35.1%) | 45 (30.4%) | 0.211 |
| Dyslipidemia | 18 (24.3%) | 25 (33.8%) | 43 (29.1%) | 0.205 |
| Smoking, current/former/never | 9/20/45 (12.2%/27.0%/60.8%) | 5/20/49 (6.8%/27.0%/66.2%) | 14/40/94 (9.5%/27.0%/63.5%) | 0.519 |
| Prior MI | 1 (1.4%) | 4 (5.4%) | 5 (3.4%) | 0.366 |
| Prior PCI | 11 (14.9%) | 19 (25.7%) | 30 (20.3%) | 0.102 |
| Prior CABG | 3 (4.1%) | 3 (4.1%) | 6 (4.1%) | 1.000 |
| Prior stroke | 7 (9.5%) | 13 (17.6%) | 20 (13.5%) | 0.149 |
| Prior CHF | 0 | 1 (1.4%) | 1 (0.7%) | 1.000 |
| Prior CKD | 4 (5.4%) | 7 (9.5%) | 11 (7.4%) | 0.347 |
| Laboratory findings | ||||
| CK-MB, ng/mL | 60.4 ± 135.5 | 53.7 ± 104.9 | 57.0 ± 120.8 | 0.737 |
| Troponin-I, ng/mL | 77.9 ± 121.0 | 62.5 ± 113.4 | 70.2 ± 117.1 | 0.426 |
| Serum creatinine, mg/dL | 1.20 ± 0.86 | 1.40 ± 1.62 | 1.30 ± 1.30 | 0.345 |
| eGFR by MDRD, mL/min per 1.73 m2 | 63.9 ± 25.4 | 63.1 ± 28.0 | 63.5 ± 26.6 | 0.856 |
| Glucose, mg/dL | 88.5 ± 17.7 | 89.2 ± 21.3 | 88.8 ± 19.5 | 0.831 |
| LVEF, % | 48.8 ± 13.2 | 51.0 ± 11.6 | 49.9 ± 12.4 | 0.284 |
| LVEDD, mm | 47.4 ± 5.2 | 47.3 ± 6.8 | 47.4 ± 6.0 | 0.930 |
| LVESD, mm | 33.7 ± 6.9 | 32.8 ± 7.3 | 33.2 ± 7.1 | 0.477 |
| Systolic BP, mmHg | 139.3 ± 27.6 | 142.6 ± 30.4 | 141.0 ± 29.0 | 0.486 |
| Diastolic BP, mmHg | 75.4 ± 19.0 | 74.6 ± 19.1 | 75.0 ± 19.0 | 0.792 |
| Heart rate, beat/ mim | 76.6 ± 20.4 | 74.5 ± 19.5 | 75.5 ± 20.0 | 0.508 |
| CAG findings | ||||
| CAD extent, 0/1/2/3 vessel disease | 15/25/34 (20.3%/33.8%/45.9%) | 19/23/32 (25.7%/31.1%/43.2%) | 34/48/66 (23.0%/32.4%/44.6%) | 0.735 |
| Left main disease | 6 (8.1%) | 7 (9.5%) | 13 (8.8%) | 0.772 |
| Treatment strategy | ||||
| Thrombolysis | 1 (1.4%) | 1 (1.4%) | 2 (1.4%) | 1.000 |
| PCI | 66 (89.2%) | 67 (90.5%) | 133 (89.9%) | 0.785 |
| CABG | 3 (4.1%) | 3 (4.1%) | 6 (4.1%) | 1.000 |
| Discharge medication | ||||
| Aspirin | 74 (100.0%) | 74 (100.0%) | 148 (100.0%) | − |
| P2Y12 inhibitor | 74 (100.0%) | 74 (100.0%) | 148 (100.0%) | − |
| Beta blocker | 58 (78.4%) | 57 (77.0%) | 115 (77.7%) | 0.843 |
| ACEI or ARB | 58 (78.4%) | 57 (77.0%) | 115 (77.7%) | 0.843 |
| Calcium channel blocker | 10 (13.5%) | 14 (18.9%) | 24 (16.2%) | 0.372 |
| Loop diuretics | 24 (32.4%) | 22 (29.7%) | 46 (31.1%) | 0.722 |
| Spironolactone | 10 (13.5%) | 4 (5.4%) | 14 (9.5%) | 0.092 |
| Vitamin K antagonist | 5 (6.8%) | 6 (8.1%) | 11 (7.4%) | 0.754 |
| Data are presented as means ± SD or n (%). ACEI: angiotensin converting enzyme inhibitor; ARB: angiotensin receptor blocker; BP: blood pressure; CABG: coronary artery bypass surgery; CAD: coronary artery disease; CHF: congestive heart failure; CKD: chronic kidney disease; CK-MB: creatine kinase-myocardial band; eGFR: estimated glomerular filtration rate; HDL-C: high-density lipoprotein cholesterol; LDL-C: low-density lipoprotein cholesterol; LVEDD: left ventricular end diastolic dimension; LVEF: left ventricular ejection fraction; LVESD: left ventricular end systolic dimension; MDRD: modification of diet in renal disease; MI: myocardial infarction; NSTEMI: non-ST-segment elevation myocardial infarction; PCI: percutaneous coronary intervention; STEMI: ST-segment elevation myocardial infarction. | ||||
DownLoad:
CSV
| Characteristics | Number of patients | Hazard ratio | 95% CI | P-value |
| Age, yrs | ||||
| 75–79 | 74 | 0.598 | 0.275–1.299 | 0.194 |
| ≥ 80 | 74 | 0.778 | 0.409–1.482 | 0.445 |
| Sex | ||||
| Male | 75 | 0.678 | 0.339–1.355 | 0.271 |
| Female | 73 | 0.728 | 0.360–1.475 | 0.379 |
| Index myocardial infarction | ||||
| ST-segment elevation myocardial infarction | 77 | 0.525 | 0.252–1.096 | 0.086 |
| Non-ST-segment elevation myocardial infarction | 71 | 0.905 | 0.465–1.760 | 0.769 |
| Low-density lipoprotein cholesterol, mg/dL | ||||
| ≥ 100 | 74 | 0.546 | 0.269–1.107 | 0.093 |
| < 100 | 74 | 0.919 | 0.460–1.838 | 0.842 |
DownLoad:
CSV