OBJECTIVE Older adults with coronary artery disease (CAD) are at risk for frailty. However, little is known regarding transition in frailty measures over time or its impact on outcomes. We sought to determine the association of temporal change in frailty with long-term outcome in older adults with CAD.
METHODS We re-assessed for phenotypic frailty using the Fried index (0 = not frail; 1−2 = pre-frail; ≥ 3 frail) in a cohort of CAD patients ≥ 65 years old at 2 time points 5 years apart. Factors associated with frailty worsening were assessed with scatterplots and outcomes estimated using the Kaplan-Meier method. Cox models were used to assess the risk of worsening frailty on outcome.
RESULTS There were 45 subjects that completed both baseline and 5-year Fried frailty assessment. Mean age was 74.6 ± 5.9 and 30 (67%) were men. Frailty incidence increased over time: baseline (3% frail, 37% pre-frail); 5 years (10% frail, 40% pre-frail). Baseline factors were not predictors of worsening frailty score, while both slower walk time (r = 0.46; P = 0.004) and diminishing grip strength (r = −0.39; P = 0.01) were associated with worsening frailty transitions. In follow-up (median 5.2 years), long-term major adverse cardiac event (MACE) free survival (P = 0.12) or hospitalization (P = 0.98) was not different for those with worsening frailty score (referent: improved/unchanged frailty). Frailty worsening had a trend towards increased risk of MACE (HR = 1.86; 95% CI: 0.65−5.27, P = 0.25).
CONCLUSIONS Frailty transitions, specifically, declines in walk time and grip strength, were strongly associated with worsening frailty score in a cohort of older adults with CAD than were baseline indices, though frailty change status was not independently associated with MACE outcomes.
The geriatric syndrome of frailty is characterized by diminished resilience to physiologic stressors due, in part, to vulnerability in health reserves. It is postulated that the diminished homeostatic reserves place the susceptible older adult at increased risk for loss of independence, increased health utilization, diminished quality of life, and disability.[1] Frailty is not a binary phenomenon, but rather a continuum of functional and physiologic factors, such that even early elements of frailty have been shown to be associated with higher rates of cardiovascular events.[2] Although increasing age has been associated with frail features, age per se does not define frailty and differences between normal physiologic aging and frailty have distinct biological underpinnings.[3] Despite the variability in definitions for frailty across studies,[4–6] the phenotype of frailty has been associated with adverse outcomes in community-dwelling populations[7] and in patients with coronary artery disease (CAD).[8–10] A limitation of prior studies evaluating the relationship between frailty and outcomes has been measurement of frailty only as an exposure variable at baseline,[7,11] rather than evaluating how frailty features may change over time. The factors associated with incident frailty, or development of new frail features over time, is less understood and may potentially be identified as a target for intervention. In addition, identification of factors that have a protective effect (i.e., fewer frailty features over time) may also have important implications for management. Finally, the trajectory of change in frailty status has not been studied with respect to its association with important clinical outcomes.
In this study, our objective was to determine which frailty factors change over time to better characterize the frailty phenotype, given that frail features are neither static nor binary variables. To accomplish this, we re-measured frailty features in community dwelling patients with known CAD that had participated in an initial frailty prevalence study several years prior. By utilizing a 2nd wave assessment, we were uniquely able to study not only the relationship between baseline characteristics and frailty change status, but correlate change in frailty indices over time with long-term outcomes.
METHODS
Patient Population
This study received approval from the Institutional Review Board of the Mayo Clinic. Patients 65 years or older with a history of CAD, defined as a prior history of percutaneous or surgical coronary artery revascularization, prior myocardial infarction (MI), ischemia on prior functional study, or ≥ 50% stenosis in an epicardial vessel at invasive angiography, were prospectively enrolled in an observational study evaluating functional status, frailty, and sarcopenia at Mayo Clinic Health System-Franciscan Healthcare in La Crosse, WI (USA) from 2008 through 2012. Patients with residual neurological deficits after a stroke, severe Parkinson’s disease, or dementia were excluded from the study given the concern regarding validity of functional assessments in these patients. Baseline demographic and functional characteristics were collected as part of an initial (1st wave) observational study, which included assessment of the frailty phenotype by trained personnel. We used the 5-component Fried frailty score which included assessment for unintended weight loss (>10 lb in the preceding year), physical activity, exhaustion, gait speed (walking time over 15 feet), and grip strength.[4] Physical activity was measured by the short version of the Minnesota Leisure Time Activity questionnaire. Low physical activity was defined as < 383 Kcal/week for men and < 270 Kcal/week for women. Exhaustion was measured by the Center of Epidemiologic Studies-Depression’s subscale. The two items in this scale are: how often in the past week did the patient feel the following: (a) I felt that everything I did was an effort, and (b) I could not get going. Subjects who answered “a moderate amount of time (3−4 days)” or “most of the time” to either of the statements were categorized as meeting the exhaustion criteria for frailty. Gait speed was assessed as walking time across a 15-foot distance in an unobstructed, well-lit hallway. Participants walking with an assist device were permitted to do so for the test. Hand-grip strength was tested in the subject’s dominant hand using a Jamar® handgrip dynamometer (Bolingbrook, IL). Participants were told to squeeze as hard as possible and results were scored as kilograms. Cutoffs for values that constituted abnormal frailty measures are reported (Supplementary Table 1). A patient was defined as frail if they were found to have deficits in three or more core elements, pre-frail if they had deficits in 1−2 core elements, or non-frail if no deficits were identified.[4] In 2015, patients originally participating in the 1st wave study were contacted by mail for an in-person re-assessment of frailty features, which was approximately 5 years after initial study participation, allowing for assessment in temporal change of the frailty phenotype. The Fried frailty domains were performed from 1/2015–12/2015 as part of the 2nd wave assessment, which occurred several years after the initial frailty assessment. Follow-up was performed through review of medical records for important clinical outcomes, including death, myocardial infarction (MI), percutaneous coronary intervention (PCI), coronary artery bypass grafting (CABG), stroke or transient ischemic attack, or hospitalizations. A composite outcome of major adverse cardiac event (MACE) included all of the individual outcome components with the exception of hospitalization.
Statistical Analysis
Continuous variables were summarized as means ± SD and categorical variables were presented as frequencies (percentages). For ease in data interpretation, a “frailty worsening score” was developed to signify change in frailty from baseline (1st wave) to follow-up (2nd wave), where a positive score identified worsening frailty features while a negative score characterized fewer frailty features. Associations were tested with the frailty worsening score using scatterplots and using a trend test for binary variables and a correlation coefficient for continuous variables. Scatterplot smoothing lines were used for testing relationships between continuous variables. The occurrence of outcomes was estimated using the Kaplan-Meier method. Individual comparisons of the Kaplan-Meier estimates were completed using the log-rank test. Univariate Cox proportional hazard models were constructed for outcomes of interest, adjusting for selected covariates. Based upon these results, multivariate Cox proportional hazard models were then constructed, adjusting first for age and gender, then for age, gender and worsening frailty, and finally adjusting for age, gender, worsening frailty and any other covariates with a univariate P-value ≤ 0.15. Statistical significance is defined as a 2-tailed P value of less than 0.05. Statistical analyses were performed using SAS Version 9.4 (SAS Institute Inc., Cary, NC).
RESULTS
From the original cohort of 144 patients participating in the baseline frailty assessment, 47 patients responded to the mailed contact letter, consented to study participation, and underwent in-person reassessment of frailty. Complete baseline data was unavailable in two subjects, leaving a final cohort of 45 patients. Baseline characteristics between patients that responded to the contact letter and those that did not return for frailty reassessment were similar (data not shown). Table 1 lists the demographic characteristics of the study cohort. There were high rates of cardiovascular risk factors among study participants, including hypertension (89%), hyperlipidemia (66%), and diabetes (23%). Characteristics of frailty features at baseline and follow-up are shown in Table 2. Few patients were frail at baseline, consistent with known low prevalence of frailty in community dwelling participants. However, reassessment for frailty features several years later demonstrated higher rates of exhaustion, weight loss, low physical activity, and slower walk time as compared to baseline. Physical activity was significantly lower at follow-up as compared to baseline (P = 0.008). Frailty classifications showed fewer non-frail adults at follow-up with higher rates of pre-frail and frail phenotypes. Composite scores also confirmed accrual of frailty features as compared to baseline, with shifting of the frailty composite score towards greater deficits. There were 11 patients (28%) whose frailty classification worsened from baseline to follow-up, while only five patients (13%) had improvement.
Table
1.
Patient characteristics.
Characteristics
Overall
Age, yrs
74.6 ± 5.9
BMI, kg/m2
30.7 ± 5.6
Male sex
30 (67%)
Marital status
Married
32 (71%)
Single
4 (9%)
Divorced
3 (7%)
Widowed
6 (13%)
Smoking status
Never
19 (42%)
Former
25 (56%)
Current
1 (2%)
Hypertension
40 (89%)
Hyperlipidemia
30 (67%)
Diabetes
10 (22%)
Mod/severe renal failure
2 (4%)
CHF
Never
42 (93%)
Current
3 (7%)
Prior MI
8 (18%)
Prior PCI
6 (13%)
Prior CABG
13 (29%)
Stroke/TIA
1 (2%)
PAD
11 (24%)
Peptic ulcer disease
2 (4%)
Metastatic malignancy
2 (4%)
Chronic lung disease
4 (9%)
Ejection fraction ≤ 40%
4 (11%)
MMSE score
26.2 ± 2.1
Data are presented as mean ± SD or n (%). BMI: body mass index; CABG: coronary artery bypass grafting; CHF: congestive heart failure; MI: myocardial infarction; MMSE: mini-mental status exam; PAD: peptic ulcer disease; PCI: percutaneous coronary intervention; TIA: transient ischemic attack.
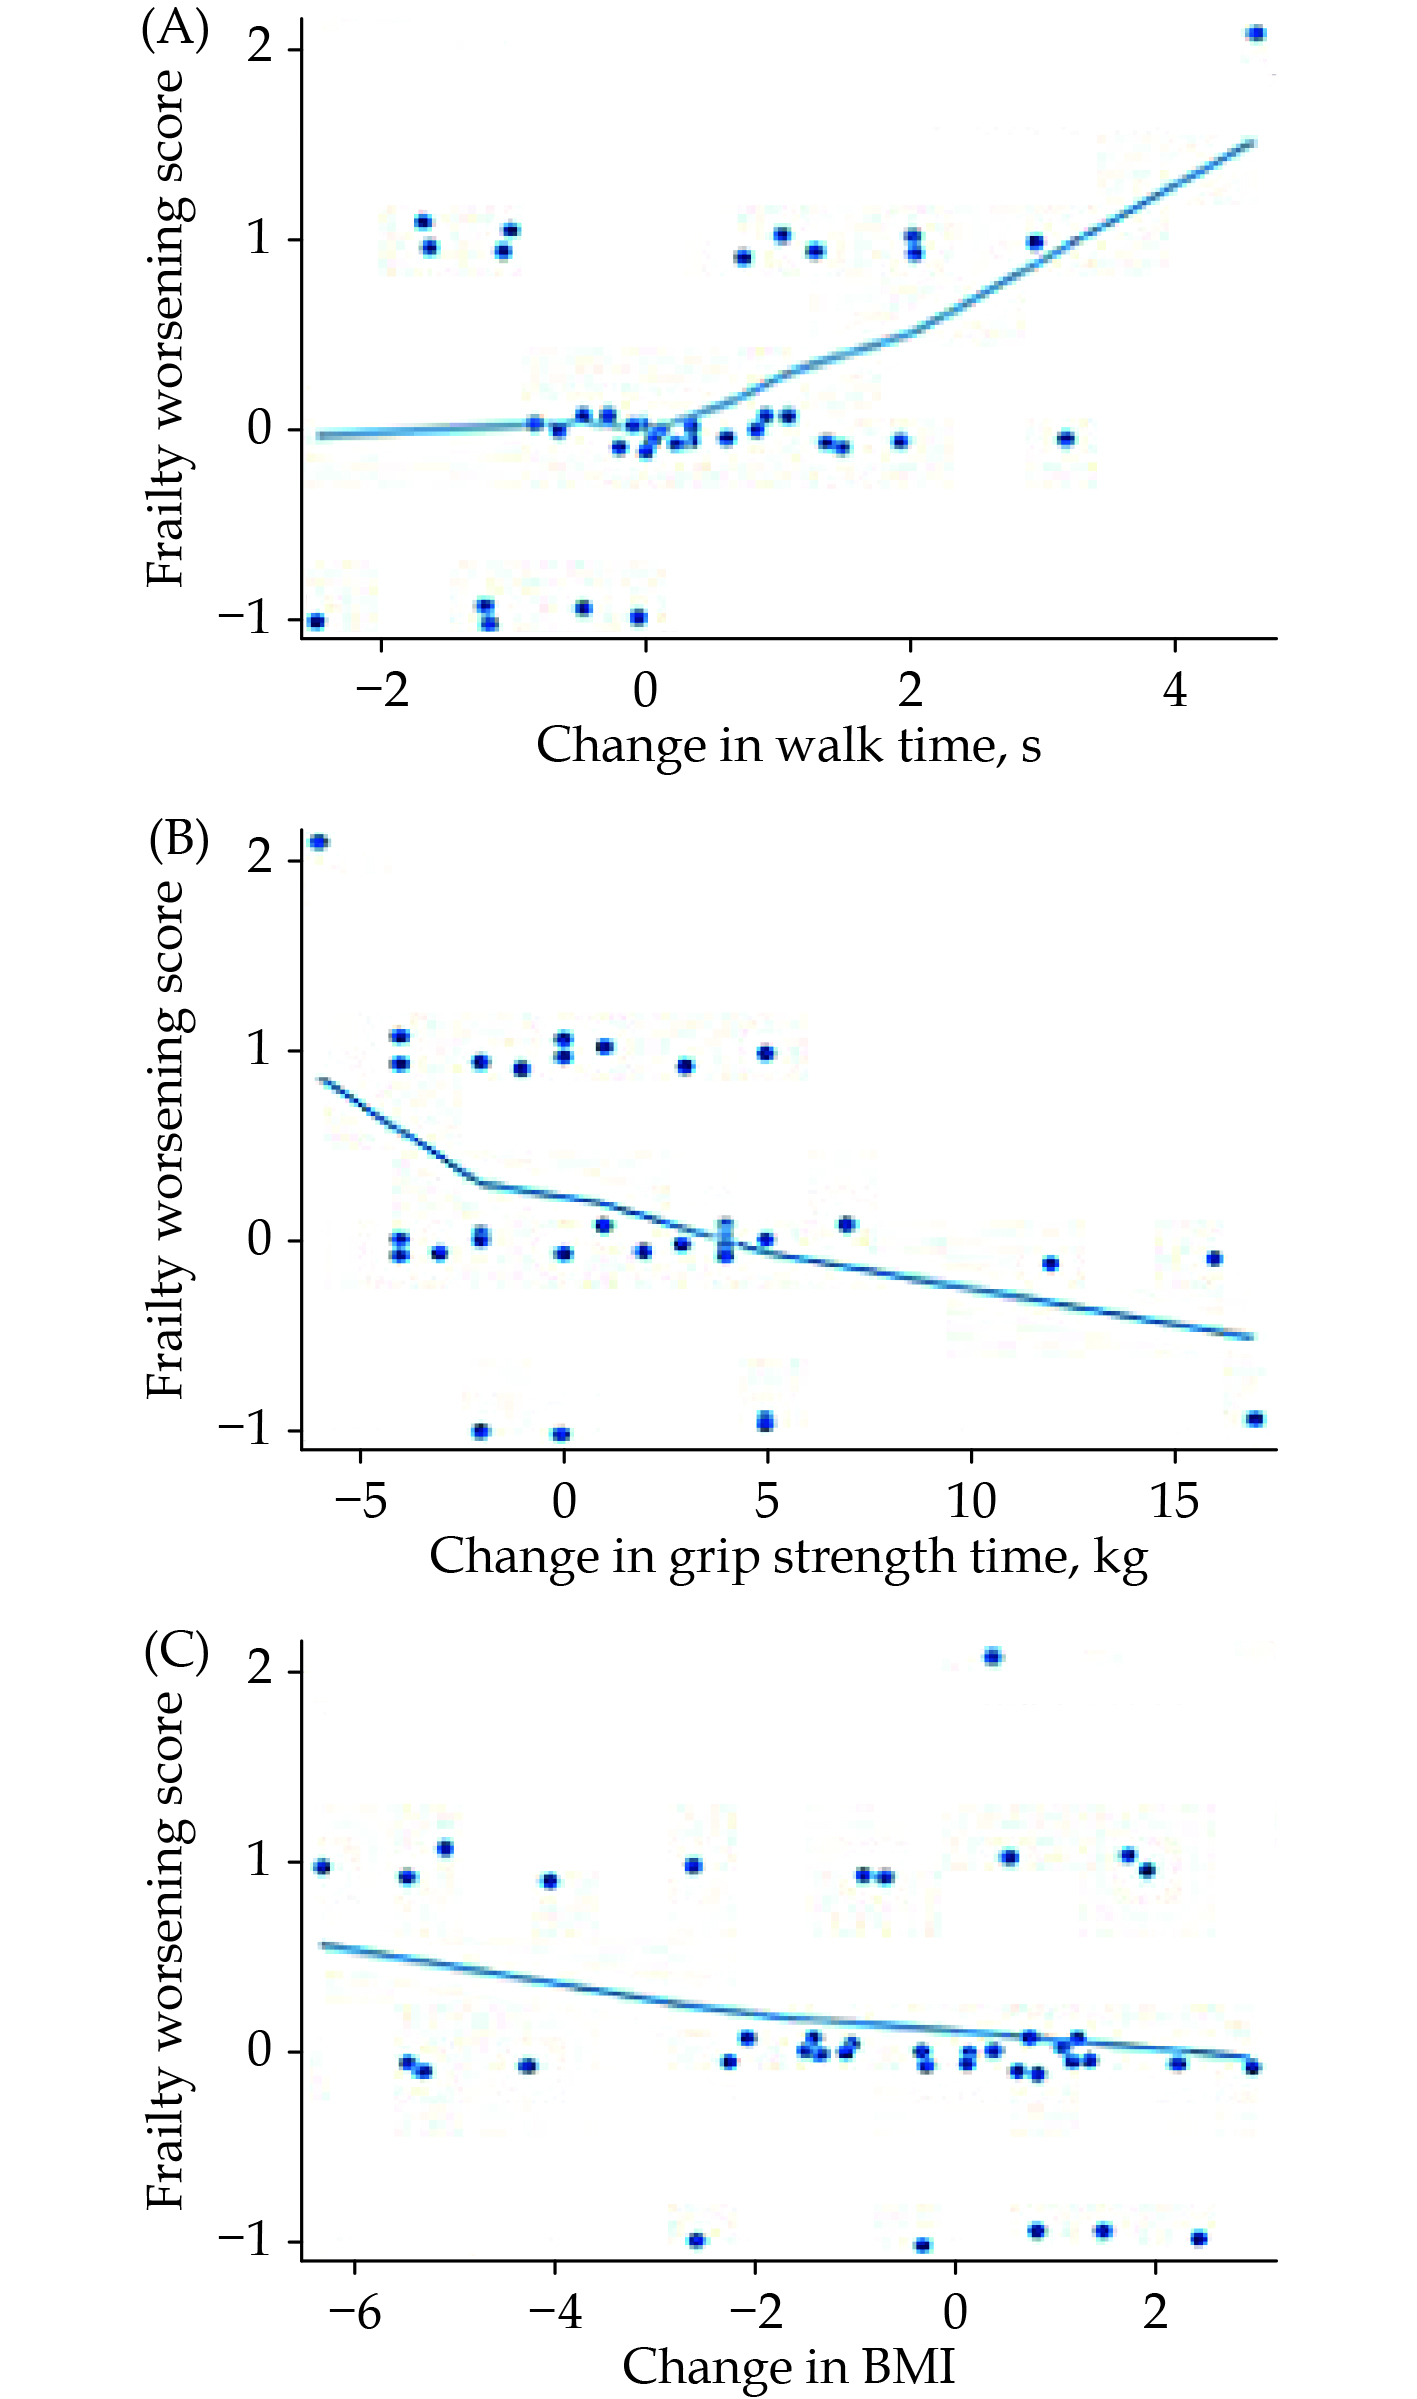
Figure 1A and 1B shows that changes in walk time (i.e, slower walking time) and grip strength (i.e, poorer grip strength) over time were associated with worsening frailty status as assessed in follow-up, respectively. Both slower walk time (r = 0.46; P = 0.004) and decreased grip strength (r = −0.39; P = 0.01) were associated with worsening frailty change score, while increase in BMI showed trend towards an improving frailty score but was not statistically significant (r = −0.26; P = 0.11) (Figure 1C). Table 3 shows clinical events over long term follow-up by frailty change status. There was a trend toward higher rates of all clinical events, including death, MACE, and hospitalizations, in patients with worsening frailty status as compared to patients whose frailty status remained unchanged or had improved.
Figure
1.
Association calculations.
(A): association between the change in walk time as assessed at baseline and follow-up time points and worsening frailty score (P = 0.004). Longer walk times equated with slower gait speed and greater frailty deficit. (B): association between the change in grip strength as assessed at baseline and follow-up time points and worsening frailty score (P = 0.01). The higher changed grip strength equated with grip strength improvement and fewer frailty deficits. (C): association between change in BMI and worsening frailty score. There was no significant relationship between change in BMI and worsening frailty score. BMI: body mass index.
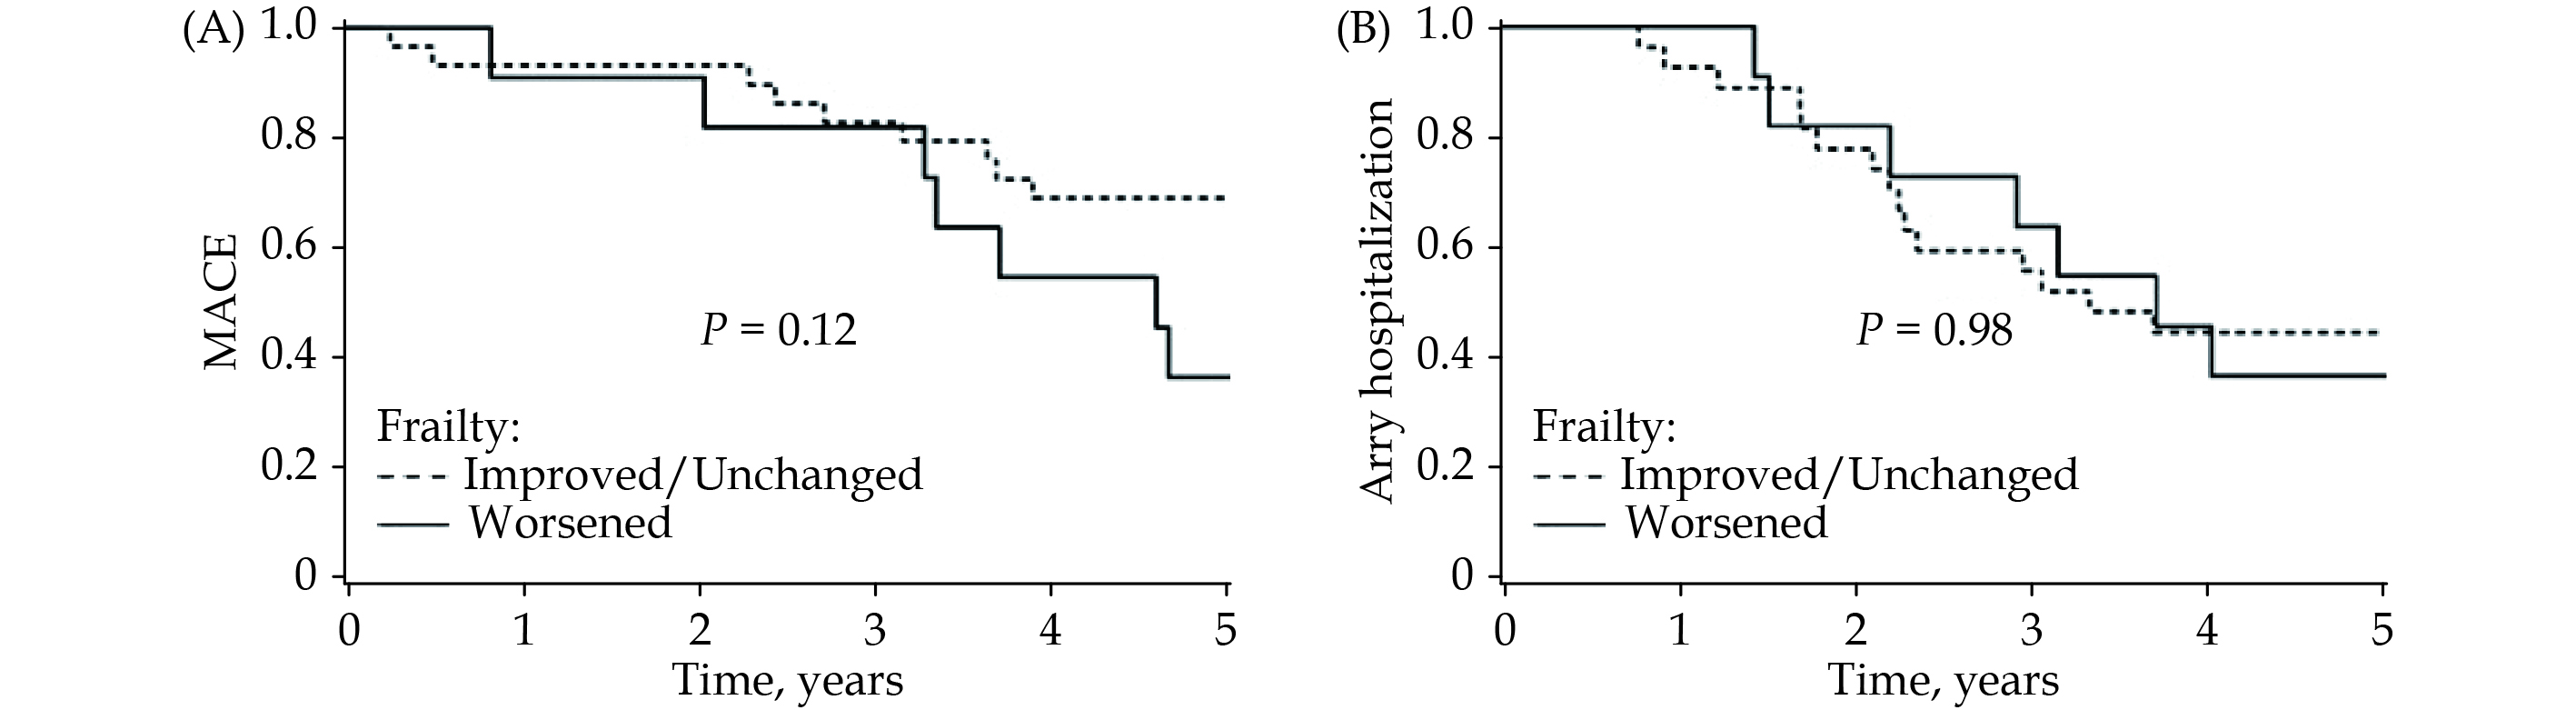
Figure 2A shows the survival curve for MACE by frailty change status (improved/unchanged frailty vs. worsened frailty) over a median follow-up of 5.2 years. Although there was an observed trend toward worse survival free of MACE among those worsening frailty change status, it was not statistically significant (P = 0.12 by log-rank). Hospitalization events over long-term follow-up were not different between frailty change status groups (Figure 2B). Factors independently associated with MACE were studied using a multivariable model (Supplementary Table 2). Frailty change status had nearly 2-fold increased risk of MACE, but did not reach significance (HR = 1.86; 95% CI: 0.65−5.29). A history of hypertension was associated with significantly lower risk of MACE (HR = 0.17; 95% CI: 0.04−0.65) while a history of heart failure was strongly associated with MACE (HR = 4.10; 95% CI: 1.36−12.40).
Figure
2.
Survival free of MACE (A) and hospitalization (B) by frailty change score status over long-term follow-up.
In a cohort of older adults with CAD, repeat measures of frailty indices provided important information on frailty status change over time. Most Fried frailty features were more prevalent during 2nd wave assessments, though only decreased physical activity was significantly lower. Serial assessment demonstrated that nearly 1/3 (28%) of subjects show worsening frailty classification over follow-up. No baseline factors were associated with worsening frailty status at five years, however, declining walk time and grip strength identified worsening frailty classification over time. We observed a trend towards less frailty progression by increased BMI, which was not evident when only baseline BMI was considered. Despite higher crude rates of adverse outcomes in patients with worsening frailty vs. those with unchanged/improved frailty, MACE and hospitalization rates were not significantly different between groups. These observations suggest that baseline only assessments of frailty may be incomplete, and that functional, physiologic decline in older adults occurs across a continuum. Hallmarks of worsening frailty may be better identified by looking at change in walk time and grip strength rather than relying on their values at baseline alone.
Newman, et al.[12] noted that baseline frailty, without subsequent re-measurement, was associated with markers of cardiovascular disease, such as heart failure and peripheral artery disease. A potential link between frailty and both manifest cardiovascular disease and biomarkers of CAD was felt to be related to chronic inflammation. Interestingly, the authors acknowledged that a key limitation of their findings related to only a baseline assessment of frailty criteria, rather than an understanding of changes to frailty features over time. A consensus work group on data elements and outcomes in frailty research has emphasized the need to better understand how commonly used frailty measures or instruments are sensitive to change, especially with respect to clinical outcomes.[13] In addition, the recognition that the phenotype of frailty reflects reduced intrinsic capacity over time, serial measurement of functional, physiologic, and vitality indices in older adults may further help define the continuum of frailty. Unfortunately, few studies published in the frailty space have re-assessed frailty indices over time in a cohort of community dwelling patients.
In our cohort, walk time at baseline was generally normal, with fewer than 7% classified as slow walkers. However, follow-up assessment of walk time demonstrated that the prevalence of slow walkers had increased by 2-fold (15%). In addition, baseline walk times did not correlate with frailty worsening scores; however, change in walk time was significantly associated with frailty worsening (r = 0.46; P = 0.004). This underscores the dynamic nature of mobility assessment in the geriatric population, suggesting that baseline cross-sectional type aging assessments have limitations. This observation also comports with clinical comprehensive geriatric assessment that often entails serial evaluations and re-measurement over time. Gait speed change, rather than baseline walk speed, has been used in different populations but rarely studied in patients with CAD. Gait speed decline in older adults has been associated with changes in brain volume and white matter hyperintensity on neuroimaging,[14] with cognition influencing gait speed change during physical reconditioning.[15] Improved gait speed change after first stroke was associated with improved walking ability as rated by therapists and subjects.[16] In a large prospective cohort study of community-dwelling elders, Duan-Porter, et al.[17] showed that hospitalization was associated with decreased gait speed and nearly 2-fold increased odds of new disability or new mobility limitation. Decline in serial gait speed may function as a barometer of cognitive and health reserves, and may identify a vulnerable population at risk for adverse outcomes. However, as suggested in post stroke recovery, walk time improvement may herald improved reserves, reconditioning, and functional resilience.
Baseline grip strength was not associated with frailty worsening score in our study, though change in grip strength was (r = −0.39; P = 0.01). In a large cohort of adults ≥ 60 years old, a 1 kg improvement in grip strength over 1-year was associated with 13% lower mortality.[18] Similar observations have been noted over long-term follow-up among those ≥ 85 years old, with some suggestion that women with declining grip strength may be at greater mortality risk than men.[19] Declining grip strength change may also correlate with changes in skeletal health, bone loss, fracture risk, and other adverse health outcomes.[20,21] These data support serial assessment of grip strength as both a biomarker of functional abilities and identifier of vulnerability in older adults with geriatric syndromes. Intervention trials aimed at attenuating grip strength decline through strength training may have the added benefit of impacting the frailty phenotype. Given that lower grip strength has been associated with higher cardiovascular mortality,[22] the implications of declining grip strength in a CAD population deserves further study.
Few studies have looked at frailty change and its relationship to outcome. Wang, et al.[23] used the Fried frailty index to show that both baseline frailty and a graded risk between frailty transition states were observed with respect to mortality. A study from the Chinese Longitudinal Healthy Longevity Survey aimed to study transitions between frailty states and mortality.[24] In addition to noting worse survival among frailty change worsening status, these patients were also more likely to have greater suffering at end of life based on survey responses from next of kin. Similar to our study, both showed that frailty transitions were more likely to show frailty worsening than frailty improvement. Both studies highlight the dynamic process of change that occurs in the frailty phenotype and its association with outcome, underscoring that baseline indices incompletely characterize age-associated impairments and that frailty trajectory may provide additive information with respect to risk of adverse outcome.
Our study adds to the literature by reporting frailty change over a 5-year period, followed by outcome assessment for another subsequent five years, representing one of the longest incident frailty studies to date. In addition, we studied MACE in addition to mortality which are relevant endpoints for patients with CAD. We identified that specific frailty components, namely functional performance with grip strength and gait speed, are responsible for the majority of transitions. The independent association of heart failure with MACE after accounting for demographics and frailty change status shows the prognostic significance of this comorbidity in older adults. This finding extends prior observations of the relationship between frail heart failure patients and outcome.[25]
Limitations of our study included a modest sample size returning for the 2nd wave assessment, which likely affected our power to detect significant differences between frailty worsening status and MACE outcomes. Characteristics of responders vs non-responders in our study were similar, reducing potential for non-response bias. We defined frailty using the validated Fried index at both baseline and follow-up, though other forms of frailty assessment that are more streamlined, incorporate other features (i.e., cognition), and are, perhaps, less intensive have been used. Our study demonstrated that baseline assessments for Fried frailty classification change over time, with walk time and grip strength predominately affecting Fried frailty classification. An increase in BMI had a trend towards being mildly protective from worsening frailty. There was no baseline single-item measure correlated with worsening Fried frailty status at 5-year follow-up. Efforts to improve understanding of age-related impairments may be supplemented through repeated measures to evaluate change in phenotype over time. Baseline abnormalities for Fried indices are less indicative of frailty change over long term follow-up.
ACKNOWLEDGMENTS
This study was supported by Mayo Clinic Foundation for Education and Research.
Sergi G, Veronese N, Fontana L, et al. Pre-frailty and risk of cardiovascular disease in elderly men and women: the Pro.V.A. study. J Am Coll Cardiol 2015; 65: 976−983. doi: 10.1016/j.jacc.2014.12.040
[3]
Fedarko NS. The biology of aging and frailty. Clin Geriatr Med 2011; 27: 27−37. doi: 10.1016/j.cger.2010.08.006
[4]
Fried LP, Tangen CM, Walston J, et al. Frailty in older adults: evidence for a phenotype. J Gerontol A Biol Sci Med Sci 2001; 56: M146−M156. doi: 10.1093/gerona/56.3.M146
[5]
Jones DM, Song X, Rockwood K. Operationalizing a frailty index from a standardized comprehensive geriatric assessment. J Am Geriatr Soc 2004; 52: 1929−1933. doi: 10.1111/j.1532-5415.2004.52521.x
[6]
Walston J, Hadley EC, Ferrucci L, et al. Research agenda for frailty in older adults: toward a better understanding of physiology and etiology: summary from the American Geriatrics Society/National Institute on Aging Research Conference on Frailty in Older Adults. J Am Geriatr Soc 2006; 54: 991−1001. doi: 10.1111/j.1532-5415.2006.00745.x
[7]
Fried LP, Kronmal RA, Newman AB, et al. Risk factors for 5-year mortality in older adults: the Cardiovascular Health Study. JAMA 1998; 279: 585−592. doi: 10.1001/jama.279.8.585
[8]
Sanchez E, Vidan MT, Serra JA, et al. Prevalence of geriatric syndromes and impact on clinical and functional outcomes in older patients with acute cardiac diseases. Heart 2011; 97: 1602−1606. doi: 10.1136/hrt.2011.227504
[9]
Afilalo J, Eisenberg MJ, Morin JF, et al. Gait speed as an incremental predictor of mortality and major morbidity in elderly patients undergoing cardiac surgery. J Am Coll Cardiol 2010; 56: 1668−1676. doi: 10.1016/j.jacc.2010.06.039
[10]
Gharacholou SM, Reid KJ, Arnold SV, et al. Cognitive impairment and outcomes in older adult survivors of acute myocardial infarction: findings from the translational research investigating underlying disparities in acute myocardial infarction patients' health status registry. Am Heart J 2011; 162: 860−869. doi: 10.1016/j.ahj.2011.08.005
[11]
Studenski S, Perera S, Patel K, et al. Gait speed and survival in older adults. JAMA 2011; 305: 50−58. doi: 10.1001/jama.2010.1923
[12]
Newman AB, Gottdiener JS, McBurnie MA, et al. Associations of subclinical cardiovascular disease with frailty. J Gerontol A Biol Sci Med Sci 2001; 56: M158−M166. doi: 10.1093/gerona/56.3.M158
[13]
Muscedere J, Afilalo J, Araujo de Carvalho I, et al. Moving towards common data elements and core outcome measures in frailty research. J Frailty Aging 2020; 9: 14−22.
[14]
Pinter D, Ritchie SJ, Gattringer T, et al. Predictors of gait speed and its change over three years in community-dwelling older people. Aging (Albany NY) 2018; 10: 144−153.
[15]
Schaefer SY, Sullivan JM, Peterson DS, et al. Cognitive function at admission predicts amount of gait speed change in geriatric physical rehabilitation. Ann Phys Rehabil Med 2020; 63: 359−361. doi: 10.1016/j.rehab.2019.08.004
[16]
Fulk GD, Ludwig M, Dunning K, et al. Estimating clinically important change in gait speed in people with stroke undergoing outpatient rehabilitation. J Neurol Phys Ther 2011; 35: 82−89. doi: 10.1097/NPT.0b013e318218e2f2
[17]
Duan-Porter W, Vo TN, Ullman K, et al. Hospitalization-associated change in gait speed and risk of functional limitations for older adults. J Gerontol A Biol Sci Med Sci 2019; 74: 1657−1663. doi: 10.1093/gerona/glz027
[18]
Malhotra R, Tareque MI, Tan NC, et al. Association of baseline hand grip strength and annual change in hand grip strength with mortality among older people. Arch Gerontol Geriatr 2020; 86: 103961. doi: 10.1016/j.archger.2019.103961
[19]
Granic A, Davies K, Jagger C, et al. Initial level and rate of change in grip strength predict all-cause mortality in very old adults. Age Ageing 2017; 46: 970−976. doi: 10.1093/ageing/afx087
[20]
Sirola J, Tuppurainen M, Honkanen R, et al. Associations between grip strength change and axial postmenopausal bone loss--a 10-year population-based follow-up study. Osteoporos Int 2005; 16: 1841−1848. doi: 10.1007/s00198-005-1944-y
[21]
Sirola J, Rikkonen T, Tuppurainen M, et al. Maintenance of muscle strength may counteract weight-loss-related postmenopausal bone loss--a population-based approach. Osteoporos Int 2006; 17: 775−782. doi: 10.1007/s00198-005-0054-1
[22]
Leong DP, Teo KK, Rangarajan S, et al. Prognostic value of grip strength: findings from the Prospective Urban Rural Epidemiology (PURE) study. Lancet (London, England) 2015; 386: 266−273. doi: 10.1016/S0140-6736(14)62000-6
[23]
Wang MC, Li TS, Li CI, et al. Frailty, transition in frailty status and all-cause mortality in older adults of a Taichung community-based population. BMC Geriatr 2019; 26: 1−8.
[24]
Liu ZY, Wei YZ, Wei LQ, et al. Frailty transitions and types of death in Chinese older adults: a population-based cohort study. Clin Interv Aging 2018; 13: 947−956. doi: 10.2147/CIA.S157089
[25]
Pandey A, Kitzman D, Reeves, G, et al. Frailty is intertwined with heart failure: mechanisms, prevalence, prognosis, assessment, and management. JACC Heart Fail 2019; 7: 1001−1011. doi: 10.1016/j.jchf.2019.10.005
Data are presented as mean ± SD or n (%). BMI: body mass index; CABG: coronary artery bypass grafting; CHF: congestive heart failure; MI: myocardial infarction; MMSE: mini-mental status exam; PAD: peptic ulcer disease; PCI: percutaneous coronary intervention; TIA: transient ischemic attack.


 DownLoad: