Please cite this article as: TONG W, WANG JM, LI JY, LI PY, CHEN YD, ZHANG ZB, DONG W. Incidence, predictors, and prognosis of thrombocytopenia among patients undergoing intra-aortic balloon pumping in the intensive care unit: a propensity score analysis. J Geriatr Cardiol 2021; 18(2): 123−134. DOI: 10.11909/j.issn.1671-5411.2021.02.003.
Citation:
Please cite this article as: TONG W, WANG JM, LI JY, LI PY, CHEN YD, ZHANG ZB, DONG W. Incidence, predictors, and prognosis of thrombocytopenia among patients undergoing intra-aortic balloon pumping in the intensive care unit: a propensity score analysis. J Geriatr Cardiol 2021; 18(2): 123−134. DOI: 10.11909/j.issn.1671-5411.2021.02.003.
Please cite this article as: TONG W, WANG JM, LI JY, LI PY, CHEN YD, ZHANG ZB, DONG W. Incidence, predictors, and prognosis of thrombocytopenia among patients undergoing intra-aortic balloon pumping in the intensive care unit: a propensity score analysis. J Geriatr Cardiol 2021; 18(2): 123−134. DOI: 10.11909/j.issn.1671-5411.2021.02.003.
Citation:
Please cite this article as: TONG W, WANG JM, LI JY, LI PY, CHEN YD, ZHANG ZB, DONG W. Incidence, predictors, and prognosis of thrombocytopenia among patients undergoing intra-aortic balloon pumping in the intensive care unit: a propensity score analysis. J Geriatr Cardiol 2021; 18(2): 123−134. DOI: 10.11909/j.issn.1671-5411.2021.02.003.
Incidence, predictors, and prognosis of thrombocytopenia among patients undergoing intra-aortic balloon pumping in the intensive care unit: a propensity score analysis
Department of Cardiology, the Sixth Medical Centre, Chinese PLA General Hospital, Beijing, China
2.
Center for Artificial Intelligence in Medicine, Chinese PLA General Hospital, Beijing, China
3.
CAS Key Laboratory of Genome Sciences and Information, Beijing Institute of Genomics, Chinese Academy of Sciences, China National Center for Bioinformation, Beijing, China
4.
Global Health Drug Discovery Institute, Beijing, China
OBJECTIVE To explore the incidence, predictors, and prognosis of intra-aortic balloon pumping (IABP)-related thrombocytopenia in critically ill patients.
METHODS This multi-center study used the eICU Collaborative Research Database V1.2, comprising data on > 130,000 patients from multiple intensive care units (ICUs) in America between 2014 and 2015. A total of 710 patients undergoing IABP were included. Thrombocytopenia was defined as a drop in platelet count > 50% from baseline. From the cohort, 167 patients who developed thrombocytopenia were matched 1:1 with 167 patients who did not, after propensity score (PS) matching. The associations between IABP-related thrombocytopenia and clinical outcomes were examined by multivariable logistic regression.
RESULTS Among 710 patients undergoing IABP, 249 patients (35.07%) developed thrombocytopenia. The APACHE IVa score was a predictor of thrombocytopenia [adjusted odds ratio (OR) = 1.09, 95% confidence interval (CI): 1.02−1.15]. After 1:1 PS matching, in-hospital mortality (adjusted OR = 0.76, 95% CI: 0.37−1.56) and in-ICU mortality (adjusted OR = 0.74, 95% CI: 0.34−1.63) were similar between the thrombocytopenia and non-thrombocytopenia groups. However, major bleeding occurred more frequently in the thrombocytopenia group (adjusted OR = 2.54, 95% CI: 1.54−4.17). In-hospital length of stay (LOS) and in-ICU LOS were significantly longer in patients who developed thrombocytopenia than in those who did not (9.71 vs. 7.36, P < 0.001; 5.13 vs. 2.83, P < 0.001).
CONCLUSIONS Among patients undergoing IABP in the ICUs, thrombocytopenia was not associated with a difference in in-hospital mortality or in-ICU mortality; however, thrombocytopenia was significantly associated with a greater risk of major bleeding and increased in-ICU and in-hospital LOS.
Intra-aortic balloon pump (IABP) is a commonly used circulatory assist device, which is positioned in the descending thoracic aorta to improve systemic hemodynamics.[1,2] Therefore, this device is routinely used in various clinical settings, such as high-risk percutaneous coronary intervention (PCI), acute myocardial infarction (MI), cardiogenic shock, and coronary artery bypass grafting (CABG).[3–7] However, IABP is reported to be associated with several complications, including hemorrhage, limb ischemia, embolization, and thrombocytopenia.[4,7,8]
The most frequent complication of IABP is thrombocytopenia, a drop in platelet count (DPC), which occurred in 43% to 82% of patients undergoing IABP.[9–11] The impact of IABP-related thrombocytopenia on clinical outcomes has remained unclear. Very few studies on IABP-related thrombocytopenia have been performed, and they report conflicting results. In a prospective study of 252 patients treated by IABP, Roy, et al.[9] reported that thrombocytopenia was not a predictor of major bleeding or in-hospital death. Recently, Sheng, et al.[12] conducted another retrospective study of 222 patients with acute coronary syndrome (ACS); however, the results showed that IABP-related thrombocytopenia was correlated with increased in-hospital mortality, but not with thrombolysis in myocardial infarction bleeding or thromboembolic events. More importantly, these studies were single-center studies with a small number of subjects, which did not provide enough evidence to support their conclusions.
Therefore, we aimed to examine the incidence and prognostic impact on clinical outcomes of IABP-related thrombocytopenia in a multi-center large cohort of patients from a Collaborative Research Database. We further sought to explore the predictors of IABP-related thrombocytopenia.
METHODS
Study Database
This was a multi-center, retrospective study of patients from the eICU Collaborative Research Database (eICU-CRD) V1.2, which comprises data on 139,376 patients admitted to 335 intensive care units (ICUs) at 208 hospitals throughout America in 2014 and 2015.[13] The eICU-CRD V1.2 is made available and open to medical researchers online through the work of Philips Healthcare and Massachusetts Institute of Technology Laboratory for Computational Physiology.[14] The database contains details of patients, including vital signs, laboratory test results, medications, Acute Physiology and Chronic Health Evaluation (APACHE) score, admission-diagnosis, patient history, time-stamped diagnoses, treatments, and survival data on discharge.[13,15] Individual data have been previously deidentified. Access to the database was requested after registration, including completion of the required training course, agreement to instructions on data use, and application for access to the database project. The study design was approved by the Institutional Review Board of the Massachusetts Institute of Technology when data of all the patients were collected from the database. The local Ethics Committee recommended that formal ethical approval was not required for this study.
Study Population
The eICU-CRD V1.2 was searched to identify patients who underwent IABP after admission to the ICUs. Additionally, only the first IABP procedure was included in patients with multiple IABP procedures. The exclusion criteria were as follows: (1) age less than 18 years; (2) missing data on platelet counts; (3) platelet count < 100 × 109/L before IABP; and (4) heparin-induced thrombocytopenia.
Variable Definition
In the present study, we defined thrombocytopenia as a DPC > 50% from the baseline platelet count. Baseline platelet count was the last value prior to initiation of IABP. Platelet counts were analyzed until the death of patients, discharge from the hospital, or nine days after IABP initiation. DPC was calculated using platelet count at baseline and the nadir after IABP initiation, with the following formula: (baseline count − nadir count)/baseline count × 100%. The APACHE IVa score is an established system of evaluating a patient’s severity of illness on ICU admission, based on a group of patient-parameters including physiological measurements, comorbid burden, treatment, and admission-diagnosis.[15,16] “Prior thrombosis” was defined as patients with a history of venous thrombosis or pulmonary embolism. Cardiac diseases, including angina, MI, and cardiogenic shock, were defined when patients were recorded at the on-admission diagnosis or in-hospital diagnosis before IABP initiation. Details of percutaneous transluminal coronary angioplasty (PTCA) or CABG were recorded when the procedure was undertaken, based on the cardiac disease before IABP initiation. “Baseline laboratory values” were defined as the last laboratory test result values prior to IABP initiation. “Aggregation inhibitors” included the use of clopidogrel and ticlopidine. “Glycoprotein IIB/IIIA inhibitors” included the use of tirofiban, abciximab, or eptifibatide. “Thrombin inhibitors” included the use of argatroban and bivalirudin. “Thrombolytic therapy” was defined as the use of streptokinase or tenecteplase.
In regard to clinical outcomes, “Transfusion” was a combination of red blood cell (RBC) and platelet transfusion of any number of units. “Thromboembolic event” included ischemic stroke, pulmonary embolism, deep vein thrombosis, and lower extremity arterial thromboembolism. “Post-procedural renal insufficiency” was defined as a rise in creatinine ≥ 50% from the baseline after IABP initiation. “Dialysis” was defined as hemodialysis or peritoneal dialysis. “Mechanical ventilation” was defined as patients requiring mechanical ventilation after the procedure. “Nadir and Maximum laboratory test results” values were the lowest and highest values, respectively, after IABP initiation.
Clinical Outcomes
The primary clinical outcome was defined as in-hospital mortality. Secondary clinical outcomes included in-ICU mortality, major bleeding, in-hospital length of stay (LOS), and in-ICU LOS. “Major bleeding” was a composite variable consisting of hemorrhagic stroke, any clinically apparent bleeding with a decrease of ≥ 30 g/L from the baseline of hemoglobin concentration, one requiring transfusion of RBCs, or an acute loss of ≥ 50 g/L from the baseline of hemoglobin concentration over 72 h.
Statistical Analysis
Quantitative variables were presented as median (interquartile range) and compared using the Mann-Whitney U test. Qualitative variables were presented as number and proportion and compared by means of the Pearson’s chi-square test or Fisher’s exact test. Multivariate logistic regression was performed to assess the association between thrombocytopenia and relevant clinical outcomes and identify the predictors of both thrombocytopenia and major bleeding. The calibration of the prediction models was determined by the Hosmer-Lemeshow goodness-of-fit test. A significant value of P < 0.05 indicated a lack of fit. The model discrimination was assessed with the receiver operating characteristic curve. A model with an area under the curve (AUC) value > 0.7 was considered as adequate discrimination. All tests were two-tailed and a value of P < 0.05 was considered statistically significant.
A propensity score (PS) analysis was performed using a logistic regression model with thrombocytopenia as the dependent variable and baseline characteristics as independent variables. Variables included in this model were age; sex; race (Caucasian); body mass index; APACHE IVa score; mean arterial pressure; history of hypertension, diabetes mellitus, hypercholesterolemia, and renal insufficiency; prior angina, MI, PCI, CABG, congestive heart failure (CHF), valve disease, stroke/transient ischemic attack, peripheral vascular disease, hemorrhage, and thrombosis; current angina, MI, PTCA, CABG, and cardiogenic shock; baseline values of platelets, hemoglobin, white blood cell (WBC), glucose, and creatinine; the use of aspirin, aggregation inhibitors, glycoprotein IIB/IIIA inhibitors, unfractionated heparin, low molecular weight heparin (LMWH), warfarin, fondaparinux, thrombin inhibitors, and thrombolytic therapy. A PS-matched cohort was created with a 1:1 ratio and nearest-neighbor match with a caliper of 0.02. The distributions of the PS before and after matching were also compared to further assess the degree of balance. Comparison of qualitative and quantitative variables between the matched cohorts was performed with McNemar’s test and the Mann-Whitney U test. All data were analyzed with IBM SPSS Statistics 23.0 (SPSS Inc., IBM, Armonk, NY, USA) and R Statistical Software 3.4.3 (R Foundation for Statistical Computing, Vienna, Austria).
RESULTS
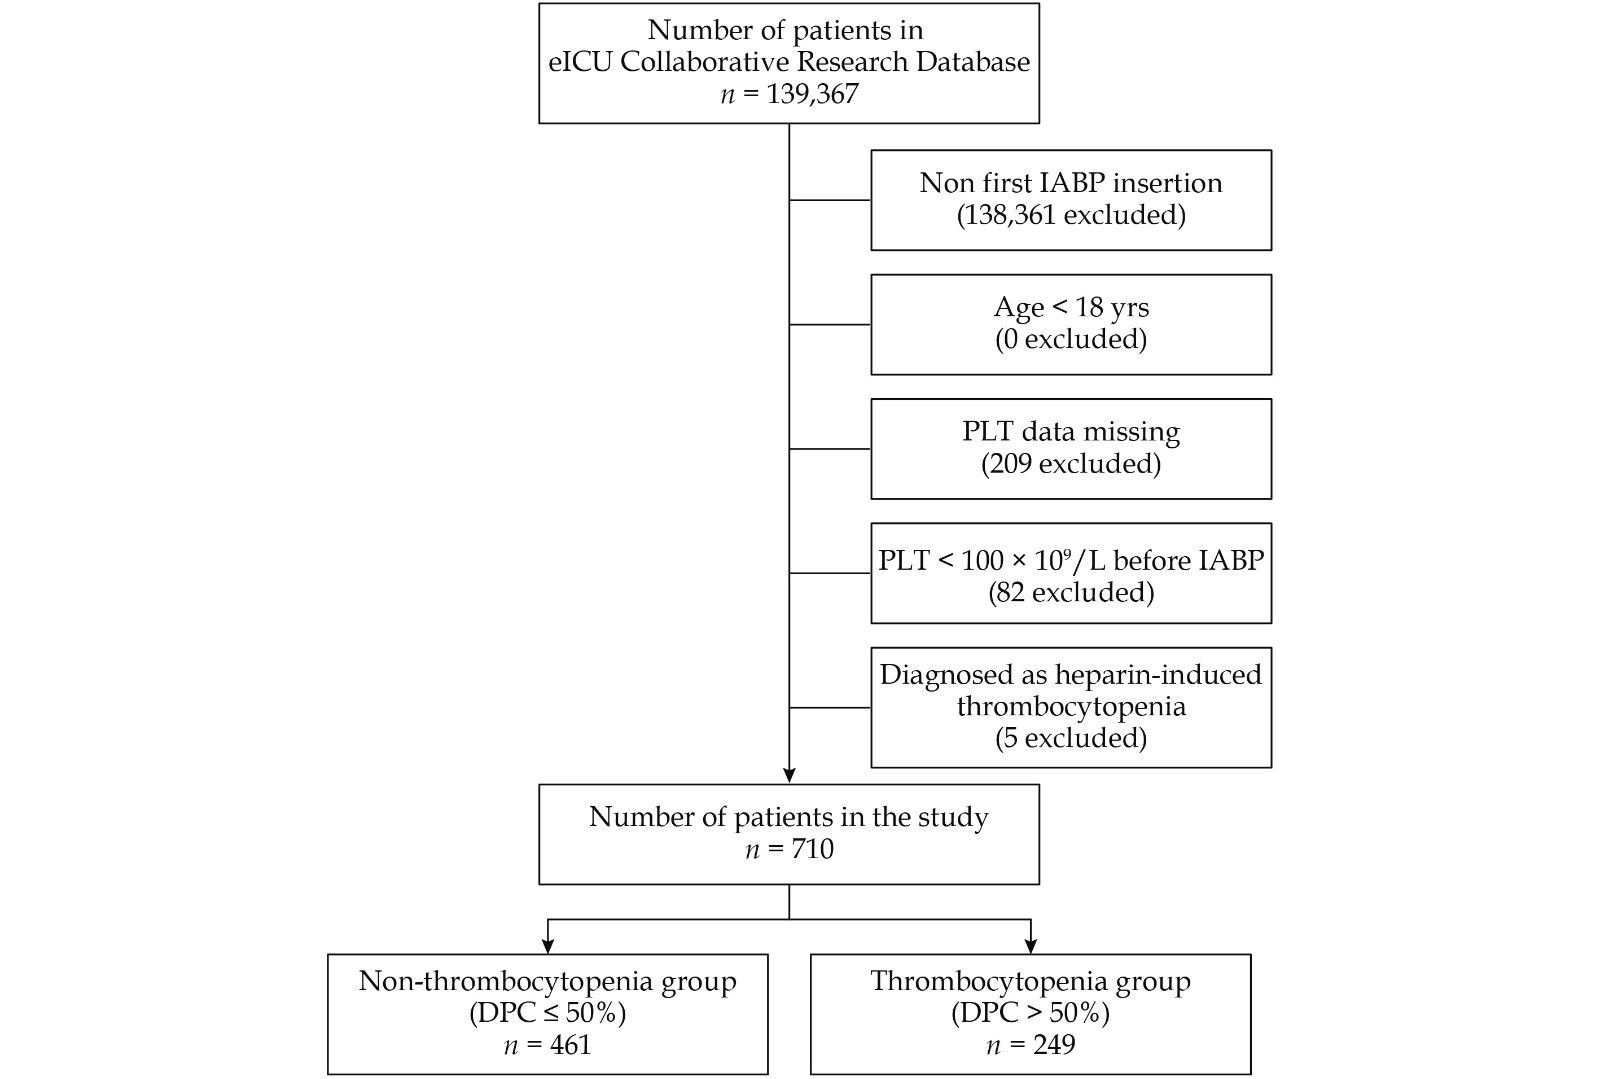
A total of 710 patients (Figure 1) were included in this study, of whom 249 patients (35.07%) developed thrombocytopenia with a DPC > 50% from the baseline after IABP initiation. The median age was 66 years (25th to 75th percentile: 58−74 years), and 502 patients (70.70%) were male. The median APACHE IVa score of the study cohort was 56 (25th to 75th percentile: 40−82). Indications for IABP were support for PTCA (51.27%), support for CABG (17.89%), acute MI (6.62%), cardiogenic shock (2.81%), angina (3.38%), and other origins (18.03%).
Figure
1.
Flowchart of patient inclusion.
DPC: drop in platelet count; IABP: intra-aortic balloon pumping; PLT: platelet.
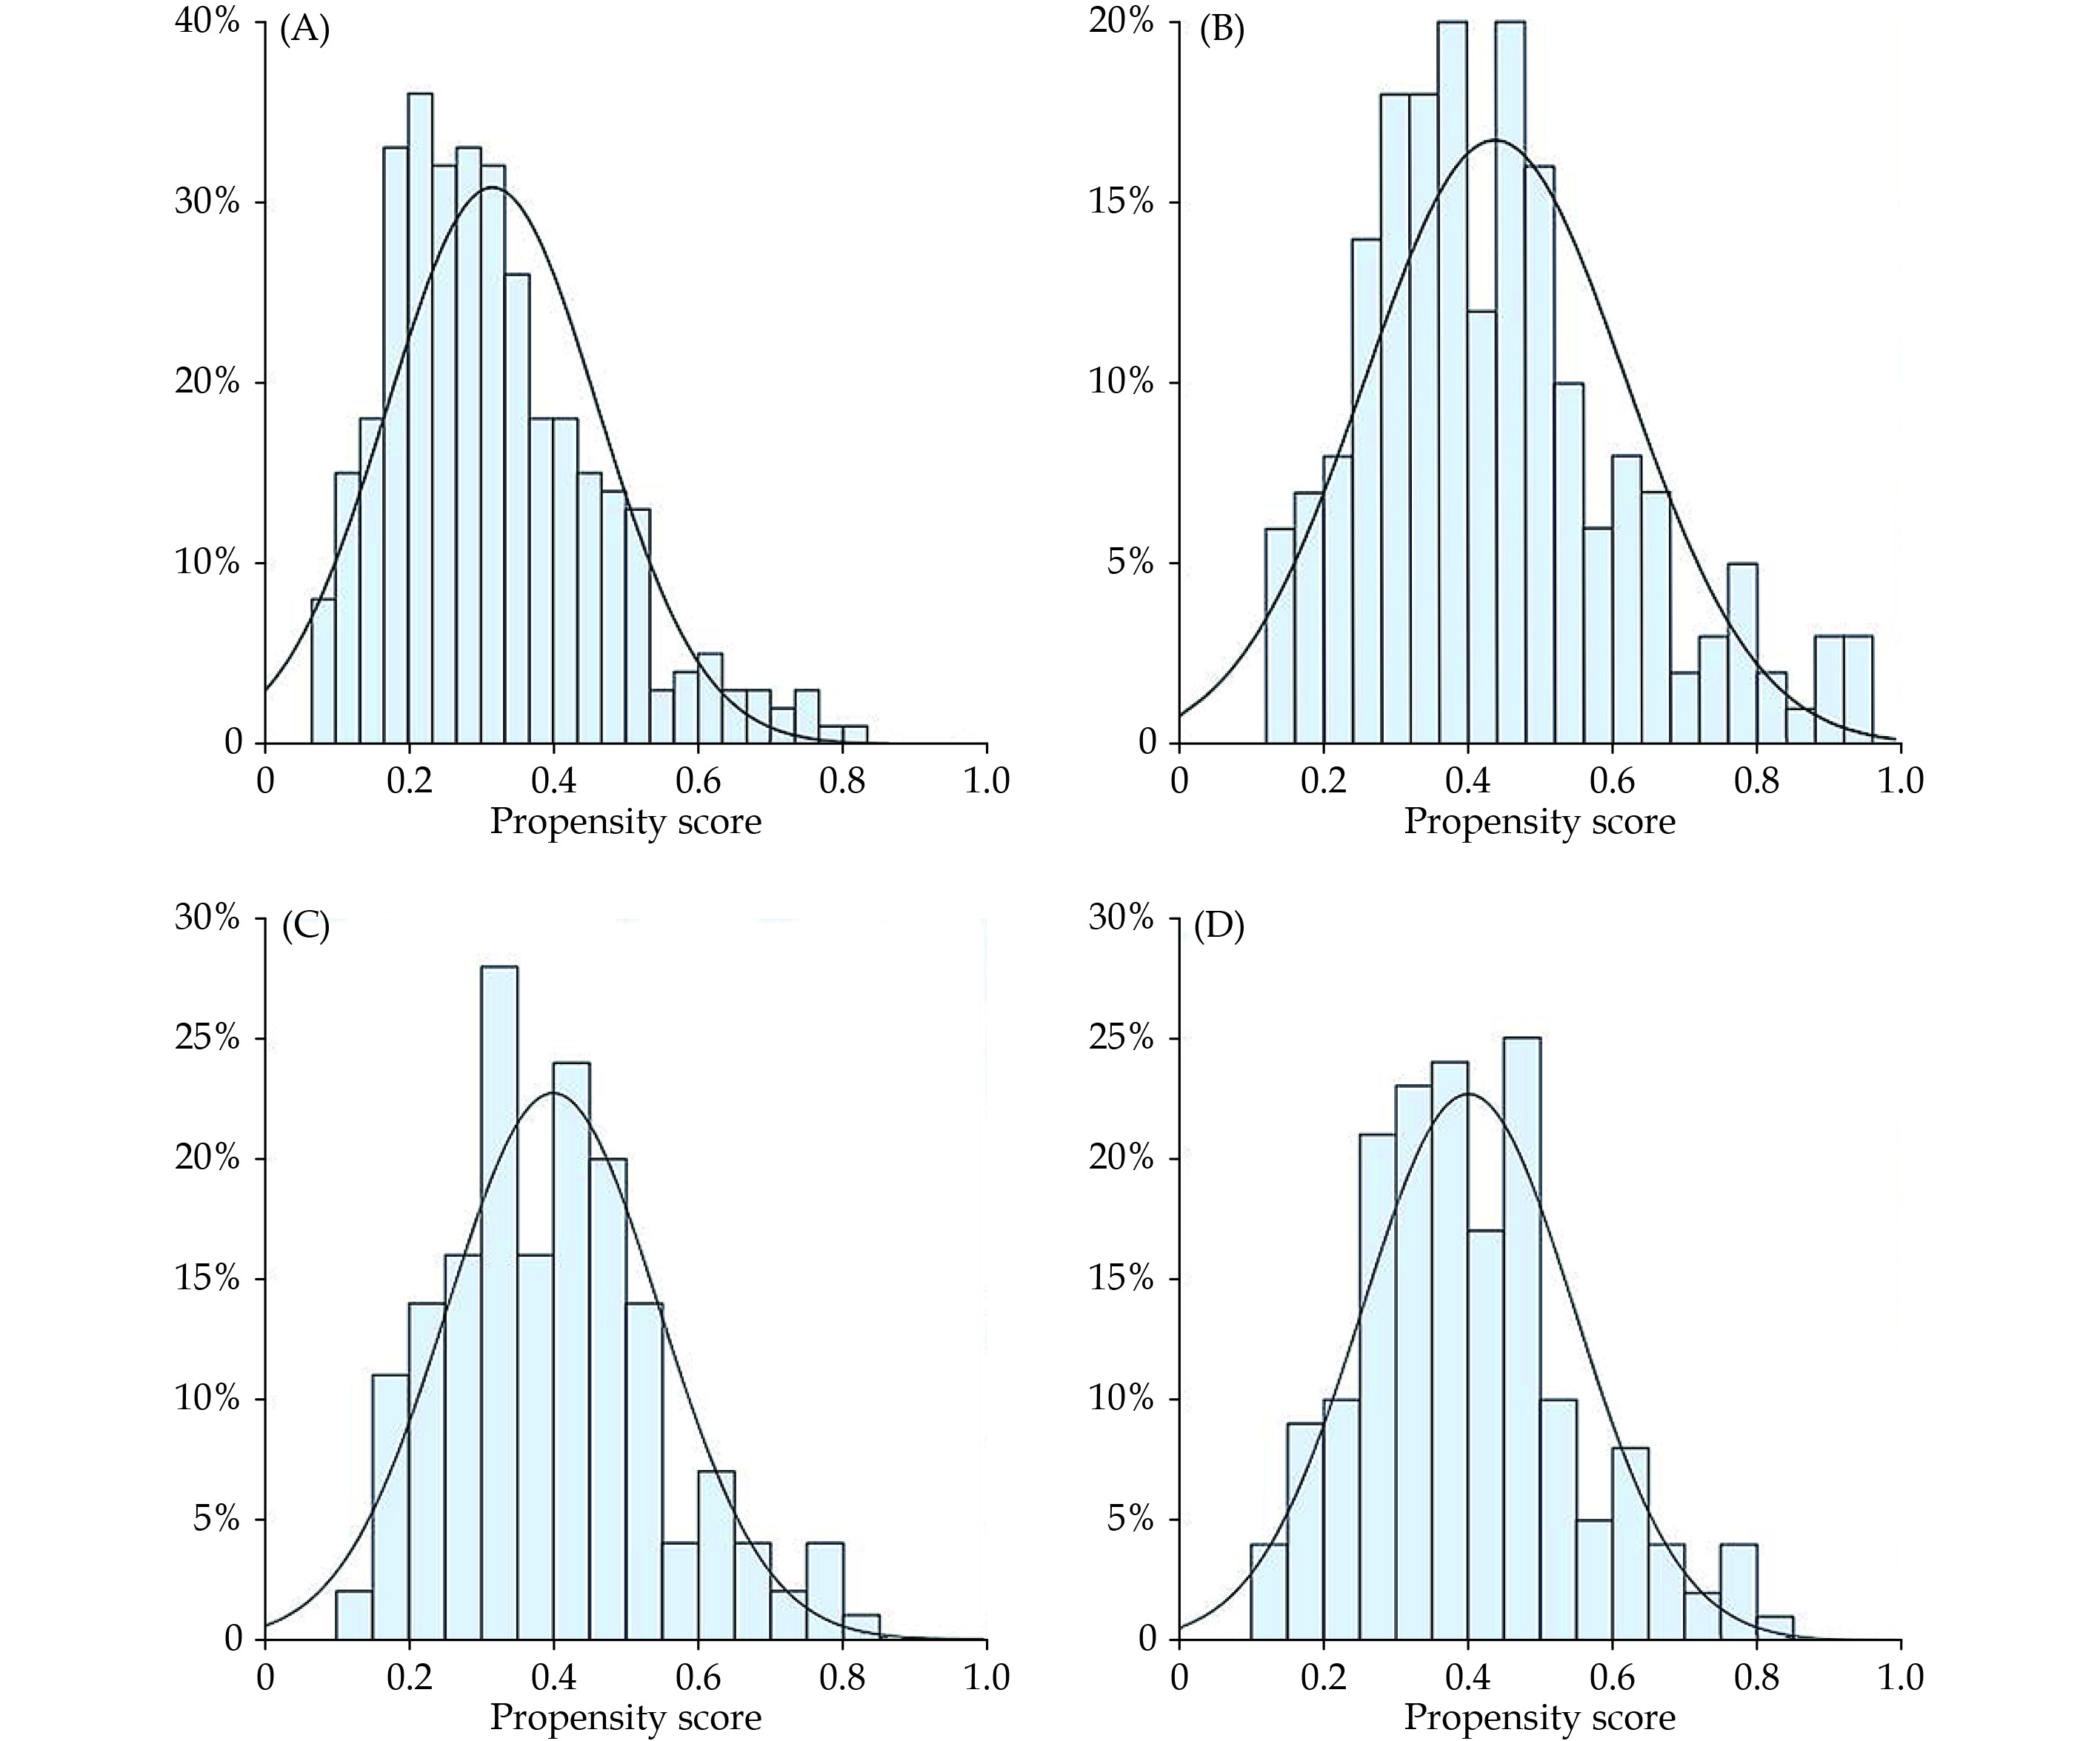
As detailed in Table 1, there were several differences in baseline characteristics between the two groups of the cohort. Women and those with high APACHE IVa scores were more likely to develop thrombocytopenia. The baseline platelet count and glucose level were also high in the thrombocytopenia group; moreover, they more often reported the use of warfarin and fondaparinux. After the PS matching, 167 patients with thrombocytopenia were matched 1:1 with 167 patients without thrombocytopenia. Figure 2 shows the distribution of PS comparing the non-thrombocytopenia and thrombocytopenia groups before and after matching. In the matched cohort, there were no differences between the two groups for all variables including sex, APACHE IVa score, baseline platelet count, baseline glucose level, and the use of warfarin and fondaparinux (Table 1).
Table
1.
Baseline characteristics before and after propensity score matching.
Variables
Entire cohort (n = 710)
Matched cohort (n = 334)
Non-thrombocytopenia (n = 461, DPC ≤ 50%)
Thrombocytopenia (n = 249, DPC > 50%)
P- value
Non-thrombocytopenia (n = 167, DPC ≤ 50%)
Thrombocytopenia (n = 167, DPC > 50%)
P- value
Age, yrs
65 (58−75)*
67 (59.5−74)*
0.235
66 (60−76)*
68 (60−74)*
0.827
Male
338 (73.3%)
164 (65.9%)
0.037
110 (65.9%)
111 (66.5%)
1.000
Caucasian
369 (80.0%)
187 (75.1%)
0.127
126 (75.4%)
130 (77.8%)
0.671
Body mass index, kg/m2
29.06 (25.16−33.01)*
27.95 (24.93−32.22)*
0.113
28.7 (24.95−33.27)*
27.66 (24.93−32.38)*
0.318
APACHE IVa score
52 (38.25−76)*
65 (43−98)*
< 0.001
60 (45−92)*
61 (42−93)*
0.544
Mean arterial pressure, mm Hg
76.33 (66.67−87.33)*
76.83 (65.58−90.33)*
0.724
76.33 (68−86.67)*
77.67 (65.67−90.33)*
0.679
Cardiovascular risk factors
Hypertension
283 (61.4%)
161 (64.7%)
0.390
106 (63.5%)
106 (63.5%)
1.000
Diabetes mellitus
177 (38.4%)
85 (34.1%)
0.262
51 (30.5%)
52 (31.1%)
1.000
Hypercholesterolemia
52 (11.3%)
26 (10.4%)
0.733
20 (12.0%)
19 (11.4%)
1.000
Renal insufficiency
52 (11.3%)
27 (10.8%)
0.860
11 (6.6%)
14 (8.4%)
0.678
Cardiac history
Prior angina
41 (8.9%)
18 (7.2%)
0.443
12 (7.2%)
13 (7.8%)
1.000
Prior myocardial infarction
100 (21.7%)
55 (22.1%)
0.903
41 (24.6%)
41 (24.6%)
1.000
Prior percutaneous coronary intervention
75 (16.3%)
41 (16.5%)
0.946
22 (13.2%)
26 (15.6%)
0.626
Prior coronary artery bypass grafting
34 (7.4%)
20 (8.0%)
0.753
8 (4.8%)
13 (7.8%)
0.359
Prior congestive heart failure
79 (17.1%)
45 (18.1%)
0.754
23 (13.8%)
28 (16.8%)
0.551
Prior valve disease
30 (6.5%)
25 (10.0%)
0.093
14 (8.4%)
18 (10.8%)
0.541
History of vascular diseases
Prior stroke/Transient ischemic attack
31 (6.7%)
18 (7.2%)
0.800
7 (4.2%)
11 (6.6%)
0.481
Prior peripheral vascular disease
20 (4.3%)
13 (5.2%)
0.594
6 (3.6%)
8 (4.8%)
0.791
Prior hemorrhage
3 (0.7%)
2 (0.8%)
1.000
1 (0.6%)
1 (0.6%)
1.000
Prior thrombosis
20 (4.3%)
11 (4.4%)
0.961
7 (4.2%)
7 (4.2%)
1.000
In-hospital cardiac diseases
Angina
45 (9.8%)
26 (10.4%)
0.773
21 (12.6%)
20 (12.0%)
1.000
Myocardial infarction
191 (41.4%)
89 (35.7%)
0.139
63 (37.7%)
66 (39.5%)
0.822
Percutaneous transluminal coronary angioplasty
234 (50.8%)
142 (57.0%)
0.110
92 (55.1%)
92 (55.1%)
1.000
Coronary artery bypass grafting
98 (21.3%)
41 (16.5%)
0.125
34 (20.4%)
31 (18.6%)
0.775
Cardiogenic shock
15 (3.3%)
5 (2.0%)
0.338
5 (3.0%)
3 (1.8%)
0.727
Laboratory values
Baseline platelet, × 109/L
192 (147.25−237)*
216 (165.5−257)*
0.005
201(158−249)*
215 (165−254)*
0.978
Baseline hemoglobin, g/dL
12.40 (10.60−14.30)*
12.40 (10.70−14.30)*
0.767
12.3 (10.4−14.3)*
12.2 (10.2−14.5)*
0.862
Baseline white blood cells, × 109/L
12.00 (9.36−16.90)*
13.00 (9.20−18.42)*
0.202
12 (9.6−16.5)*
13.2 (9.5−18.4)*
0.583
Baseline glucose, mmol/L
8.06 (6.43−10.94)*
8.64 (6.50−12.92)*
0.037
8.39 (6.78−11.83)*
8.39 (6.5−11.28)*
0.739
Baseline creatinine, mg/dL
1.07 (0.87−1.35)*
1.12 (0.90−1.52)*
0.07
1.04 (0.84−1.27)*
1.08 (0.87−1.49)*
0.107
Periprocedural medication
Aspirin
377 (81.8%)
199 (79.9%)
0.546
141 (84.4%)
132 (79.0%)
0.233
Aggregation inhibitors
168 (36.4%)
75 (30.1%)
0.090
58 (34.7%)
56 (33.5%)
0.913
Glycoprotein IIB/IIIA inhibitor
91 (19.7%)
37 (14.9%)
0.106
23 (13.8%)
23 (13.8%)
1.000
Unfractionated heparin
282 (61.2%)
151 (60.6%)
0.725
103 (61.7%)
106 (63.5%)
0.820
Low molecular weight heparin
95 (20.6%)
63 (25.3%)
0.151
42 (25.1%)
38 (22.8%)
0.683
Warfarin
45 (9.8%)
38 (15.3%)
0.030
20 (12.0%)
20 (12.0%)
1.000
Fondaparinux
1 (0.2%)
6 (2.4%)
0.015
1 (0.6%)
1 (0.6%)
1.000
Thrombin inhibitor
46 (10.0%)
31 (12.4%)
0.312
23 (13.8%)
15 (9.0%)
0.243
Thrombolytic therapy
3 (0.7%)
6 (2.4%)
0.099
1 (0.6%)
1 (0.6%)
1.000
Data are presented as n (%). *Presented as median (interquartile range). APACHE: Acute Physiology and Chronic Health Evaluation; DPC: drop in platelet count.
Figure
2.
Distribution plot of propensity score comparing non-thrombocytopenia group and thrombocytopenia group before (A & B) and after (C & D) matching.
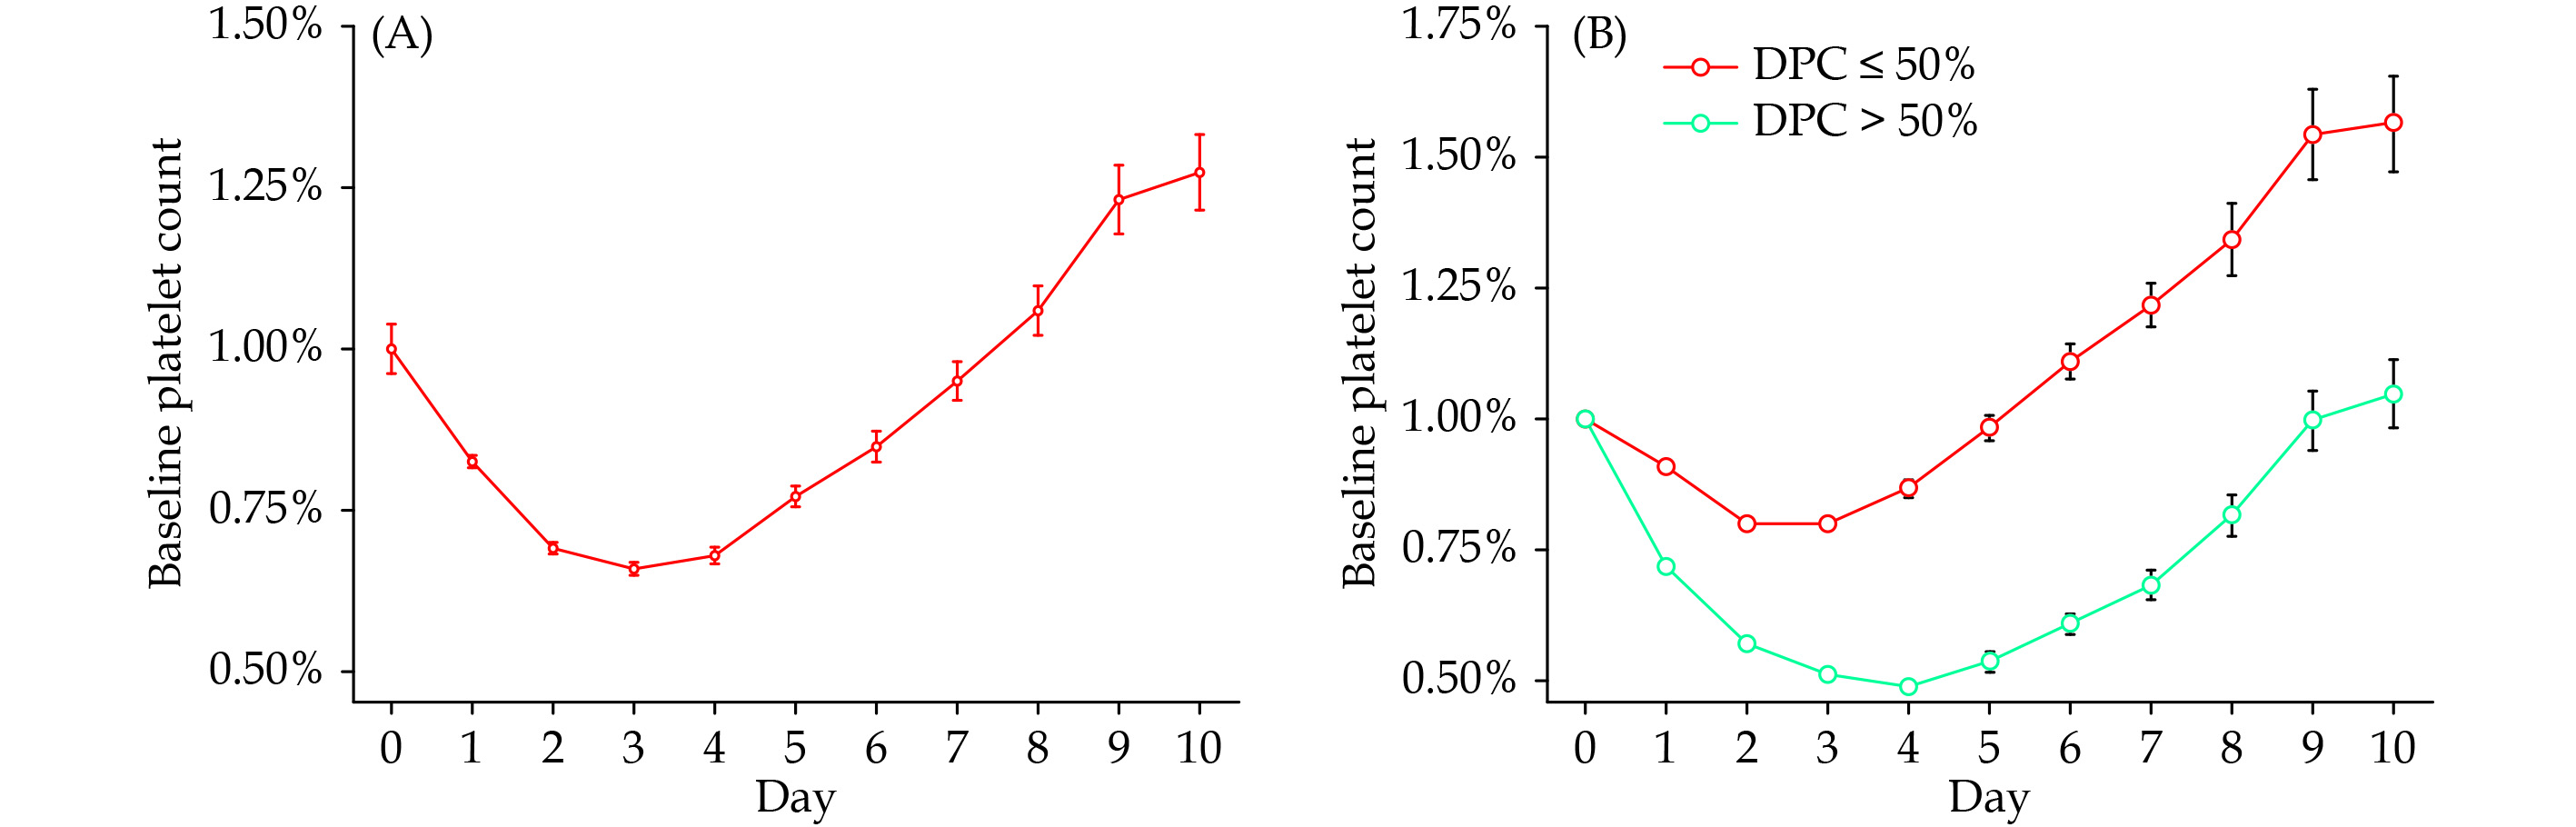
The platelet counts in the overall group began to decline after IABP initiation and continued to decrease through day 3 following the procedure (Figure 3). The median nadir platelet count was 115 × 109/L (25th to 75th percentile: 82.00 × 10⁹/L−155.25 × 109/L), resulting in a median DPC from baseline of 40.53% (25th to 75th percentile: 22.42%−55.70%). The platelet counts then stabilized and returned to the baseline on day 7−8. The mean time of platelet counts decline to nadir was 4 days for patients with thrombocytopenia and 2−3 days for patients without thrombocytopenia. Moreover, the DPC was significantly higher in patients who developed thrombocytopenia than in those who did not (62.1% vs. 27.6%, P < 0.001). The mean time taken for the platelet counts to return to the baseline was 9 days for patients with thrombocytopenia and 5 days for patients without thrombocytopenia.
Figure
3.
Changing curve of platelet count.
(A): Platelet count as a percentage of baseline ± standard error; and (B): platelet count as a percentage of baseline ± standard error according to DPC. DPC: drop in platelet count.
As shown in Table 2, a significantly unadjusted difference in in-hospital mortality was observed in patients who developed thrombocytopenia compared with patients who did not (26.5% vs. 14.8%, P < 0.001), with a similar difference seen in in-ICU mortality (22.1% vs. 11.9%, P < 0.001). However, after adjustment for differences, thrombocytopenia was not an independent predictor of in-hospital mortality [odds ratio (OR) = 0.91, 95% confidence interval (CI): 0.49−1.70, P = 0.913) or in-ICU mortality (OR = 0.98, 95% CI: 0.50−1.89, P = 0.940)]. The incidence of major bleeding increased with the development of thrombocytopenia, from 17.1% to 35.7% (P < 0.001). Additionally, patients with thrombocytopenia still remained at a significantly high risk for major bleeding (OR = 2.76, 95% CI: 1.80−4.23, P < 0.001) on multivariate analysis. Both in-hospital LOS (10.81 vs. 8.09, P < 0.001) and in-ICU LOS (5.13 vs. 2.92, P < 0.001) were progressively lengthened in the thrombocytopenia group versus in the non-thrombocytopenia group.
Table
2.
In-hospital clinical outcomes in the entire population.
Non-thrombocytopenia (n = 461, DPC ≤ 50%)
Thrombocytopenia (n = 249, DPC > 50%)
P-value
Unadjusted OR
95% CI
Adjusted OR
95% CI
P-value
Clinical outcomes
In-hospital mortality
68 (14.8%)
66 (26.5%)
< 0.001
2.08
1.42−3.05
0.91
0.49−1.70
0.913
In-ICU mortality
55 (11.9%)
55 (22.1%)
< 0.001
2.08
1.38−3.13
0.98
0.50−1.89
0.940
Major bleeding
79 (17.1%)
89 (35.7%)
< 0.001
2.69
1.89−3.84
2.76
1.80−4.23
< 0.001
Hospital LOS, day
8.09 (4.86−15.42)*
10.81 (6.64−19.41)*
< 0.001
−
−
−
−
−
ICU LOS, day
2.92 (1.79−5.19)*
5.13 (2.92−9.69)*
< 0.001
−
−
−
−
−
Other clinical complications
Transfusion
28 (6.1%)
39 (15.7%)
< 0.001
2.87
1.72−4.80
2.93
1.51−5.68
0.002
Transfusion of red blood cell
27 (5.9%)
38 (15.3%)
< 0.001
2.90
1.72−4.87
2.89
1.47−5.69
0.002
Transfusion of platelet
8 (1.7%)
9 (3.6%)
0.118
2.12
0.81−5.57
−
−
−
Tromboembolic events
4 (0.9%)
6 (2.4%)
0.183
2.82
0.79−10.09
−
−
−
Post-procedural renal insufficiency
70 (15.2%)
87 (34.9%)
< 0.001
2.97
2.05−4.29
3.14
2.03−4.88
< 0.001
Dialysis
16 (3.5%)
35 (14.1%)
< 0.001
4.55
2.46−8.40
4.82
2.02−11.46
< 0.001
Mechanical ventilation
172 (37.3%)
143 (57.4%)
< 0.001
2.27
1.66−3.10
1.83
1.25−2.68
0.002
Data are presented as n (%). *Presented as median (interquartile range). CI: confidence interval; DPC: drop in platelet count; ICU: intensive care unit; LOS: length of stay; OR: odds ratio.
Patients with thrombocytopenia were more likely to have other in-hospital complications, including transfusion, post-procedural renal insufficiency, dialysis, and mechanical ventilation (Table 2). However, there was no difference in thromboembolic events between the two groups (0.9% vs. 2.4%, P = 0.183). After adjusting the differences, patients with thrombocytopenia remained at an increased risk for clinical complications, including transfusion (OR = 2.93, 95% CI: 1.51−5.68, P = 0.002), post-procedural renal insufficiency (OR = 3.14, 95% CI: 2.03−4.88, P < 0.001), dialysis (OR = 4.82, 95% CI: 2.02−11.46, P < 0.001), and mechanical ventilation (OR = 1.83, 95% CI: 1.25−2.68, P = 0.002).
Greater severity of laboratory change could also be plotted among the thrombocytopenia group (supplemental material, Table 1S). Patients who developed thrombocytopenia were more likely to have a lower nadir and a greater DPC (P < 0.001), as well as hemoglobin level (P < 0.001). The maximum values of WBC count (P < 0.001) and creatinine level (P < 0.001) were larger in the thrombocytopenia group than in the non-thrombocytopenia group, with a similarly larger increase in absolute value (P < 0.001).
Clinical Outcomes in the Propensity Score-matched Population
After the PS matching, no significant differences were seen between the two groups in in-hospital mortality (21.0% vs. 24.0%, P = 0.583) or in-ICU mortality (18.6% vs. 21.0%, P = 0.671) (Table 3). The incidence rate of major bleeding was higher in the thrombocytopenia group than in the non-thrombocytopenia group (39.5% vs. 22.2%, P = 0.001). Similar results remained in in-hospital mortality (OR = 0.76, 95% CI: 0.37−1.56, P = 0.448), in-ICU mortality (OR = 0.74, 95% CI: 0.34−1.63, P = 0.459), and major bleeding (OR = 2.54, 95% CI: 1.54−4.17, P < 0.001) after multivariate analysis. Moreover, patients with thrombocytopenia were still more likely to stay longer both in-hospital (9.71 vs. 7.36, P < 0.001) and in-ICU (5.13 vs. 2.83, P < 0.001).
Table
3.
In-hospital clinical outcomes in the propensity score-matched cohort.
Non-thrombocytopenia (n = 167, DPC ≤ 50%)
Thrombocytopenia (n = 167, DPC > 50%)
P-value
Adjusted OR
95% CI
P-value
Clinical outcomes
In-hospital mortality
35 (21.0%)
40 (24.0%)
0.583
0.76
0.37−1.56
0.448
In-ICU mortality
31 (18.6%)
35 (21.0%)
0.671
0.74
0.34−1.63
0.459
Major bleeding
37 (22.2%)
66 (39.5%)
0.001
2.54
1.54−4.17
< 0.001
Hospital LOS, day
7.36 (3.77−10.42)*
9.71 (6.36−16.81)*
< 0.001
−
−
−
ICU LOS, day
2.83 (1.63−4.88)*
5.13 (2.96−9.67)*
< 0.001
−
−
−
Other clinical complications
Transfusion
15 (9.0%)
26 (15.6%)
0.091
2.22
1.05−4.70
0.036
Transfusion of red blood cell
15 (9.0%)
25 (15.0%)
0.123
2.01
0.96−4.24
0.066
Transfusion of platelet
4 (2.4%)
6 (3.6%)
0.688
−
−
−
Tromboembolic events
2 (1.2%)
2 (1.2%)
1.000
−
−
−
Post-procedural renal insufficiency
27 (16.2%)
57 (34.1%)
0.001
3.04
1.76−5.27
< 0.001
Dialysis
5 (3.0%)
21 (12.6%)
0.002
7.58
2.18−26.30
0.001
Mechanical ventilation
70 (41.9%)
92 (55.1%)
0.020
1.89
1.19−2.98
0.007
Data are presented as n (%). *Presented as median (interquartile range). CI: confidence interval; DPC: drop in platelet count; ICU: intensive care unit; LOS: length of stay; OR: odds ratio.
Patients with thrombocytopenia reported a high incidence of post-procedural renal insufficiency, dialysis, and mechanical ventilation; however, the frequency of transfusion (9.0% vs. 15.6%, P = 0.091) and thromboembolic events (1.2% vs. 1.2%, P = 1.000) was similar (Table 3). However, significant adjusted differences were maintained in clinical complications, including transfusion (OR = 2.22, 95% CI: 1.05−4.70, P = 0.036), post-procedural renal insufficiency (OR = 3.04, 95% CI: 1.76−5.27, P < 0.001), dialysis (OR = 7.58, 95% CI: 2.18−26.30, P = 0.001), and mechanical ventilation (OR = 1.89, 95% CI: 1.19−2.98, P = 0.007).
In the PS-matched cohort, laboratory change was similar to the result observed in the entire cohort (supplemental material, Table 2S). The thrombocytopenia group also had a greater likelihood of a lower nadir and a greater DPC (P < 0.001), as well as hemoglobin (P < 0.001). Similarly, the WBC (P = 0.002) and creatinine (P < 0.001) maximum value was larger in the thrombocytopenia group, with a larger increase in absolute value (P < 0.001).
Predictors of IABP-related Thrombocytopenia
Table 4 indicates that baseline platelet count, baseline glucose level, diabetes mellitus, prior valve diseases, in-hospital PTCA, and the use of glycoprotein IIB/IIIA inhibitors were independent predictors of IABP-related thrombocytopenia. Another predictor worthy of notice was APACHE IVa score (OR = 1.09, 95% CI: 1.02−1.15, P = 0.01), suggesting that patients with more severe illness on ICU admission had high risks of acquiring IABP-related thrombocytopenia. Sex, although significantly associated univariate, did not remain a risk factor after multiple adjustment. The prediction model demonstrated adequate calibration and discriminatory capacity for the patients as a whole (Hosmer-Lemeshow goodness-of-fit test P = 0.758, AUC = 0.648, 95% CI: 0.603−0.694).
Table
4.
Independent predictive factors of thrombocytopenia (platelet count drop > 50%).
The predictors of major bleeding in the entire cohort were listed (supplemental material, Table 3S). Beyond thrombocytopenia, other variables including APACHE IVa score, baseline platelet count, baseline glucose, hypercholesterolemia, prior angina, prior CHF, prior valve diseases and LMWH use were predictive factors of major bleeding. Notably, despite close univariate association of in-hospital CABG with major bleeding (unadjusted OR = 1.67, 95% CI: 1.11−2.51, P = 0.013), surgery did not remain a risk factor after multiple adjustment. Furthermore, adequate calibration and discriminatory capacity were observed in this model for the overall patients (Hosmer-Lemeshow goodness-of-fit test P = 0.219, AUC = 0.710, 95% CI: 0.665−0.755).
DISCUSSION
The current study revealed the incidence, predictors, and prognosis of thrombocytopenia in a large retrospective, multi-center, cohort of patients undergoing IABP in the ICUs. Thrombocytopenia occurred among 35.07% of patients undergoing IABP in the entire cohort. APACHE IVa score was found to be a significant predictor of both IABP-related thrombocytopenia and major bleeding. No association between IABP-related thrombocytopenia and in-hospital or in-ICU mortality was observed, both in the entire cohort and the PS-matching cohort. However, IABP-related thrombocytopenia was significantly associated with a longer duration of ICU and hospital LOS, and a greater risk of major bleeding and other clinical complications.
Incidence of thrombocytopenia varied between different studies with various definitions of thrombocytopenia.[9,12,17–19] In a study by Sheng, et al.,[12] thrombocytopenia, defined as a nadir platelet count of < 150 × 109/L or DPC > 50%, was observed in 54.5% of enrolled patients undergoing IABP with ACS. A similar definition yielded the incidence of 43.3% among patients undergoing IABP in the coronary care unit.[9] Among patients treated with PCI, the incidence of thrombocytopenia was 16.2%; however, in this study, thrombocytopenia was only defined as DPC ≥ 25%.[18] In a study of ACS patients by Wang, et al.,[19] 12.5% patients were reported to develop in-hospital thrombocytopenia (nadir platelet < 150 × 109/L) after treatment with ACS therapies. Therefore, the studies related to thrombocytopenia still lack a uniform definition of post-procedure thrombocytopenia. In our study, despite the exclusion of patients with baseline platelet count < 100 × 109/L from the study cohort, 163 patients (22.96% among the entire cohort) had marginally low baseline platelet count (100 × 109/L−150 × 109/L). In such patients, the definition of IABP-related thrombocytopenia, if based on nadir of platelet count post-IABP, might be met despite a minor effect of the IABP on the platelet count. We intended to focus on the impact of IABP-related DPC rather than absolute count value on clinical outcomes. Therefore, thrombocytopenia was defined as a DPC > 50% from the baseline platelet count. We found that the incidence of thrombocytopenia was 35.09%, slightly lower to that observed in previous IABP-related studies.
Several prior reports have indicated that the impact of IABP-related thrombocytopenia on clinical outcomes remains uncertain.[9,12] In this study, the entire cohort had lower platelet counts at the baseline and nadir compared to previous studies.[9,12] More importantly, the platelet count drop was higher. Major bleeding (23.7%) occurred far more frequently compared with the study results of Roy, et al.[9] (8.3%) and Sheng, et al.[12] (5.4%). The incidence of in-hospital mortality (18.9%) was higher than that reported by Sheng, et al.[12] (5.9%), but slightly lower than that reported by Roy, et al.[9] (21.4%). Our work showed that IABP-related thrombocytopenia was not significantly associated with in-hospital or in-ICU mortality in the critically ill patients. Among the entire population however, on univariate analysis, patients with thrombocytopenia had a greater risk of in-hospital death (26.5% vs. 14.8%, P < 0.001) and in-ICU death (22.1% vs. 11.9%, P < 0.001) than those who did not. That might be related to the higher APACHE IVa score among the thrombocytopenia group, which revealed that this group of patients presented with a more severe illness on admission to ICU and higher possibility of worsening outcomes. After controlling for patient differences, IABP-related thrombocytopenia was not a predictor of in-hospital or in-ICU mortality.
Despite the negative finding of in-hospital and in-ICU mortality, IABP-related thrombocytopenia was significantly associated with major bleeding. This finding was different from two previous studies, which both reported that thrombocytopenia was not a predictor of major bleeding.[9,12] Moreover, IABP-related thrombocytopenia was also associated with other clinical complications, including transfusion, post-procedural renal insufficiency, dialysis, and mechanical ventilation. Additionally, patients with thrombocytopenia were more likely to stay longer in the ICU and hospital. This might be because the greater incidence of clinical complications contributed to the longer duration of ICU and hospital LOS. These findings have never been reported by previous studies. Taken together, these findings suggested that IABP-related thrombocytopenia was not a fatal clinical problem but might worsen the severity of patient illness and prolong the ICU and hospital LOS.
The current study showed that patients who developed thrombocytopenia presented with a higher APACHE IVa score, use of glycoprotein IIB/IIIA inhibitor, and history of diabetes mellitus and valve diseases. Previous studies reported that thrombocytopenia was correlated with older age; female sex; weight; renal insufficiency; duration of IABP; and several medications, including heparin, clopidogrel, and glycoprotein IIB/IIIA inhibitors.[20–23] Thrombocytopenia among patients undergoing IABP can be the consequence of different causes. It may be either an immune reaction due to heparins or glycoprotein IIB/IIIA inhibitors,[24,25] a loss of consumption due to PCI or IABP, acute heart failure, sepsis, renal failure, or multiple organ dysfunction.[23,26–28] Our study notably reported the association of APACHE IVa score with the development of thrombocytopenia. The APACHE IVa score is an evaluation system to present illness severity of patients on admission to the ICU. Patients with high APACHE IVa scores might have severe sepsis, organ failure, and even multiple organ dysfunction. In such patients, the DPC might be caused by these factors. Therefore, APACHE IVa score was the significant predictor of IABP-related thrombocytopenia.
STRENGTHS AND LIMITATIONS
This study had several strengths. Firstly, this study was based on a large, retrospective, multi-center compared to previous single-center studies on IABP. Secondly, the APACHE IVa score was used as a quantitative variable and was included as one of the covariates in the multivariate logistic regression. However, there were also several limitations that require consideration. Firstly, although a multivariate analysis and a PS analysis were used to adjust for differences in baseline characteristics, the potential for unaccounted confounding factors might still be present in this study. Secondly, only the DPC was taken into consideration, so the impact of platelet count nadir on the clinical outcomes was not explored in this study. Therefore, the risks of clinical outcomes might be overestimated among patients with DPC ≤ 50%, but not platelet count nadir < 150 × 109/L. Thirdly, IABP duration, which was reported to be related to thrombocytopenia and major bleeding among patients undergoing IABP,[9,12] was not available in the eICU-CRD V1.2 online. Therefore, it was not included as a variable in the study, and we cannot ignore the possibility of its significance. Last but not least, we only studied the data of in-hospital outcomes. Further research is required to confirm the long-term outcomes, which might provide more powerful information on clinical decisions.
CONCLUSIONS
In conclusion, thrombocytopenia occurred among 35.07% of patients who underwent IABP in ICUs. It was not associated with a difference in in-hospital mortality or in-ICU mortality, but significantly associated with a greater risk of increased in-ICU LOS, in-hospital LOS, major bleeding, and other clinical complications. APACHE IVa score was a potential predictor of IABP-related thrombocytopenia.
ACKNOWLEDGMENTS
This study was supported by the National Key R&D Program of China (2018YFC0910700), the National Natural Science Foundation of China (No.61672450), the Beijing Municipal Science and Technology Project (Z181100001918023), and the Big Data R&D Project of Chinese PLA General Hospital (2018MBD-009). All authors had no conflicts of interest to disclose.
Stretch R, Sauer CM, Yuh DD, et al. National trends in the utilization of short-term mechanical circulatory support: incidence, outcomes, and cost analysis. J Am Coll Cardiol 2014; 64: 1407−1415. doi: 10.1016/j.jacc.2014.07.958
van Nunen LX, Noc M, Kapur NK, et al. Usefulness of intra-aortic balloon pump counterpulsation. Am J Cardiol 2016; 117: 469−476. doi: 10.1016/j.amjcard.2015.10.063
[4]
Ferguson JJ 3rd, Cohen M, Freedman RJ Jr, et al. The current practice of intra-aortic balloon counterpulsation: results from the Benchmark Registry. J Am Coll Cardiol 2001; 38: 1456−1462. doi: 10.1016/S0735-1097(01)01553-4
[5]
Parissis H, Graham V, Lampridis S, et al. IABP: history-evolution-pathophysiology-indications: what we need to know. J Cardiothorac Surg 2016; 11: 122. doi: 10.1186/s13019-016-0513-0
[6]
Kapelios CJ, Terrovitis JV, Nanas JN. Current and future applications of the intra-aortic balloon pump. Curr Opin Cardiol 2014; 29: 258−265. doi: 10.1097/HCO.0000000000000059
[7]
Parissis H, Soo A, Al-Alao B. Intra aortic balloon pump: literature review of risk factors related to complications of the intraaortic balloon pump. J Cardiothorac Surg 2011; 6: 147. doi: 10.1186/1749-8090-6-147
[8]
Cohen M, Urban P, Christenson JT, et al. Intra-aortic balloon counterpulsation in US and non-US centres: results of the Benchmark Registry. Eur Heart J 2003; 24: 1763−1770. doi: 10.1016/j.ehj.2003.07.002
[9]
Roy SK, Howard EW, Panza JA, et al. Clinical implications of thrombocytopenia among patients undergoing intra-aortic balloon pump counterpulsation in the coronary care unit. Clin Cardiol 2010; 33: 30−35. doi: 10.1002/clc.20694
[10]
Vonderheide RH, Thadhani R, Kuter DJ. Association of thrombocytopenia with the use of intra-aortic balloon pumps. Am J Med 1998; 105: 27−32. doi: 10.1016/S0002-9343(98)00128-4
[11]
McCabe JC, Abel RM, Subramanian VA, et al. Complications of intra-aortic balloon insertion and counterpulsation. Circulation 1978; 57: 769−773. doi: 10.1161/01.CIR.57.4.769
[12]
Sheng Z, Zhao H, Yan H, et al. Intra-aortic balloon pumping and thrombocytopenia in patients with acute coronary syndrome: incidence, risk factors, and prognosis. Herz 2018; 43: 555−564. doi: 10.1007/s00059-017-4599-5
[13]
Essay P, Shahin TB, Balkan B, et al. The connected intensive care unit patient: exploratory analyses and cohort discovery from a critical care telemedicine database. JMIR Med Inform 2019; 7: e13006. doi: 10.2196/13006
[14]
McShea M, Holl R, Badawi O, et al. The eICU research institute: a collaboration between industry, health-care providers, and academia. IEEE Eng Med Biol Mag 2010; 29: 18−25. doi: 10.1109/MEMB.2009.935720
[15]
Pollard TJ, Johnson AEW, Raffa JD, et al. The eICU Collaborative Research Database, a freely available multi-center database for critical care research. Sci Data 2018; 5: 180178. doi: 10.1038/sdata.2018.178
[16]
Vincent JL, Moreno R. Clinical review: scoring systems in the critically ill. Crit Care 2010; 14: 207. doi: 10.1186/cc8204
[17]
Vora AN, Chenier M, Schulte PJ, et al. Long-term outcomes associated with hospital acquired thrombocytopenia among patients with non-ST-segment elevation acute coronary syndrome. Am Heart J 2014; 168: 189−196.e1. doi: 10.1016/j.ahj.2014.04.010
[18]
De Labriolle A, Bonello L, Lemesle G, et al. Decline in platelet count in patients treated by percutaneous coronary intervention: definition, incidence, prognostic importance, and predictive factors. Eur Heart J 2010; 31: 1079−1087. doi: 10.1093/eurheartj/ehp594
[19]
Wang TY, Ou FS, Roe MT, et al. Incidence and prognostic significance of thrombocytopenia developed during acute coronary syndrome in contemporary clinical practice. Circulation 2009; 119: 2454−2462. doi: 10.1161/CIRCULATIONAHA.108.827162
[20]
Caixeta A, Dangas GD, Mehran R, et al. Incidence and clinical consequences of acquired thrombocytopenia after antithrombotic therapies in patients with acute coronary syndromes: results from the Acute Catheterization and Urgent Intervention Triage Strategy (ACUITY) trial. Am Heart J 2011; 161: 298−306.e1. doi: 10.1016/j.ahj.2010.10.035
[21]
Bream-Rouwenhorst HR, Hobbs RA, Horwitz PA. Thrombocytopenia in patients treated with heparin, combination antiplatelet therapy, and intra-aortic balloon pump counterpulsation. J Interv Cardiol 2008; 21: 350−356. doi: 10.1111/j.1540-8183.2008.00363.x
[22]
Sekhon SS, Roy V. Thrombocytopenia in adults: a practical approach to evaluation and management. South Med J 2006; 99: 491−498. doi: 10.1097/01.smj.0000209275.75045.d4
[23]
Hui P, Cook DJ, Lim W, et al. The frequency and clinical significance of thrombocytopenia complicating critical illness: a systematic review. Chest 2011; 139: 271−278. doi: 10.1378/chest.10-2243
[24]
Jang IK, Hursting MJ. When heparins promote thrombosis: review of heparin-induced thrombocytopenia. Circulation 2005; 111: 2671−2683. doi: 10.1161/CIRCULATIONAHA.104.518563
[25]
EPILOG Investigators. Platelet glycoprotein IIb/IIIa receptor blockade and low-dose heparin during percutaneous coronary revascularization. N Engl J Med 1997; 336: 1689−1696. doi: 10.1056/NEJM199706123362401
[26]
Crowther MA, Cook DJ, Meade MO, et al. Thrombocytopenia in medical-surgical critically ill patients: prevalence, incidence, and risk factors. J Crit Care 2005; 20: 348−353. doi: 10.1016/j.jcrc.2005.09.008
[27]
Ben Hamida C, Lauzet JY, Rézaiguia-Delclaux S, et al. Effect of severe thrombocytopenia on patient outcome after liver transplantation. Intensive Care Med 2003; 29: 756−762. doi: 10.1007/s00134-003-1727-x
[28]
Fountain EM, Arepally GM. Etiology and complications of thrombocytopenia in hospitalized medical patients. J Thromb Thrombolysis 2017; 43: 429−436. doi: 10.1007/s11239-016-1467-8
Table
1.
Baseline characteristics before and after propensity score matching.
Variables
Entire cohort (n = 710)
Matched cohort (n = 334)
Non-thrombocytopenia (n = 461, DPC ≤ 50%)
Thrombocytopenia (n = 249, DPC > 50%)
P- value
Non-thrombocytopenia (n = 167, DPC ≤ 50%)
Thrombocytopenia (n = 167, DPC > 50%)
P- value
Age, yrs
65 (58−75)*
67 (59.5−74)*
0.235
66 (60−76)*
68 (60−74)*
0.827
Male
338 (73.3%)
164 (65.9%)
0.037
110 (65.9%)
111 (66.5%)
1.000
Caucasian
369 (80.0%)
187 (75.1%)
0.127
126 (75.4%)
130 (77.8%)
0.671
Body mass index, kg/m2
29.06 (25.16−33.01)*
27.95 (24.93−32.22)*
0.113
28.7 (24.95−33.27)*
27.66 (24.93−32.38)*
0.318
APACHE IVa score
52 (38.25−76)*
65 (43−98)*
< 0.001
60 (45−92)*
61 (42−93)*
0.544
Mean arterial pressure, mm Hg
76.33 (66.67−87.33)*
76.83 (65.58−90.33)*
0.724
76.33 (68−86.67)*
77.67 (65.67−90.33)*
0.679
Cardiovascular risk factors
Hypertension
283 (61.4%)
161 (64.7%)
0.390
106 (63.5%)
106 (63.5%)
1.000
Diabetes mellitus
177 (38.4%)
85 (34.1%)
0.262
51 (30.5%)
52 (31.1%)
1.000
Hypercholesterolemia
52 (11.3%)
26 (10.4%)
0.733
20 (12.0%)
19 (11.4%)
1.000
Renal insufficiency
52 (11.3%)
27 (10.8%)
0.860
11 (6.6%)
14 (8.4%)
0.678
Cardiac history
Prior angina
41 (8.9%)
18 (7.2%)
0.443
12 (7.2%)
13 (7.8%)
1.000
Prior myocardial infarction
100 (21.7%)
55 (22.1%)
0.903
41 (24.6%)
41 (24.6%)
1.000
Prior percutaneous coronary intervention
75 (16.3%)
41 (16.5%)
0.946
22 (13.2%)
26 (15.6%)
0.626
Prior coronary artery bypass grafting
34 (7.4%)
20 (8.0%)
0.753
8 (4.8%)
13 (7.8%)
0.359
Prior congestive heart failure
79 (17.1%)
45 (18.1%)
0.754
23 (13.8%)
28 (16.8%)
0.551
Prior valve disease
30 (6.5%)
25 (10.0%)
0.093
14 (8.4%)
18 (10.8%)
0.541
History of vascular diseases
Prior stroke/Transient ischemic attack
31 (6.7%)
18 (7.2%)
0.800
7 (4.2%)
11 (6.6%)
0.481
Prior peripheral vascular disease
20 (4.3%)
13 (5.2%)
0.594
6 (3.6%)
8 (4.8%)
0.791
Prior hemorrhage
3 (0.7%)
2 (0.8%)
1.000
1 (0.6%)
1 (0.6%)
1.000
Prior thrombosis
20 (4.3%)
11 (4.4%)
0.961
7 (4.2%)
7 (4.2%)
1.000
In-hospital cardiac diseases
Angina
45 (9.8%)
26 (10.4%)
0.773
21 (12.6%)
20 (12.0%)
1.000
Myocardial infarction
191 (41.4%)
89 (35.7%)
0.139
63 (37.7%)
66 (39.5%)
0.822
Percutaneous transluminal coronary angioplasty
234 (50.8%)
142 (57.0%)
0.110
92 (55.1%)
92 (55.1%)
1.000
Coronary artery bypass grafting
98 (21.3%)
41 (16.5%)
0.125
34 (20.4%)
31 (18.6%)
0.775
Cardiogenic shock
15 (3.3%)
5 (2.0%)
0.338
5 (3.0%)
3 (1.8%)
0.727
Laboratory values
Baseline platelet, × 109/L
192 (147.25−237)*
216 (165.5−257)*
0.005
201(158−249)*
215 (165−254)*
0.978
Baseline hemoglobin, g/dL
12.40 (10.60−14.30)*
12.40 (10.70−14.30)*
0.767
12.3 (10.4−14.3)*
12.2 (10.2−14.5)*
0.862
Baseline white blood cells, × 109/L
12.00 (9.36−16.90)*
13.00 (9.20−18.42)*
0.202
12 (9.6−16.5)*
13.2 (9.5−18.4)*
0.583
Baseline glucose, mmol/L
8.06 (6.43−10.94)*
8.64 (6.50−12.92)*
0.037
8.39 (6.78−11.83)*
8.39 (6.5−11.28)*
0.739
Baseline creatinine, mg/dL
1.07 (0.87−1.35)*
1.12 (0.90−1.52)*
0.07
1.04 (0.84−1.27)*
1.08 (0.87−1.49)*
0.107
Periprocedural medication
Aspirin
377 (81.8%)
199 (79.9%)
0.546
141 (84.4%)
132 (79.0%)
0.233
Aggregation inhibitors
168 (36.4%)
75 (30.1%)
0.090
58 (34.7%)
56 (33.5%)
0.913
Glycoprotein IIB/IIIA inhibitor
91 (19.7%)
37 (14.9%)
0.106
23 (13.8%)
23 (13.8%)
1.000
Unfractionated heparin
282 (61.2%)
151 (60.6%)
0.725
103 (61.7%)
106 (63.5%)
0.820
Low molecular weight heparin
95 (20.6%)
63 (25.3%)
0.151
42 (25.1%)
38 (22.8%)
0.683
Warfarin
45 (9.8%)
38 (15.3%)
0.030
20 (12.0%)
20 (12.0%)
1.000
Fondaparinux
1 (0.2%)
6 (2.4%)
0.015
1 (0.6%)
1 (0.6%)
1.000
Thrombin inhibitor
46 (10.0%)
31 (12.4%)
0.312
23 (13.8%)
15 (9.0%)
0.243
Thrombolytic therapy
3 (0.7%)
6 (2.4%)
0.099
1 (0.6%)
1 (0.6%)
1.000
Data are presented as n (%). *Presented as median (interquartile range). APACHE: Acute Physiology and Chronic Health Evaluation; DPC: drop in platelet count.
Table
2.
In-hospital clinical outcomes in the entire population.
Non-thrombocytopenia (n = 461, DPC ≤ 50%)
Thrombocytopenia (n = 249, DPC > 50%)
P-value
Unadjusted OR
95% CI
Adjusted OR
95% CI
P-value
Clinical outcomes
In-hospital mortality
68 (14.8%)
66 (26.5%)
< 0.001
2.08
1.42−3.05
0.91
0.49−1.70
0.913
In-ICU mortality
55 (11.9%)
55 (22.1%)
< 0.001
2.08
1.38−3.13
0.98
0.50−1.89
0.940
Major bleeding
79 (17.1%)
89 (35.7%)
< 0.001
2.69
1.89−3.84
2.76
1.80−4.23
< 0.001
Hospital LOS, day
8.09 (4.86−15.42)*
10.81 (6.64−19.41)*
< 0.001
−
−
−
−
−
ICU LOS, day
2.92 (1.79−5.19)*
5.13 (2.92−9.69)*
< 0.001
−
−
−
−
−
Other clinical complications
Transfusion
28 (6.1%)
39 (15.7%)
< 0.001
2.87
1.72−4.80
2.93
1.51−5.68
0.002
Transfusion of red blood cell
27 (5.9%)
38 (15.3%)
< 0.001
2.90
1.72−4.87
2.89
1.47−5.69
0.002
Transfusion of platelet
8 (1.7%)
9 (3.6%)
0.118
2.12
0.81−5.57
−
−
−
Tromboembolic events
4 (0.9%)
6 (2.4%)
0.183
2.82
0.79−10.09
−
−
−
Post-procedural renal insufficiency
70 (15.2%)
87 (34.9%)
< 0.001
2.97
2.05−4.29
3.14
2.03−4.88
< 0.001
Dialysis
16 (3.5%)
35 (14.1%)
< 0.001
4.55
2.46−8.40
4.82
2.02−11.46
< 0.001
Mechanical ventilation
172 (37.3%)
143 (57.4%)
< 0.001
2.27
1.66−3.10
1.83
1.25−2.68
0.002
Data are presented as n (%). *Presented as median (interquartile range). CI: confidence interval; DPC: drop in platelet count; ICU: intensive care unit; LOS: length of stay; OR: odds ratio.
Table
3.
In-hospital clinical outcomes in the propensity score-matched cohort.
Non-thrombocytopenia (n = 167, DPC ≤ 50%)
Thrombocytopenia (n = 167, DPC > 50%)
P-value
Adjusted OR
95% CI
P-value
Clinical outcomes
In-hospital mortality
35 (21.0%)
40 (24.0%)
0.583
0.76
0.37−1.56
0.448
In-ICU mortality
31 (18.6%)
35 (21.0%)
0.671
0.74
0.34−1.63
0.459
Major bleeding
37 (22.2%)
66 (39.5%)
0.001
2.54
1.54−4.17
< 0.001
Hospital LOS, day
7.36 (3.77−10.42)*
9.71 (6.36−16.81)*
< 0.001
−
−
−
ICU LOS, day
2.83 (1.63−4.88)*
5.13 (2.96−9.67)*
< 0.001
−
−
−
Other clinical complications
Transfusion
15 (9.0%)
26 (15.6%)
0.091
2.22
1.05−4.70
0.036
Transfusion of red blood cell
15 (9.0%)
25 (15.0%)
0.123
2.01
0.96−4.24
0.066
Transfusion of platelet
4 (2.4%)
6 (3.6%)
0.688
−
−
−
Tromboembolic events
2 (1.2%)
2 (1.2%)
1.000
−
−
−
Post-procedural renal insufficiency
27 (16.2%)
57 (34.1%)
0.001
3.04
1.76−5.27
< 0.001
Dialysis
5 (3.0%)
21 (12.6%)
0.002
7.58
2.18−26.30
0.001
Mechanical ventilation
70 (41.9%)
92 (55.1%)
0.020
1.89
1.19−2.98
0.007
Data are presented as n (%). *Presented as median (interquartile range). CI: confidence interval; DPC: drop in platelet count; ICU: intensive care unit; LOS: length of stay; OR: odds ratio.


 DownLoad: