Please cite this article as: Khadija HA, Walt M, Gendelman G, Hamode A, Poles L, Jonas M, Jaber M, Sella G, Ayyad O, Tshori S, Blatt A, George J. Systemic inflammatory markers in elderly patients undergoing transcatheter aortic valve replacement. J Geriatr Cardiol 2022; 19(11): 811−821. DOI: 10.11909/j.issn.1671-5411.2022.11.009.
Citation:
Please cite this article as: Khadija HA, Walt M, Gendelman G, Hamode A, Poles L, Jonas M, Jaber M, Sella G, Ayyad O, Tshori S, Blatt A, George J. Systemic inflammatory markers in elderly patients undergoing transcatheter aortic valve replacement. J Geriatr Cardiol 2022; 19(11): 811−821. DOI: 10.11909/j.issn.1671-5411.2022.11.009.
Please cite this article as: Khadija HA, Walt M, Gendelman G, Hamode A, Poles L, Jonas M, Jaber M, Sella G, Ayyad O, Tshori S, Blatt A, George J. Systemic inflammatory markers in elderly patients undergoing transcatheter aortic valve replacement. J Geriatr Cardiol 2022; 19(11): 811−821. DOI: 10.11909/j.issn.1671-5411.2022.11.009.
Citation:
Please cite this article as: Khadija HA, Walt M, Gendelman G, Hamode A, Poles L, Jonas M, Jaber M, Sella G, Ayyad O, Tshori S, Blatt A, George J. Systemic inflammatory markers in elderly patients undergoing transcatheter aortic valve replacement. J Geriatr Cardiol 2022; 19(11): 811−821. DOI: 10.11909/j.issn.1671-5411.2022.11.009.
BACKGROUND Transcatheter aortic valve replacement (TAVR) provokes an early injury response, partially represented by dynamic changes in inflammatory markers. TAVR greatly benefits the elderly and we aimed to determine whether increased inflammatory markers post-TAVR in octagenerians were different than their younger counterparts and whether it was associated with adverse clinical outcomes.
METHODS Patients with severe symptomatic aortic stenosis who underwent transfemoral TAVR from January 2010 to December 2021 were enrolled. Total white blood cells (WBC) count and subpopulation dynamics were evaluated.
RESULTS Five-hundred and seven patients were finally included in the study, 65% of these patients were 80 or more years old (54% female, median age 84 [82-87]) years, with severe symptomatic aortic stenosis. In patients aged above 80 years (patients ≥ 80), we noticed significant kinetic changes in the WBC and their differential cellular subpopulations (P < 0.0001) between admission and early days post-procedure. This was evident by a significant increase in total WBC (median 7.1 to 9.4) and absolute neutrophil count (median 4.7 to 7.4), neutrophil–lymphocyte (NL) ratio (median 2.82 to 7.21), and a meaningful decrease in absolute lymphocyte count (median 1.5 to 1.0). Implantation of self-expandable valves (SEVs) was associated with a more pronounced inflammatory response than balloon-expandable valves (BEVs). Higher WBC and neutrophil counts were associated with higher mortality and major vascular complications at 30 days, in addition, higher neutrophil counts and NL ratios were found to be correlated to arrhythmia at 30 days with P values of 0.04 and 0.028, respectively.
CONCLUSION This is the first description of a differential age-related inflammatory response in patients after TAVR, which shows an association between inflammatory markers post procedure and clinical outcome. Nevertheless, survival rates were similar in the elderly population and in younger patients, despite the presence of comorbid conditions.
Transcatheter aortic valve replacement (TAVR) was introduced to meet the needs of patients with severe aortic stenosis and with a high younger patients with lower operative risks have been evaluated in a substantial group of TAVR studies and these patients comprise a growing population undergoing TAVR procedures.[1,2]
Ongoing research that focuses on geriatric patients has been curtailed for many reasons including that aortic stenosis is associated with poor prognosis, and the mortality rate is 12 times higher in symptomatic elderlies aged > 80 years who refuse surgery for aortic valve replacement.[3] Detailed studies can help us understand the special challenges that the elderly face when undergoing TAVR. It can help us better answer the different questions asked by patients and families about the procedure’s benefits and risks in a population with a shorter life expectancy and higher morbidity. The TAVR procedure itself has also evolved with time. Different and better valves have been introduced, imaging is constantly improving, and the surgeons’ skills are also improving with time and experience further stressing the need to better understand the pathophysiology of the response to injury following TAVR.[4]
The importance of immunological and physiological response to TAVR is not only interesting but also important. A systemic inflammatory response syndrome (SIRS) after TAVR is associated with a poor prognosis.[5-8] In recent years, much effort has gone into improving existing prognostic models for risk stratification of patients undergoing TAVR. The neutrophil to lymphocyte ratio (NLR) is a well described prognostic marker in cardiovascular medicine.[9-13] Better understanding of inflammatory responses after TAVR in the elderly can help us and improve our understanding and associate them with potential clinical outcome measures.
Our study focuses on older patients and compares clinical results to a group of younger patients. It describes the kinetic cellular immunologic response after TAVR, and its correlation to long-term clinical outcomes.
METHODS
Study Population
We retrospectively included patients with severe symptomatic aortic stenosis who underwent TAVR in our center between January 2010 and December 2021. This study was approved by Kaplan Medical Center’s IRB. We excluded patients with chronic systemic inflammatory or autoimmune diseases, acute infections and hematological disorders. Patients who did not have repeated blood tests and those with periprocedural death (up to 72 h after TAVR) were excluded as well.
TAVR Procedure
The size and type of the valves were chosen by the local cardiology team. The decision was based mainly on the computed tomography of the heart and peripheral vessels. The patient’s anatomical and clinical characteristics also directed the decision.
Patients treated with balloon-expandable valves (BEVs) were implanted with SAPIEN, SAPIEN XT, or SAPIEN 3 valves (Edwards Lifesciences, Irvine, CA, USA). Patients treated with self-expandable valves (SEVs) were implanted with either CoreValve, Evolut PRO, or Evolut R valves (Medtronic, Inc., Minneapolis, MN, USA). A small number of subjects treated with other valves were also excluded from the analysis.
Transfemoral vascular access and closure were performed using a percutaneous approach with a safety wire technique and the Prostar XL (Abbott Vascular, Redwood City, CA, USA) vascular closure device. The procedure duration was calculated as “skin-to-skin”, i.e., time 0 marked the beginning of arterial blood pressure regulation by the accessory support access and the final time was represented by the termination of this accessory support access. Following that, we also used local anesthesia with conscious sedation as a first-line approach. Patients received unfractionated heparin to maintain a minimum active clotting time of > 250 s after the insertion of the femoral sheet. The use of prophylactic antibiotics during the procedure or hospital stay was routinely avoided. Aspirin was recommended before TAVR. Guided by previous ESC guidelines, dual-antiplatelet treatment with 100 mg of aspirin and 75 mg of clopidogrel was started the day before the procedure and followed thereafter for six months, except for patients requiring chronic oral anticoagulation.
Subgroup Analysis
We divided the patients into two groups based on age, ≥ 80 years and < 80 years old. Repeated analysis of variance measures were used to determine any significant differences between the two groups. We focused on patients ≥ 80 years, so we further divided these patients into two groups according to expandable systems (i.e., SEV vs. BEV).
Inflammatory Markers
Baseline characteristics, procedural data, and clinical outcomes were collected. Blood samples were obtained using a 21G sterile syringe without stasis. Laboratory analyses were performed before the procedure, during the patient’s post-procedural hospitalization in the intensive care unit, on a daily basis, and at the physician’s discretion in the cardiology ward. These laboratory tests were retrospectively collected. The neutrophil–lymphocyte ratio (NLR) was calculated using the following formula: NLR = absolute neutrophils count/absolute lymphocytes count.
Criteria Definitions for Events
All the outcome definitions were strictly determined according to the Valve Academic Research Consortium 2 (VARC-2) criteria. All of these standardized endpoint definitions together represent the major adverse cardiovascular events (MACE) in our study. Clinical follow-up included 30-day and six-month visits after hospital discharge. The follow-ups were performed onsite. The main collected clinical events at 30 days include myocardial infarction, bleeding, major vascular complications, stroke, acute kidney injury and arrhythmia.
Statistical Analysis
Data are presented as median ± ranges. When the distribution was normal, a t-test was used. Continuous variables between the various study groups were tested for normality by a Shapiro-Wilk test and when an abnormal distribution was found, a Mann-Whitney test was performed. Pearson’s chi-square test was performed for categorical variables when appropriate. Main effect estimates are presented with their 95% confidence interval.
Statistical analysis was performed using SPSS software (IBM SPSS Statistics for Windows, Version 25.0. Armonk, NY, USA) and R programming version 4.0.2 (The R Foundation for Statistical Computing, Vienna, Austria; http://www.R-project.org) for all analyses. P values less than 0.05 were considered statistically significant.
RESULTS
Patient Characteristics
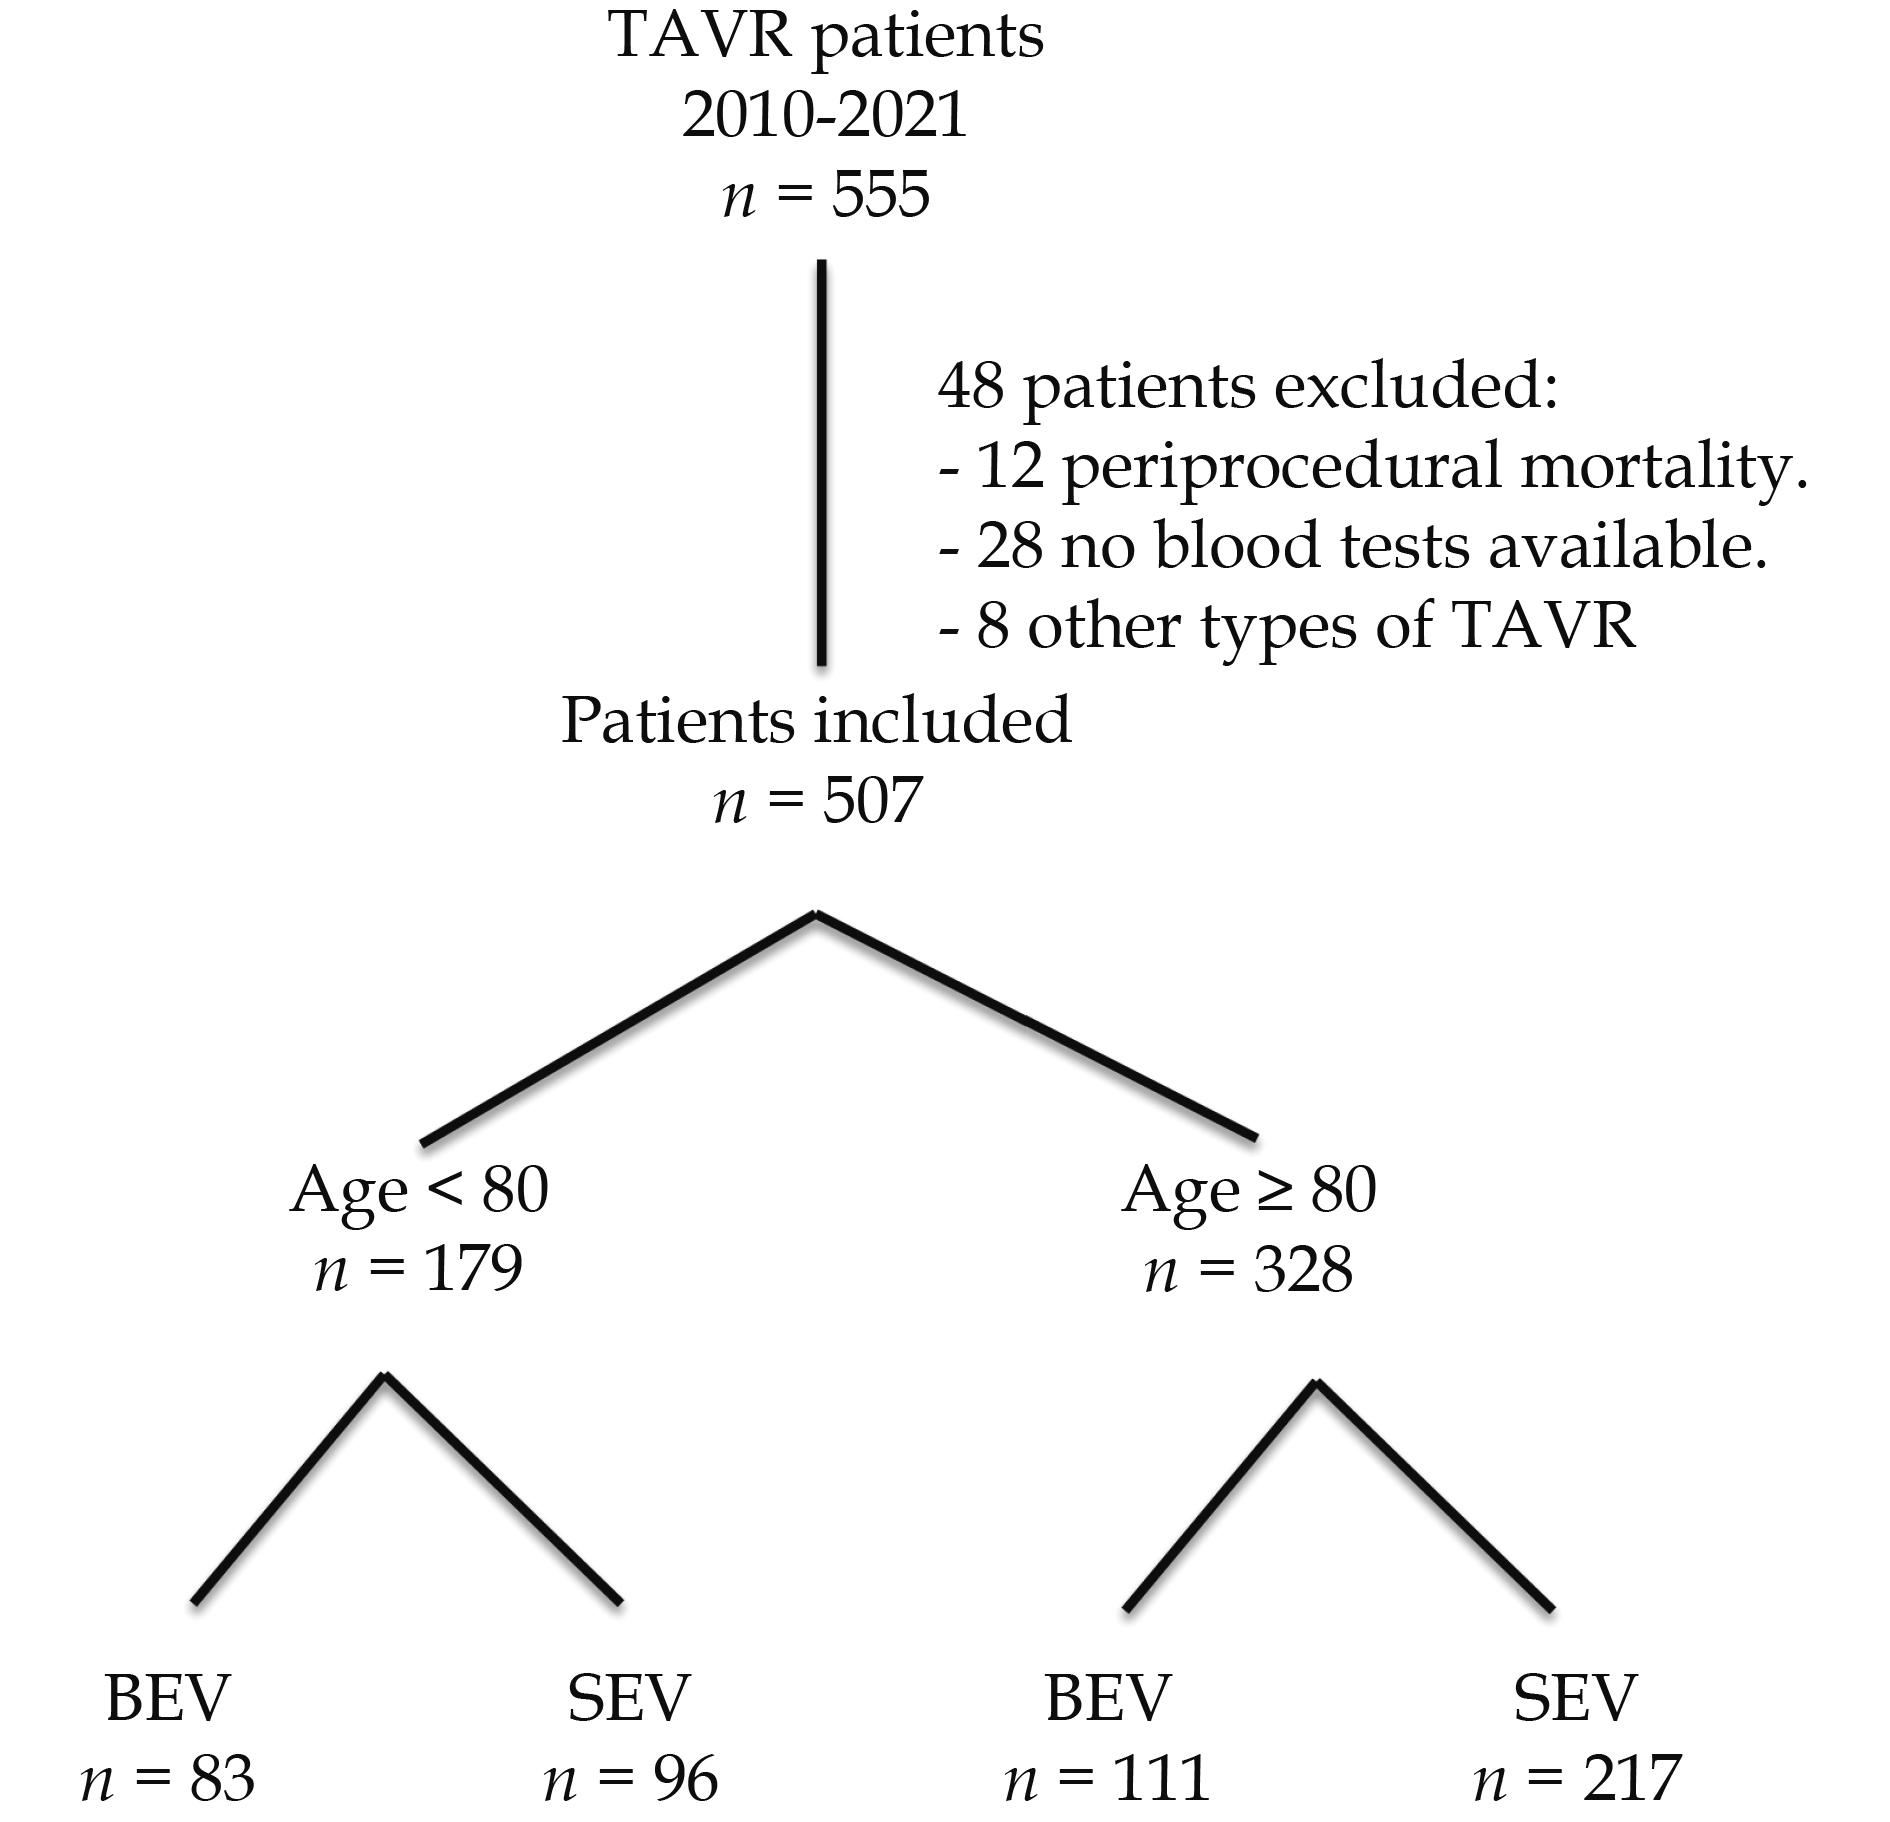
During the eleven-year study period, 555 consecutive patients were enrolled, 48 were excluded for different reasons, mainly partial lack of blood tests. The remaining 507 were included in the study, and 65% of these patients were 80 years old or more (54% female, median age 84 [82-87] years, with severe symptomatic aortic stenosis (transaortic pressure gradient 47.00 (37.50-58.00) mmHg), at the date of inclusion. The study flowchart is shown in Figure 1.
Figure
1.
Study flowchart of patients from 2010 to 2021.
A total of 555 patients were treated with TAVR after excluding 48 patients a total of 507 patients were finally included in the analysis. BEV: balloon expandable valve; SEV: self expandable valve; TAVR: transcatheter aortic valve replacement.
The baseline characteristics of the two groups according to age are listed in Table 1. The < 80 years old group included 179 patients with a median age of 75 (72 – 77) years. The ≥ 80 years group included 328 patients with a median age of 84 (82 – 87). All parameters related to body characteristics showed significant differences between the two groups. In the ≥ 80-year group, the patients were shorter, weighed less, had a lower body mass index, and a smaller body surface area. Smoking was more prevalent for patients aged < 80 years than those aged ≥ 80 years. Older patients had higher blood cholesterol and more diabetes. Other baseline characteristics did not differ between the two groups, including the estimated operative mortalities calculated using the Society of Thoracic Surgeons Predictive Risk of Mortality score (P = 0.517). The degree of AS was more severe in patients aged ≥ 80 years than in those aged < 80 years. Differences were present between the two groups with respect to the mean aortic valve gradient (median: 47 mmHg vs. 40 mmHg, P value = 0.004).
Table
1.
Patient and procedural characteristics.
Clinical characteristic
Overall n = 507
Age < 80 yrs n = 179
Age ≥ 80 yrs n = 328
P value
Age, yrs
82.00 [77.00, 86.00]
75.00 [72.00, 77.00]
84.00 [82.00, 87.00]
< 0.001
Male
237 (46.7%)
86 (48.0%)
151 (46.0%)
0.734
Body mass index, kg/m2
27.64 [24.26, 31.22]
29.16 [25.96, 33.38]
26.99 [24.12, 30.39]
< 0.001
Hypertension
460 (91.1%)
157 (87.7%)
303 (92.9%)
0.07
Diabetes
222 (44.0%)
91 (51.1%)
131 (40.2%)
0.023
Dyslipidemia
396 (78.4%)
152 (84.9%)
244 (74.8%)
0.012
Smoker
59 (11.8%)
33 (18.5%)
26 (8.0%)
0.001
Atrial fibrillation
152 (30.4%)
53 (29.6%)
99 (30.8%)
0.853
Coronary artery disease
225 (44.8%)
80 (44.9%)
145 (44.8%)
1
Peripheral artery disease
84 (16.7%)
36 (20.2%)
48 (14.8%)
0.153
Previous myocardial infarction
67 (13.3%)
26 (14.6%)
41 (12.6%)
0.614
Previous stroke
47 (9.3%)
20 (11.2%)
27 (8.3%)
0.358
Previous pacemaker
69 (13.7%)
26 (14.5%)
43 (13.2%)
0.788
CABG
31 (8.2%)
15 (10.5%)
16 (6.9%)
0.295
STS score
8.12 [5.2, 10.3]
8.1 [4.8, 10.2]
8.3 [5.2, 10.6]
0.517
LVEF
55% [50%, 60%]
55% [50%, 60%]
55% [50%, 60%]
0.876
Septum thickness, mm
13.00 [12.00, 14.00]
13.00 [12.00, 14.00]
13.00 [12.00, 15.00]
0.301
Aortic valve area, cm2
0.70 [0.60, 0.80]
0.70 [0.60, 0.80]
0.70 [0.60, 0.80]
0.135
Aortic valve gradient-mean, mmHg
44.50 [35.25, 54.00]
40.00 [33.00, 51.00]
47.00 [37.50, 58.00]
0.004
Contrast volume, mL
80.00 [65.00, 104.00]
74.50 [61.00, 96.00]
82.00 [67.00, 106.00]
0.016
Time, min
110.00 [84.00, 150.00]
100.00 [75.00, 146.00]
120.00 [90.00, 159.00]
0.001
WBC-pre, K/μL
7.30 [5.90, 8.80]
7.40 [5.89, 8.85]
7.10 [5.90, 8.70]
0.742
Absolute neutrophils-pre, K/μL
4.80 [3.61, 6.00]
4.93 [3.67, 6.06]
4.70 [3.60, 6.00]
0.482
Absolute lymphocytes–pre, K/μL
1.40 [1.10, 1.90]
1.40 [1.10, 1.90]
1.50 [1.10, 2.00]
0.198
NLR
3.00 [2.09, 4.37]
3.22 [2.22, 5.03]
2.82 [2.07, 4.24]
0.194
Values are median [ranges] or n (%). CABG: coronary artery bypass grafting; LVEF: left ventricle ejection fraction; STS: Society of Thoracic Surgeons; NLR: neutrophil to lymphocyte ratio; WBC: white blood cells.
No statistically significant differences were found between the two groups with respect to the mortality rates according to all follow-up periods, as listed in Table 2.
Table
2.
Cumulative all-cause mortality according to age subgroup.
Inflammatory Reactions Following TAVR Procedure for Patients ≥ 80 years
Significant changes in the main immune system cellular components were noticed after the TAVR procedure (Table 3, Figure 2). The total white blood cell counts (WBC) and absolute neutrophil count were elevated at 24 h and 72 h, while the absolute lymphocyte count decreased at 24 h and 72 h after the procedure. The NL ratio increased at 24 h and 72 h as a result of these changes. Interestingly, all these changes returned to the baseline six months after the procedure, and the TAVR procedure did not leave any significant changes in these components.
Table
3.
Dynamic changes of WBC and their subpopulation after TAVR for patients ≥ 80 yrs.
Admission
24-h
72-h
6-month
P1
P2
P3
WBC, K/uL
7.10 [5.90, 8.70]
9.40 [7.67, 11.70]
8.70 [7.10, 10.41]
7.15 [5.90, 8.72]
< 0.0001
< 0.0001
1
Absolute neutrophils, K/uL
4.70 [3.60, 6.00]
7.40 [5.70, 9.72]
6.20 [4.74, 7.90]
4.60 [3.40, 5.81]
< 0.0001
< 0.0001
1
Absolute lymphocytes, K/uL
1.50 [1.10, 2.00]
1.00 [0.70, 1.30]
1.20 [0.88, 1.58]
1.65 [1.15, 2.10]
< 0.0001
< 0.0001
1
NL ratio
2.82 [2.07, 4.24]
7.21 [4.95, 11.73]
5.26 [3.53, 7.85]
2.81 [1.89, 3.93]
< 0.0001
< 0.0001
1
Values are (median [IQR]). P1: comparison of pre-procedural values with those at 24 h; P2: comparison of pre-procedural values with those at 72 h; P3: comparison of pre-procedural values with those at 6 months; NL: neutrophil to lymphocyte; TAVR: transcatheter aortic valve replacement; WBC: white blood cells.
Figure
2.
Dynamic changes of leukocytes and its components after TAVR for patients ≥ 80 years.
(A): Dynamic changes in total WBC with time; (B): dynamic changes in neutrophils with time; (C): dynamic changes of lymphocytes with time; and (D) dynamic changes of NL ratio with time. LYMP.abs: absolute lymphocytes (K/μL); NEUT.abs: absolute neutrophils (K/μL); WBC: White blood cells (K/μL); NL: neutrophils to lymphocytes; ns: not significant; WBC: white blood cells; TAVR: transcatheter aortic valve replacement; ****: significant.
The variables that may be related to an increase in inflammatory markers after TAVR are presented in Table 4. In this variable analysis, the amount of contrast used and the duration of the procedure were related to a higher inflammatory response with a P value < 0.01. Other variables except the valve system, which will be mentioned later, did not affect the WBC and its components.
Table
4.
Variable analysis of factors that may influence inflammatory markers post TAVR for patients ≥ 80 years.
WBC at 24 h
Abs. neutrophils at 24 h
Abs. lymphocytes at 24 h
NL ratio at 24 h
(Median [IQR])
P-value
(Median [IQR])
P-value
(Median [IQR])
P-value
(Median [IQR])
P-value
Gender
Females
9.53 (7.69-11.8)
0.637
7.8 (5.7-9.67)
0.453
1 (0.7-1.4)
0.385
7.12 (4.78-11.33)
0.756
Males
9.2 (7.6-11.5)
7 (5.7-10)
0.99 (0.7-1.3)
7.22 (5.15-12.66)
Age*, yrs
0.018
0.750
−0.050
0.932
0.035
0.525
−0.023
0.680
Body mass index*, kg/m2
0.087
0.174
0.053
0.413
0.127
0.047
−0.070
0.275
HTN
No
9.6 (6.8-15.3)
0.702
7.9 (4.9-12.5)
0.567
0.9 (0.7-1.2)
0.430
8.77 (5.56-15.62)
0.271
Yes
9.4 (7.7-11.6)
7.4 (5.7-9.6)
1 (0.7-1.3)
7.21 (4.9-11.37)
Diabetes
No
9.5 (7.7-12.22)
0.216
7.7 (5.824-10.27)
0.133
0.9 (0.7-1.3)
0.076
8 (5.2-12.83)
0.013
Yes
9.1 (7.5-11.3)
7 (5.5-9.1)
1.1 (0.79-1.4)
6.72 (4.66-9.344)
Dyslipemia
No
9.25 (7.62-13.4)
0.665
7.85 (5.72-10.6)
0.375
0.9 (0.71-1.2)
0.333
8.07 (5.18-12.2)
0.144
Yes
9.4 (7.65-11.55)
7.4 (5.7-9.48)
1 (0.7-1.4)
6.97 (4.87-11.28)
Smoker
No
9.4 (7.69-11.8)
0.802
7.43 (5.7-9.79)
0.757
1 (0.7-1.33)
0.938
7.21 (4.9-11.85)
0.909
Yes
9.61 (7.6-11.4)
7.445 (5.9-9.51)
1.1 (0.6-1.3)
7.77 (5.26-10.83)
A. fibrillation
No
9.5 (7.62-12)
0.375
7.505 (5.7-10.2)
0.209
1 (0.7-1.3)
0.835
7.65 (5-12)
0.293
Yes
9.2 (7.5-11.1)
7 (5.4-9.0415)
1 (0.7-1.4)
6.8 (4.78-11.33)
CAD
No
9.39 (7.5-11.7)
0.743
7.4 (5.7-9.79)
0.916
0.99 (0.7-1.3)
0.544
7.18 (4.9-11.8)
0.993
Yes
9.6 (7.8-11.6)
7.4 (5.8-9.4)
1 (0.7-1.315)
7.45 (4.97-11.46)
PVD
No
9.4 (7.61-11.7)
0.860
7.49 (5.7-9.795)
0.712
1 (0.7-1.33)
0.932
7.17 (4.86-12.14)
0.865
Yes
9.39 (7.8-11.65)
6.995 (5.8-9.5)
1 (0.76-1.2542)
7.66 (5.64-10.05)
S/P MI
No
9.4 (7.6-11.7)
0.836
7.43 (5.7-9.7)
0.741
1 (0.7-1.315)
0.821
7.14 (4.95-11.78)
0.832
Yes
9.53 (7.7-11.4)
7.2 (5.9-9.3)
1 (0.8-1.3)
7.85 (5.02-11.34)
S/P CVA-TIA
No
9.345 (7.6-11.68)
0.280
7.355 (5.7-9.67)
0.270
1 (0.7-1.4)
0.228
7.18 (4.86-11.57)
0.196
Yes
9.9 (8.4-12.1)
7.9 (6.5-11)
1 (0.7-1.2)
7.86 (5.75-12.14)
Pacemaker
No
9.4 (7.7-11.9)
0.355
7.415 (5.8-10)
0.288
1 (0.7-1.355)
0.555
7.19 (4.89-12.07)
0.777
Yes
9.41 (7.4-10.75)
7.12 (5.2-9.1)
0.9 (0.7-1.2)
7.4 (5.37-10.43)
S/P CABG
No
9.3 (7.59-11.5)
0.645
7.1 (5.5-9.51)
0.531
1.03 (0.7-1.33)
0.733
6.72 (4.76-11.16)
0.466
Yes
9.695 (8.4-11.7)
7.315 (6.75-9.85)
0.9198 (0.665-1.29)
8.06 (5.79-10.07)
STS score*
0.234
0.323
0.412
0.52
0.214
0.71
0.165
0.568
Baselines Echo
*LVEF (%)
0.094
0.095
0.077
0.170
0.090
0.110
−0.040
0.485
*AVA, cm2
−0.052
0.377
−0.070
0.239
0.107
0.073
−0.113
0.057
*AV gradient mean, mmHg
0.041
0.640
0.037
0.694
−0.058
0.509
0.056
0.524
*Septum thickness, mm
0.103
0.067
0.091
0.107
−0.029
0.606
0.080
0.161
SEV vs. BEV
SEV
9.79 (7.8-12.1)
0.040
7.74 (5.9-10.2)
0.046
1 (0.7-1.3)
0.417
7.65 (5-12.2)
0.094
BEV
9.1 (7.1-11.1)
7.1 (5.4-9.4)
1 (0.71-1.4)
6.83 (4.78-10.44)
*Contrast volume, mL
0.152
0.006
0.174
0.002
−0.038
0.490
0.109
0.051
*Time, min
0.145
0.009
0.213
< 0.001
−0.209
< 0.001
0.263
< 0.001
Post dilatation
No
9.4 (7.6-11.7)
0.577
7.31 (5.7-9.7)
0.419
1 (0.76-1.4)
0.085
7.06 (4.87-11.35)
0.159
Yes
9.65 (7.66-11.9)
8 (5.995-9.995)
0.9396 (0.6-1.2)
8.03 (5.18-12.57)
Data are presents as median (interquartile range). Continues variables between the various study groups were tested for normality by Shapiro-Wilk test and when abnormal distribution was found Mann-Whitney test was performed, when the distribution was normal t - test was used. *Correlation between two Continues variables was tested by Pearson Correlation. Abs: absolute; AI: aortic insufficiency; AV: aortic valve; AVA: aortic valve area; BEV: balloon expandable valve; CABG: coronary artery bypass grafting; LVEF: left ventricle ejection fraction; NL: neutrophils to lymphocytes; STS: Society of Thoracic Surgeons; SEV: self-expandable valve; TAVR: transcatheter aortic valve replacement; WBC: white blood cells.
Cellular Inflammation Markers and Clinical Outcome for Patients ≥ 80 years
There is a statistically significant correlation between absolute WBC count and absolute neutrophil count, and different clinical outcomes (Table 5). Statistically significant higher WBC and neutrophil counts were seen in mortality levels (median 9.8 vs. 9.2, P = 0.043 and median 7.9 vs. 7.16, P = 0.05 respectively), and patients with major vascular complications at 30 days (10.7 vs. 9.34 P = 0.03 and 9.0 vs 7.26, P = 0.01). In addition, higher neutrophil counts and NL ratios were found to be correlated to arrhythmia at 30 days with P values of 0.04 and 0.028 respectively.
Table
5.
Association of inflammatory markers at 24 h and thirty-day outcomes in patients who underwent TAVR for patients ≥ 80 yrs.
WBC at 24 h
Abs. neutrophils at 24 h
Abs. lymphocytes at 24 h
NLR at 24 h
P-value
P-value
P-value
P-value
Mortality
NO
9.3 (7.5-11.4)
0.043
7.2 (5.5-9.4)
0.028
1 (0.7-1.3)
0.246
6.83 (4.87-10.78)
0.030
YES
9.8 (8.01-13.4)
7.9 (6.2-11.2)
0.9 (0.7-1.3)
8.37 (5.31-13.56)
MI
NO
9.4 (7.69-11.68)
0.516
7.4 (5.7-9.67)
0.482
1 (0.7-1.315)
0.952
7.21 (4.95-11.53)
0.845
YES
13.9 (6.11-15.1)
11.8 (4.39-14.6)
1.1 (0.3-1.7)
6.94 (3.99-48.66)
Bleeding
NO
9.395 (7.6-11.6)
0.222
7.355 (5.7-9.6)
0.076
1 (0.7-1.3)
0.574
7.16 (4.94-11.48)
0.322
YES
10.1 (8.4-12.22)
8.1 (6.6-10.4)
0.91 (0.55-1.49)
8.11 (5.08-14.25)
Major vascular complication
NO
9.345 (7.6-11.5)
0.031
7.2595 (5.7-9.5)
0.011
1 (0.7-1.38)
0.611
7 (4.9-11.28)
0.075
YES
10.7 (9.1-13.65)
9 (7-12.04)
0.92 (0.6-1.3)
10.4 (5.93-14)
Stroke
NO
9.4 (7.61-11.55)
0.109
7.4 (5.7-9.58)
0.257
1 (0.7-1.3)
0.141
7.22 (4.94-11.57)
0.577
YES
11.1 (8.01-17.69)
9 (5.3-16.3)
1.1322 (0.86-2.3)
6.06 (5.05-10.09)
AKI
NO
9.4 (7.655-11.6)
0.124
7.4 (5.7-9.58)
0.158
1 (0.7-1.3)
0.298
7.21 (5-11.77)
0.831
YES
11.2 (7.7-15.1)
8.5 (5.5-12.30768)
1.1 (0.7-1.9)
6.55 (4.43-11.57)
Arrhythmia
NO
9.225 (7.6-11.4)
0.095
7.2 (5.7-9.4)
0.040
1.03 (0.71-1.4)
0.141
6.84 (4.75-11)
0.028
YES
9.8 (8.2-13.2)
8 (6.2-11.2)
0.9 (0.7-1.3)
8.39 (5.57-12.94)
Data are presents as median (interquartile range). Continues variables between the various study groups were tested for normality by Shapiro- Wilk test and when abnormal distribution was found Mann- Whitney test was performed, when the distribution was normal t-test was used. Abs: absolute; AKI: acute kidney injury; MI: myocardial infarction; NLR: neutrophil to lymphocyte ratio; TAVR: transcatheter aortic valve replacement; WBC: white blood cells.
Differences Between SEV and BEV in Patients ≥ 80 years
As shown in Figure 3, the SEV types were associated with more inflammation and increases in WBC and its components compared to BEV valve types (P = 0.04). Conversely, there was no increase in mortality during the follow up (Figure 4, P = 0.834).
Figure
3.
Difference in two subgroups SEV vs. BEV in patients ≥ 80 years for leukocytes and its components after TAVR.
(A): Difference in total WBC with time; (B): difference in neutrophils with time; (C): difference in lymphocytes with time; and (D) difference in NL ratio with time. LYMP.abs: absolute lymphocytes (K/μL); BEV: balloon-expandable valves; NEUT.abs: absolute neutrophils (K/μL); NL: neutrophils to lymphocytes; SEV: self-expandable valves; WBC: white blood cells (K/μL).
Figure
4.
Kaplan Meir curve based on all cause mortality for patients ≥ 80 years, showing no difference in survival between the two TAVR expandable systems.
TAVR is a revolutionary procedure marking an era in the field of nonsurgical valve replacement. Geriatric patients were the primary beneficiaries of this procedure, since for the majority of elderly patients this is the only reasonable option they have in cases of severe aortic stenosis, fulfilling the criteria for aortic valve replacement.
However, there is a relative paucity of studies in this important group of geriatric patients as compared to the younger counterparts, with regard to the mechanisms underlying the response to injury induced by percutaneous valvular interventions.
We have previously examined the kinetic behavior of thrombo-inflammatory markers after TAVR in the general population,[8,13-15] but till now there was no single study that examined this behavior in this specific geriatric age group as compared to the younger population.
Physiological and immune mediated responses to injuries are different in the aging adult.[16] An important finding of our study is the lack of significant clinical differences in the outcome of patients under and over the age of 80 years following TAVR, which is similar to some previous studies.[17-19]
Systemic inflammatory response syndrome (SIRS) has been described in many cardiovascular scenarios such as heart failure, operations requiring cardiopulmonary bypass, acute MI and interventional procedures, including TAVR.[8,13,20-22] Neutrophil activation leads to acute injury by numerous mechanisms, resulting in further tissue damage. These include the release of arachidonic acid metabolites, cytotoxic oxygen–derived free radicals and platelet-aggravating factors,[23] myeloperoxidase,[24] various hydrolytic enzymes such as acid phosphatases,[25] etc. The relative lymphopenia observed post-TAVR can be explained by the endogenous cortisol segregation stress response to the procedure.[26]
Obvious changes were found in the duration of the procedure and the amount of contrast material administered. Although both are statistically significant, the absolute median duration grew by only 8 min and the amount of contrast material by only 10 mL, reflecting only small differences between the younger and older group. If to judge by this data, the complexity of performing TAVR in older people is not significantly increased as compared to a younger population, as long as appropriate measures are taken to plan the access route and the implantation itself.
This study also delineates the cellular inflammatory response, both in the short term and six months after TAVR. As expected, there is a significant increase in the white blood cell count and the absolute neutrophil count shortly after the procedure, with a decrease in the absolute lymphocyte count. Therefore, the NL ratio increases significantly after the procedure.
Another finding of our study is the relation between different changes in the cellular immunity and important clinical outcomes. A higher WBC and neutrophil surges at 24 h are related to higher mortality at 30 days, increased major vascular complications at 30 days and higher rates of arrhythmia at 30 days which increase the need of pacemaker implantation. Special attention should be paid to patients with greater cellular immune reactions due to this reason. Additional studies should be done to confirm our finding.
Herein, we observed long-term survival rates in older and younger patients after a TAVR procedure. Due to the advanced age of the patient population that we decide to focus on i.e., over 80 years of age, life expectancy and expected long-term survival after a TAVR procedure are important considerations. Some studies compared octogenarian and nonagenarian patients and a lower 1-year mortality rate was observed in younger patients comparing with the older one.[17] In our study, a Kaplan-Meier analysis failed to identify significant long-term survival differences between patients ≥ 80 or < 80 years of age (log-rank P = 0.573). Bleeding, major vascular complications, acute kidney injury, pacemaker implantation, arrhythmia, readmission, all within 30 days of TAVR, were not found to be significantly higher in patients above 80, despite the large median age difference between both groups (75 years vs. 84 years). Despite differences in pre-operative echocardiographic and demographic characteristics in the two study groups, both groups have similar outcomes in terms of cumulative all-cause mortality (Table 2).
As we mentioned earlier, we look for a new, simple, non-expensive predictor for clinical outcome in the elderly people, and an increase in inflammatory markers were significantly correlated with clinical outcome specially in these subgroup of elderly populations. Despite the statistically significant differences between the two types of valves i.e., SEV vs. BEV at 24 h post-procedure, this is not reflected in the survival rate.
We have demonstrated that a simple, routine WBC count and its differential behavior are potentially valuable add on screening tools for risk stratification of patients who undergo TAVR. In elderly people, there is an association between unfavorable 30 day outcomes of vascular access complication, arrhythmia and death according to the VARC-2 definition, which suggests that the more complex procedures provoke major inflammatory responses. The addition of NLR to the TAVR risk score may improve the outcome prediction after TAVR.
In conclusion, to the best of our knowledge, this is the first report that studies the effect of increase in inflammatory markers after TAVR procedure in geriatric as compared to the younger age group, and the association of this pattern of inflammatory response with clinical outcome.
Limitations
This study is a single center study, reflecting the local clinical attitudes toward severe aortic stenosis and the local expertise. Multicenter studies are needed to support the findings of this study in different health systems and other populations. Another limitation is the inclusion of patients enrolled for more than 10 years. The technique of valve implantation, the valvular implants, and experience have improved over time, and the study reflects the overall period and not only the most recent developments in the field. Including only recent patients should lead to better clinical results than the average shown in our study, but it probably will not change the fundamentals of the study and the immunologic reaction. This limitation is also an advantage, since the longer period allows us to include more patients and describe smaller changes in a statistically significant manner as well as to study a more extended follow up.
Conclusion
TAVR in patients ≥ 80 years old has similar clinical results compared to younger patients in a short and long term follow-up. The procedure causes significant changes in the cellular immunologic components in the short-term but not in the longer term. When focusing on octogenarians, the immune reaction is more robust in patients with adverse events including mortality, vascular complications and pacemaker implantation. Attention to this subgroup of patients may contribute to earlier diagnosis and better treatment. These observations should be further pursued in large studies as it may have a possible detrimental effect on the long-term durability of these biological valves.
DISCOLSURE
Institutional Review Board Statement
The study was conducted according to the guidelines of the Declaration of Helsinki, and approved by the Institutional Ethics Committee, Kaplan Medical Center (confirmation 0091-20-KMC).
Reardon MJ, Van Mieghem NM, Popma JJ, et al. Surgical or transcatheter aortic-valve replacement in intermediate-risk patients. N Engl J Med 2017: 1321-1331.
[2]
Leon MB, Smith CR, Mack MJ, et al. Transcatheter or surgical aortic-valve replacement in intermediate-risk patients. N Engl J Med 2016; 374: 1609−1620. doi: 10.1056/NEJMoa1514616
[3]
Yamamoto M, Meguro K, Mouillet G, et al. Comparison of effectiveness and safety of transcatheter aortic valve implantation in patients aged ≥ 90 years versus < 90 years. Am J Cardiol 2012; 110: 1156−1163. doi: 10.1016/j.amjcard.2012.05.058
[4]
Braghiroli J, Kapoor K, Thielhelm TP, et al. Transcatheter aortic valve replacement in low risk patients: a review of PARTNER 3 and Evolut low risk trials. Cardiovasc Diagn Ther 2020; 10: 59. doi: 10.21037/cdt.2019.09.12
[5]
Schwietz T, Behjati S, Gafoor S, et al. Occurrence and prognostic impact of systemic inflammatory response syndrome in transfemoral and transapical aortic valve implantation with balloon-and self-expandable valves. EuroIntervention 2015; 10: 1468−1473. doi: 10.4244/EIJY14M06_05
[6]
Neuser J, Galuppo P, Fraccarollo D, et al. Intermediate CD14++ CD16+ monocytes decline after transcatheter aortic valve replacement and correlate with functional capacity and left ventricular systolic function. PloS One 2017; 12: e0183670. doi: 10.1371/journal.pone.0183670
[7]
Sinning JM, Adenauer V, Scheer AC, et al. Systemic Inflammatory Response Syndrome Predicts Increased Mortality in Patients After Transcatheter Aortic Valve Implantation. Eur Heart J 2012; 33: 1459−1468. doi: 10.1093/eurheartj/ehs002
[8]
Abu Khadija H, Gandelman G, Ayyad O, et al. Differential systemic inflammatory responses after TAVI: The role of self versus balloon expandable devices. PloS One 2021; 16: e0258963. doi: 10.1371/journal.pone.0258963
[9]
Tamhane UU, Aneja S, Montgomery D, et al. Association between admission neutrophil to lymphocyte ratio and outcomes in patients with acute coronary syndrome. Am J Cardiol 2008; 102: 653−657. doi: 10.1016/j.amjcard.2008.05.006
[10]
Alves P, Ferreira B. The role of inflammation, humoral and cell mediated autoimmunity in the pathogenesis of atherosclerosis. Swiss Med Wkly 2008; 138: 534−539.
[11]
Çakıcı M, Çetin M, Doğan A, et al. Neutrophil to lymphocyte ratio predicts poor functional capacity in patients with heart failure. Turk Kardiyol Dern Ars 2014; 42: 612−620. doi: 10.5543/tkda.2014.16363
[12]
Balta S, Demirkol S, Celik T, et al. Association between coronary artery ectasia and neutrophil–lymphocyte ratio. Angiology 2013; 64: 627−632. doi: 10.1177/0003319713480424
[13]
Abu Khadija H, Gandelman G, Ayyad O, et al. Comparative analysis of the kinetic behavior of systemic inflammatory markers in patients with depressed versus preserved left ventricular function undergoing transcatheter aortic valve implantation. J Clin Med 2021; 10: 4148. doi: 10.3390/jcm10184148
[14]
Abu Khadija H, Ayyad O, Haberman D, et al. Contemporary transcatheter aortic valve implantation related thrombocytopenia. Catheter Cardiovasc Interv 2021; 98: E139−E144. doi: 10.1002/ccd.29679
[15]
Abu Khadija H, Gandelman G, Ayyad O, et al. Trends in transfemoral aortic valve implantation related thrombocytopenia. J Clin Med 2022; 11: 726. doi: 10.3390/jcm11030726
[16]
Attinger-Toller A, Ferrari E, Tueller D, et al. Age-related outcomes after transcatheter aortic valve replacement: insights from the SwissTAVI registry. JACC Cardiovasc Interv 2021; 14: 952−960. doi: 10.1016/j.jcin.2021.01.042
[17]
van der Kley F, van Rosendael PJ, Katsanos S, et al. Impact of age on transcatheter aortic valve implantation outcomes: a comparison of patients aged ≤ 80 years versus patients > 80 years. J Geriatr Cardiol 2016; 13: 31.
[18]
Pascual I, Hernández-Vaquero D, Alperi A, et al. Survival in elderly patients with transcatheter aortic valve implants compared with the general population. Revista Españ ola de Cardiología (English Edition) 2020; 73: 822−827.
[19]
Barbanti M, Webb JG, Gilard M, et al. Transcatheter aortic valve implantation in 2017: state of the art. EuroIntervention 2017; 13: AA11−AA21. doi: 10.4244/EIJ-D-17-00567
[20]
Hoffmann J, Mas‐Peiro S, Berkowitsch A, et al. Inflammatory signatures are associated with increased mortality after transfemoral transcatheter aortic valve implantation. ESC Heart Fail 2020; 7: 2597−2610. doi: 10.1002/ehf2.12837
[21]
Hoffmann J, Mas-Peiro S, Boeckling F, et al. Inflammatory phenotypes of circulating leukocyte subsets are associated with increased mortality after transfemoral transcatheter aortic valve implantation. Circulation 2019; 140: A15461−A15461.
[22]
Urena M, Webb JG, Tamburino C, et al. Permanent pacemaker implantation after transcatheter aortic valve implantation: impact on late clinical outcomes and left ventricular function. Circulation 2014; 129: 1233−1243. doi: 10.1161/CIRCULATIONAHA.113.005479
[23]
Hansen PR. Role of neutrophils in myocardial ischemia and reperfusion. Circulation 1995; 91: 1872−1885. doi: 10.1161/01.CIR.91.6.1872
[24]
Baldus S, Heeschen C, Meinertz T, et al. Myeloperoxidase serum levels predict risk in patients with acute coronary syndromes. Circulation 2003; 108: 1440−1445. doi: 10.1161/01.CIR.0000090690.67322.51
[25]
Chavan V, Patil N. Study of leukocytic hydrolytic enzymes in patients with acute stage of coronary heart disease. Indian J Med Sci 2007; 61: 73−82. doi: 10.4103/0019-5359.30347
[26]
Ommen SR, Gibbons RJ, Hodge DO, Thomson SP. Usefulness of the lymphocyte concentration as a prognostic marker in coronary artery disease. Am J Cardiol 1997; 79: 812−814. doi: 10.1016/S0002-9149(96)00878-8
Values are median [ranges] or n (%). CABG: coronary artery bypass grafting; LVEF: left ventricle ejection fraction; STS: Society of Thoracic Surgeons; NLR: neutrophil to lymphocyte ratio; WBC: white blood cells.
Table
3.
Dynamic changes of WBC and their subpopulation after TAVR for patients ≥ 80 yrs.
Admission
24-h
72-h
6-month
P1
P2
P3
WBC, K/uL
7.10 [5.90, 8.70]
9.40 [7.67, 11.70]
8.70 [7.10, 10.41]
7.15 [5.90, 8.72]
< 0.0001
< 0.0001
1
Absolute neutrophils, K/uL
4.70 [3.60, 6.00]
7.40 [5.70, 9.72]
6.20 [4.74, 7.90]
4.60 [3.40, 5.81]
< 0.0001
< 0.0001
1
Absolute lymphocytes, K/uL
1.50 [1.10, 2.00]
1.00 [0.70, 1.30]
1.20 [0.88, 1.58]
1.65 [1.15, 2.10]
< 0.0001
< 0.0001
1
NL ratio
2.82 [2.07, 4.24]
7.21 [4.95, 11.73]
5.26 [3.53, 7.85]
2.81 [1.89, 3.93]
< 0.0001
< 0.0001
1
Values are (median [IQR]). P1: comparison of pre-procedural values with those at 24 h; P2: comparison of pre-procedural values with those at 72 h; P3: comparison of pre-procedural values with those at 6 months; NL: neutrophil to lymphocyte; TAVR: transcatheter aortic valve replacement; WBC: white blood cells.
Table
4.
Variable analysis of factors that may influence inflammatory markers post TAVR for patients ≥ 80 years.
WBC at 24 h
Abs. neutrophils at 24 h
Abs. lymphocytes at 24 h
NL ratio at 24 h
(Median [IQR])
P-value
(Median [IQR])
P-value
(Median [IQR])
P-value
(Median [IQR])
P-value
Gender
Females
9.53 (7.69-11.8)
0.637
7.8 (5.7-9.67)
0.453
1 (0.7-1.4)
0.385
7.12 (4.78-11.33)
0.756
Males
9.2 (7.6-11.5)
7 (5.7-10)
0.99 (0.7-1.3)
7.22 (5.15-12.66)
Age*, yrs
0.018
0.750
−0.050
0.932
0.035
0.525
−0.023
0.680
Body mass index*, kg/m2
0.087
0.174
0.053
0.413
0.127
0.047
−0.070
0.275
HTN
No
9.6 (6.8-15.3)
0.702
7.9 (4.9-12.5)
0.567
0.9 (0.7-1.2)
0.430
8.77 (5.56-15.62)
0.271
Yes
9.4 (7.7-11.6)
7.4 (5.7-9.6)
1 (0.7-1.3)
7.21 (4.9-11.37)
Diabetes
No
9.5 (7.7-12.22)
0.216
7.7 (5.824-10.27)
0.133
0.9 (0.7-1.3)
0.076
8 (5.2-12.83)
0.013
Yes
9.1 (7.5-11.3)
7 (5.5-9.1)
1.1 (0.79-1.4)
6.72 (4.66-9.344)
Dyslipemia
No
9.25 (7.62-13.4)
0.665
7.85 (5.72-10.6)
0.375
0.9 (0.71-1.2)
0.333
8.07 (5.18-12.2)
0.144
Yes
9.4 (7.65-11.55)
7.4 (5.7-9.48)
1 (0.7-1.4)
6.97 (4.87-11.28)
Smoker
No
9.4 (7.69-11.8)
0.802
7.43 (5.7-9.79)
0.757
1 (0.7-1.33)
0.938
7.21 (4.9-11.85)
0.909
Yes
9.61 (7.6-11.4)
7.445 (5.9-9.51)
1.1 (0.6-1.3)
7.77 (5.26-10.83)
A. fibrillation
No
9.5 (7.62-12)
0.375
7.505 (5.7-10.2)
0.209
1 (0.7-1.3)
0.835
7.65 (5-12)
0.293
Yes
9.2 (7.5-11.1)
7 (5.4-9.0415)
1 (0.7-1.4)
6.8 (4.78-11.33)
CAD
No
9.39 (7.5-11.7)
0.743
7.4 (5.7-9.79)
0.916
0.99 (0.7-1.3)
0.544
7.18 (4.9-11.8)
0.993
Yes
9.6 (7.8-11.6)
7.4 (5.8-9.4)
1 (0.7-1.315)
7.45 (4.97-11.46)
PVD
No
9.4 (7.61-11.7)
0.860
7.49 (5.7-9.795)
0.712
1 (0.7-1.33)
0.932
7.17 (4.86-12.14)
0.865
Yes
9.39 (7.8-11.65)
6.995 (5.8-9.5)
1 (0.76-1.2542)
7.66 (5.64-10.05)
S/P MI
No
9.4 (7.6-11.7)
0.836
7.43 (5.7-9.7)
0.741
1 (0.7-1.315)
0.821
7.14 (4.95-11.78)
0.832
Yes
9.53 (7.7-11.4)
7.2 (5.9-9.3)
1 (0.8-1.3)
7.85 (5.02-11.34)
S/P CVA-TIA
No
9.345 (7.6-11.68)
0.280
7.355 (5.7-9.67)
0.270
1 (0.7-1.4)
0.228
7.18 (4.86-11.57)
0.196
Yes
9.9 (8.4-12.1)
7.9 (6.5-11)
1 (0.7-1.2)
7.86 (5.75-12.14)
Pacemaker
No
9.4 (7.7-11.9)
0.355
7.415 (5.8-10)
0.288
1 (0.7-1.355)
0.555
7.19 (4.89-12.07)
0.777
Yes
9.41 (7.4-10.75)
7.12 (5.2-9.1)
0.9 (0.7-1.2)
7.4 (5.37-10.43)
S/P CABG
No
9.3 (7.59-11.5)
0.645
7.1 (5.5-9.51)
0.531
1.03 (0.7-1.33)
0.733
6.72 (4.76-11.16)
0.466
Yes
9.695 (8.4-11.7)
7.315 (6.75-9.85)
0.9198 (0.665-1.29)
8.06 (5.79-10.07)
STS score*
0.234
0.323
0.412
0.52
0.214
0.71
0.165
0.568
Baselines Echo
*LVEF (%)
0.094
0.095
0.077
0.170
0.090
0.110
−0.040
0.485
*AVA, cm2
−0.052
0.377
−0.070
0.239
0.107
0.073
−0.113
0.057
*AV gradient mean, mmHg
0.041
0.640
0.037
0.694
−0.058
0.509
0.056
0.524
*Septum thickness, mm
0.103
0.067
0.091
0.107
−0.029
0.606
0.080
0.161
SEV vs. BEV
SEV
9.79 (7.8-12.1)
0.040
7.74 (5.9-10.2)
0.046
1 (0.7-1.3)
0.417
7.65 (5-12.2)
0.094
BEV
9.1 (7.1-11.1)
7.1 (5.4-9.4)
1 (0.71-1.4)
6.83 (4.78-10.44)
*Contrast volume, mL
0.152
0.006
0.174
0.002
−0.038
0.490
0.109
0.051
*Time, min
0.145
0.009
0.213
< 0.001
−0.209
< 0.001
0.263
< 0.001
Post dilatation
No
9.4 (7.6-11.7)
0.577
7.31 (5.7-9.7)
0.419
1 (0.76-1.4)
0.085
7.06 (4.87-11.35)
0.159
Yes
9.65 (7.66-11.9)
8 (5.995-9.995)
0.9396 (0.6-1.2)
8.03 (5.18-12.57)
Data are presents as median (interquartile range). Continues variables between the various study groups were tested for normality by Shapiro-Wilk test and when abnormal distribution was found Mann-Whitney test was performed, when the distribution was normal t - test was used. *Correlation between two Continues variables was tested by Pearson Correlation. Abs: absolute; AI: aortic insufficiency; AV: aortic valve; AVA: aortic valve area; BEV: balloon expandable valve; CABG: coronary artery bypass grafting; LVEF: left ventricle ejection fraction; NL: neutrophils to lymphocytes; STS: Society of Thoracic Surgeons; SEV: self-expandable valve; TAVR: transcatheter aortic valve replacement; WBC: white blood cells.
Table
5.
Association of inflammatory markers at 24 h and thirty-day outcomes in patients who underwent TAVR for patients ≥ 80 yrs.
WBC at 24 h
Abs. neutrophils at 24 h
Abs. lymphocytes at 24 h
NLR at 24 h
P-value
P-value
P-value
P-value
Mortality
NO
9.3 (7.5-11.4)
0.043
7.2 (5.5-9.4)
0.028
1 (0.7-1.3)
0.246
6.83 (4.87-10.78)
0.030
YES
9.8 (8.01-13.4)
7.9 (6.2-11.2)
0.9 (0.7-1.3)
8.37 (5.31-13.56)
MI
NO
9.4 (7.69-11.68)
0.516
7.4 (5.7-9.67)
0.482
1 (0.7-1.315)
0.952
7.21 (4.95-11.53)
0.845
YES
13.9 (6.11-15.1)
11.8 (4.39-14.6)
1.1 (0.3-1.7)
6.94 (3.99-48.66)
Bleeding
NO
9.395 (7.6-11.6)
0.222
7.355 (5.7-9.6)
0.076
1 (0.7-1.3)
0.574
7.16 (4.94-11.48)
0.322
YES
10.1 (8.4-12.22)
8.1 (6.6-10.4)
0.91 (0.55-1.49)
8.11 (5.08-14.25)
Major vascular complication
NO
9.345 (7.6-11.5)
0.031
7.2595 (5.7-9.5)
0.011
1 (0.7-1.38)
0.611
7 (4.9-11.28)
0.075
YES
10.7 (9.1-13.65)
9 (7-12.04)
0.92 (0.6-1.3)
10.4 (5.93-14)
Stroke
NO
9.4 (7.61-11.55)
0.109
7.4 (5.7-9.58)
0.257
1 (0.7-1.3)
0.141
7.22 (4.94-11.57)
0.577
YES
11.1 (8.01-17.69)
9 (5.3-16.3)
1.1322 (0.86-2.3)
6.06 (5.05-10.09)
AKI
NO
9.4 (7.655-11.6)
0.124
7.4 (5.7-9.58)
0.158
1 (0.7-1.3)
0.298
7.21 (5-11.77)
0.831
YES
11.2 (7.7-15.1)
8.5 (5.5-12.30768)
1.1 (0.7-1.9)
6.55 (4.43-11.57)
Arrhythmia
NO
9.225 (7.6-11.4)
0.095
7.2 (5.7-9.4)
0.040
1.03 (0.71-1.4)
0.141
6.84 (4.75-11)
0.028
YES
9.8 (8.2-13.2)
8 (6.2-11.2)
0.9 (0.7-1.3)
8.39 (5.57-12.94)
Data are presents as median (interquartile range). Continues variables between the various study groups were tested for normality by Shapiro- Wilk test and when abnormal distribution was found Mann- Whitney test was performed, when the distribution was normal t-test was used. Abs: absolute; AKI: acute kidney injury; MI: myocardial infarction; NLR: neutrophil to lymphocyte ratio; TAVR: transcatheter aortic valve replacement; WBC: white blood cells.


 DownLoad:


