Please cite this article as: Abu-Alrub S, Strik M, Huntjens P, Haïssaguerre M, Eschalier R, Bordachar P, Ploux S. The role of electrocardiographic imaging in patient selection for cardiac resynchronization therapy. J Geriatr Cardiol 2021; 18(10): 836−843. DOI: 10.11909/j.issn.1671-5411.2021.10.006.
Citation:
Please cite this article as: Abu-Alrub S, Strik M, Huntjens P, Haïssaguerre M, Eschalier R, Bordachar P, Ploux S. The role of electrocardiographic imaging in patient selection for cardiac resynchronization therapy. J Geriatr Cardiol 2021; 18(10): 836−843. DOI: 10.11909/j.issn.1671-5411.2021.10.006.
Please cite this article as: Abu-Alrub S, Strik M, Huntjens P, Haïssaguerre M, Eschalier R, Bordachar P, Ploux S. The role of electrocardiographic imaging in patient selection for cardiac resynchronization therapy. J Geriatr Cardiol 2021; 18(10): 836−843. DOI: 10.11909/j.issn.1671-5411.2021.10.006.
Citation:
Please cite this article as: Abu-Alrub S, Strik M, Huntjens P, Haïssaguerre M, Eschalier R, Bordachar P, Ploux S. The role of electrocardiographic imaging in patient selection for cardiac resynchronization therapy. J Geriatr Cardiol 2021; 18(10): 836−843. DOI: 10.11909/j.issn.1671-5411.2021.10.006.
Cardiac resynchronization therapy (CRT) has been shown to improve symptoms, left ventricle (LV) performance and long-term survival in patients with heart failure with reduced ejection fraction (HFrEF) and delayed ventricular activation.[1] CRT is currently recommended in symptomatic patients with LV ejection fraction of ≤ 35%, and ventricular conduction disorder manifested as left bundle branch block (LBBB) > 149 ms, and should be considered in LBBB > 129 ms or non-LBBB QRS duration > 150 ms.[2] Unfortunately, the non-response rate of approximately 30% remains nearly unchanged since its introduction two decades ago. Improving patient selection for CRT has become a major priority but no diagnostic marker has proven its superiority over QRS duration and/or pattern based on the 12-lead electrocardiogram (ECG). Most efforts relate to better identification of ventricular asynchrony mostly able to respond to CRT. First of all, it has been observed that patients with LBBB benefit the most from CRT and while the definition of LBBB remains heterogeneous between studies.[3,4] More importantly, significant variation in the probability of classifying LBBB is present in using different definitions and clinical judgement. Considerable intra- and inter-observer variability adds to this variation. Interdefinition agreement varies significantly and correlation of clinical judgement with LBBB classification by definitions is modest at best.[5] Therefore, identifying the electrical substrate responsive to CRT in patient with nonspecific intraventricular conduction delay (NIVCD) also remains very challenging. With varying degrees of LV electrical activation delay, these patients exhibit more complex and heterogeneous activation predominantly caused by an underlying myocardial disease.[6] Electrocardiographic imaging (ECGI) allows for a detailed mapping of the ventricular activation and automated parameters exclude intra- and inter-observer variability.[7,8] Therefore, ECGI seems promising to identify profile of ventricular dyssynchrony favorable for CRT response.
In this present review, we will first describe the technical aspects of ECGI and then discuss its potential use to select candidates for CRT.
ECGI: TECHNICAL ASPECTS
Acquisition Method
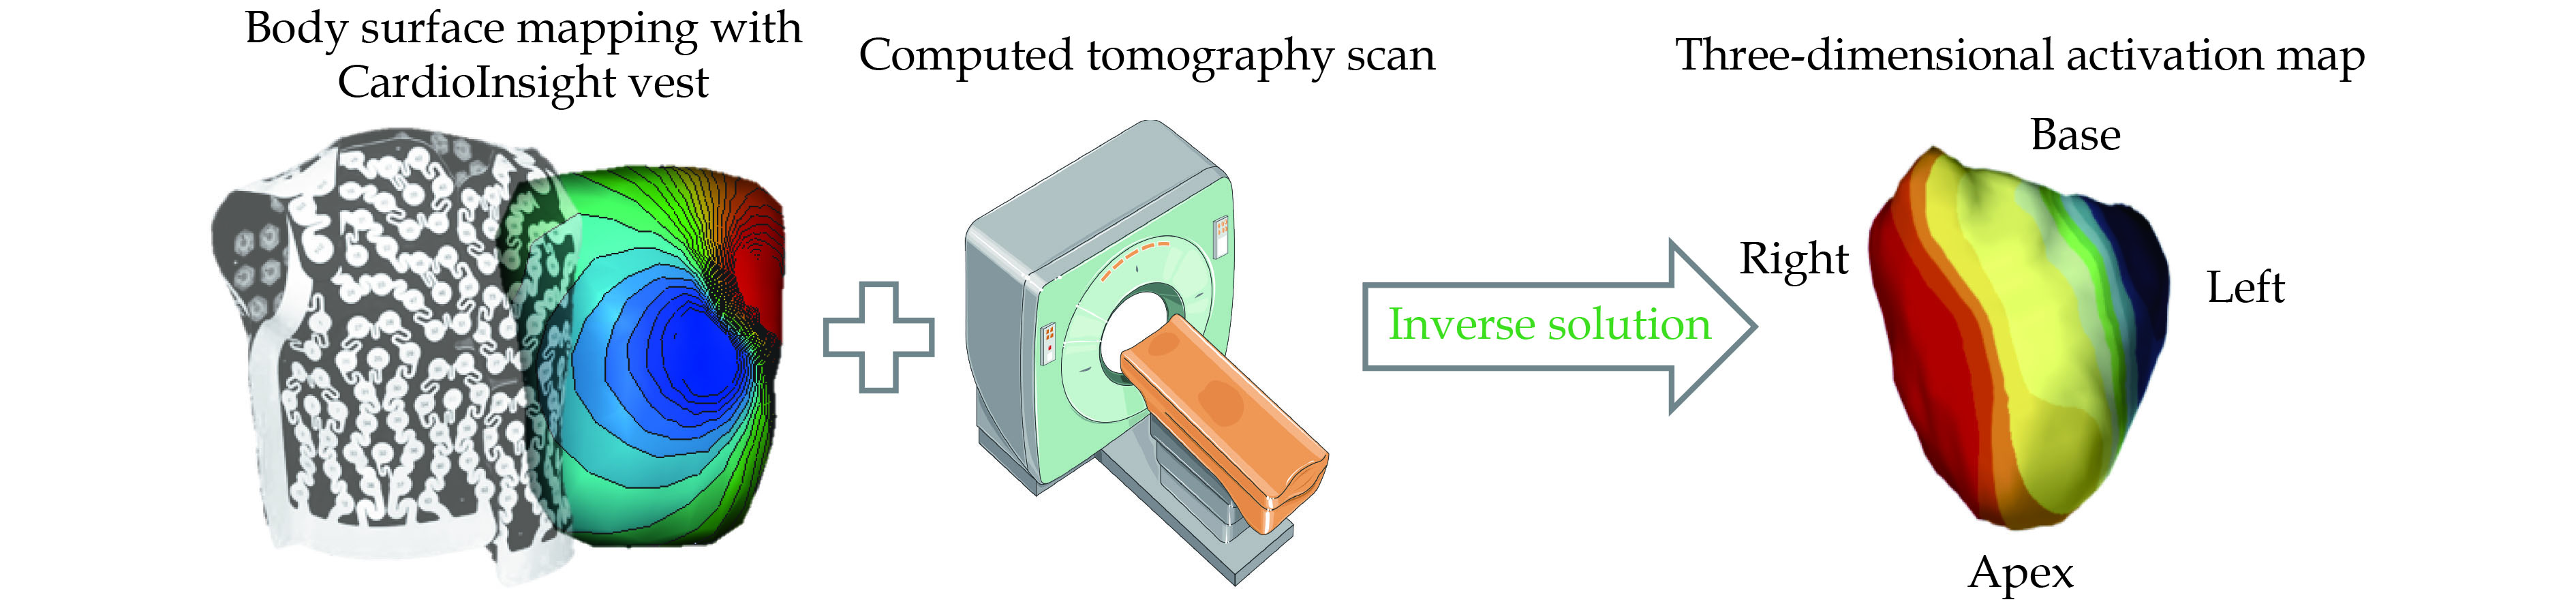
ECGI pioneered by Dr. Yoram Rudy’s laboratory, provides noninvasive high-resolution electrical mapping of cardiac excitation on the epicardial surface. Using a single-use vest holding over 250 electrodes, ECGI registers potentials of the body surface and calculates the activation of the heart by solving the inverse problem.[9] The inverse solution is subject to large noise-related errors since a small level of noise become exponentially amplified. Regularized solutions to the inverse problem have been developed (Thikhonov regularization and the generalized minimal residual iterative technique). Each of the vest electrodes contains a marker that is visible on computed tomography (CT) scan since the software requires knowledge of the geometries of the heart and torso surfaces. The patient undergoes thoracic non-contrast gated CT scanning providing the epicardial geometry and torso electrode positions in the same frame of reference (Figure 1). The body surface potentials and CT images are then combined and processed to reconstruct > 2,500 epicardial unipolar electrograms from which isochrones can be constructed continuously on a beat-by-beat basis. Local ventricular activation times are then calculated as the duration between the onset of the QRS complex or the pacing artifact and the maximal negative slope of each unipolar electrogram. The activation times are then plotted on the ventricular surface to create a three-dimensional activation map.
Figure
1.
Acquisition method of electrocardiographic imaging.
Body surface mapping is obtained through 250 electrodes mounted on a vest, each electrodes contain a marker visible on computed tomography scan. Both exams are then combined and by resolution of the inverse problem processed to reconstruct a three-dimensional ventricular activation map.
ECGI maps are often reported as the reflection of epicardial activation. Indeed, unipolar chest electrodes used for the surface ECG and ECGI are mostly influenced by epicardial signals, as they are in closer proximity with the epicardial layers of the heart. However, the recorded signal is also composed by transmembrane potential differences in intramural and endocardial cardiac layers and therefore ECGI rather reflects a net activation of the cardiac wall.[10] The extent to which noncontact mapping represents local activation has been investigated by Thiagalingam, et al.[11] in murine ventricles. They compared a noncontact mapping system (EnSite) with a grid of 50−60 plunge needles, each holding four contact electrodes recording from the endocardium, two intramural sites, and the epicardium. Noncontact electrograms correlated equally well in morphology and timing across all layers confirming that noncontact electrograms are a composed signal rather than a local measurement.
Limitations
The ECGI system has been validated, both experimentally and in patients, under different physiological and pathological conditions, by comparison with direct epicardial mapping during open-heart surgery and with catheter intracardiac mapping.[9] However, a recent validation study showed poor overall agreement of ECGI activation mapping and contact mapping. Importantly, the between-map correlation was good for wide QRS patterns such as seen during asynchronous ventricular activation in CRT candidates.[12] ECGI technology is based on local ventricular activation, therefore electrically-inactive regions observed in patients with prior myocardial infarction can disturb the accuracy of the activation map. Moreover, widespread clinical application of these electrical mapping systems is currently limited, mostly because the existing techniques are costly, time-consuming and require prior radiation imaging.
Insight of Ventricular Activation
A major limitation of the 12-lead ECG is its inability to provide a precise pattern of regional electrical activity. ECGI reconstructs regional myocardial depolarization and allows to define the characteristics of biventricular activation. We previously described a characteristic sequence of activation in patients with LBBB compared with heterogeneous activation sequences in NIVCD patients.[13] In LBBB patients, the ventricular activation sequence is characterized by limited inter-individual variability, making the maps easily recognizable. We observed right ventricle (RV) breakthrough with rapid and centrifugal spread of activation across the RV free wall, followed by circumferential spreading toward the LV. ECGI can also be used to unravel the electro-pathophysiology of specific patient categories such as patients with LBBB and leftward heart axis or patients who receive right ventricular pacing. Recently, we showed in a more detailed ECGI mapping study of 16 patients with normal axis LBBB and 13 patients with left axis LBBB that the LV latest activated area is variable whether the axis on the 12-lead ECG is normal (mid lateral LV wall) or exhibits a left deviation (basal lateral LV wall) in Figure 2.[13,14] The anatomical position of the heart (on the CT scan) was comparable between the patient groups, and we also found no differences between ventricular volumes as seen on cardiac magnetic resonance imaging. This ECGI mapping study therefore showed that the heart axis is a purely electrical phenomenon. On the 12-lead ECG, LBBB and right ventricular apex pacing (RVAP) show very similar patterns. However, in an ECGI study with 24 HFrEF patients comparing ventricular activation patterns in LBBB and during RVAP, major differences were observed. Patients with RV pacing exhibit a characteristic activation with apical RV breakthrough followed by RV basal activation. The RV activation was significantly prolonged during RVAP versus LBBB. The site of earliest activation in the LV is consistently localized at the apex followed by an activation front proceeding from apex-to-base (Figure 3).[15]
For the purpose of patient’s selection, several dysynchrony parameters derived from the ECG maps were described and tested. The RV and LV total activation times (TAT) reflect intraventricular dyssynchrony of activation. The ventricular electrical uncoupling (VEU) calculated as the difference between the mean LV and RV activation times (in milliseconds) has been proposed as a marker of interventricular dyssynchrony. We later proposed the activation delay vector (ADV) which not only describes the amount but also the direction of dyssynchrony. These two latter indexes are insensitive to regional activation errors and very reproducible. The TAT (duration from the earliest RV or LV to the last biventricular activation on the epicardial surface) combines both the intraventricular and interventricular dyssynchrony and is correlated with the QRS duration.[13,16] In fact, in a bundle pacing versus conventional biventricular pacing (BVP) study, the greater reduction in QRS duration during bundle pacing was correlated with a greater reduction in left ventricular activation time and dyssynchrony index.[17]
Figure
2.
Three-dimensional activation map of LBBB.
Averaged activation map per segment of 16 patients with normal axis LBBB (left top panel) and of 13 left axis LBBB patients (left bottom panel). Three-dimensional activation maps of a typical normal axis LBBB (right top panel) and a left axis LBBB (right bottom panel). LBBB: left bundle branch block.
Figure
3.
Three-dimensional activation map of RVAP.
Averaged activation map per segment of 13 patients with RVAP (left panel). Three-dimensional activation maps of a RVAP (right panel). RVAP: right ventricular apex pacing.
IDENTIFYING THE ELECTRICAL SUBSTRATE RESPONSIVE TO CRT
Electrical Dyssynchrony is a Prerequisite for CRT Response
The LESSER-EARTH and ECHO-CRT trials conducted in patient with narrow QRS complexes, demonstrated that sufficient intrinsic ventricular electrical conduction delay needs to be present for CRT to improve cardiac pump function.[18,19] We have demonstrated that reducing ventricular activation time is an integral part of the mechanism through which CRT through BVP produces its beneficial effect. However, CRT does not fully reverse the conduction impairment, but interestingly induce a similar degree of electrical dyssynchrony independently of baseline electrical dyssynchrony. Therefore, hemodynamic response to CRT is highly contingent on the amount of baseline electrical dyssynchrony, and CRT may induce an iatrogenic dyssynchronopathy in patients with insufficient electrical dyssynchrony at baseline (Figure 4).[20]
Figure
4.
Schematic illustration displaying the effect of biventricular pacing on electrical dyssynchrony with regard to the level of intrinsic dyssynchrony during sinus rhythm.
In patients without or with little dyssynchrony (short total activation time) like in some nonspecific intraventricular conduction delay patient (as shown on the three-dimensional activation map on top left panel) biventricular pacing induces iatrogenic electropathy. In patients with high level of intrinsic dyssynchrony (high ventricular electrical uncoupling/activation delay vector)) as in typical left bundle branch block (as shown on the three-dimensional activation map on top right panel) hemodynamic response is expected with biventricular pacing.
Interventricular Dyssynchrony is the Key for Patient Selection
Currently, the amount of electrical dyssynchrony is estimated by using surface-ECG parameters such as QRS duration and morphology. This remains the parameter of choice in the 2021 European Society of Cardiology guidelines and has not changed since the previous guidelines in 2013. ECGI can more accurately predict hemodynamic and long-term clinical response to CRT through the identification of interventricular dyssynchrony. Ploux, et al.[13] have investigated the usefulness of ECGI for CRT response prediction in 33 consecutive CRT candidates, including 18 patients with LBBB and 15 patients with NIVCD. The area under the receiver-operating characteristic curve (AUC) indicated that the interventricular dyssynchrony index VEU (AUC = 0.88) was significantly superior to QRS duration (AUC = 0.73) and LV TAT (AUC = 0.72) for predicting CRT response (P < 0.05), whereas RV TAT was not predictive. With a 50-ms cutoff value, VEU identified CRT responders with 90% sensitivity and 82% specificity whether LBBB was present or not. Patients with a VEU above 50 ms had a 42-fold increase in the likelihood of being a responder (P < 0.001). A significant VEU was found in all LBBB patients, which may account for the high rate of response to CRT in this subgroup.
In a later study, we investigated the use of the ADV for guiding LV lead placement in 67 CRT candidates since it not only describes the amount (such as the VEU) but also the direction of dyssynchrony.[16] During intrinsic conduction, ADV direction was similar in patients with NIVCD and LBBB, pointing towards the LV free wall, while ADV magnitude was larger in LBBB (117 ± 25 ms) than in NIVCD (70 ± 29 ms, P < 0.05). Intrinsic ADV amplitude accurately predicted the acute (AUC = 0.93) and chronic (AUC = 0.90) response to CRT. However, the amount of change in ADV by CRT only moderately predicted response (highest AUC = 0.76). In addition, LV pacing site optimization had only limited effects on acute hemodynamics (3% ± 4% LVdP/dtmax when compared to conventional basolateral LV at pacing). We concluded that the baseline electrical substrate, adequately measured by ADV amplitude, strongly determines acute and chronic CRT response, while the extent of its modification by conventional CRT or by varying LV pacing sites had only limited effects.
These results suggest that it is the magnitude of right-to-left activation delay which separate responders from non-responders to CRT. This finding was later confirmed in a computer simulation study, using a cardiovascular computational model (CircAdapt) to characterize the isolated effect of intrinsic interventricular (VEU) and intraventricular activation (LV TAT and RV TAT) on CRT response. The study revealed that VEU is the dominant component of the electrical substrate driving the response to CRT independently of the LV TAT.[21] However, as explained before, ECGI maps reveal highly homogeneous patterns of activation in LBBB patients. Therefore, even if non-invasive cardiac mapping provides a more detailed depiction of the electrical substrate and helps in the understanding of the determinants of the CRT response, it would be difficult to demonstrate potential additional benefit from non-invasive mapping in LBBB patients. Conversely, there is evidence that a subset of patients with NIVCD may respond to treatment with CRT. LV activation times in NIVCD patients are generally shorter than those for patients with LBBB (Table 1) and the location of the region of the latest electrical activation is highly variable. However, some patients with NIVCD exhibit an LBBB-like ventricular activation (20% to 50%),[13,22] and a large VEU that can be identified with ECGI. Identification of significant VEU in patients who have prolonged QRS duration on surface ECG but do not display typical LBBB morphology may therefore be a promising strategy for the selection of potential non-LBBB patients who may benefit from CRT.
Interventricular Dyssynchrony in RVAP
Eschalier, et al.[15] performed a study comparing the ventricular activation pattern in LBBB and during RVAP in 24 patients. The VEU during RVAP was nearly half as during LBBB (Table 2). Moreover, BVP produces larger reductions in interventricular dyssynchrony relative to LBBB activation compared with those observed relative to RVAP. This is because BVP prolongs RV activation time in conjunction with a reduction in LV activation, which had the net effect of reducing the VEU. In comparison with RVAP, the main effect of BVP is reduction of the LV TAT because RV activation occurs via the RV pacing lead in both cases producing a smaller reduction in VEU. These findings, also reproduced in a separate invasive clinical study,[23] may explain why CRT appears to be more effective in patients with LBBB rather than in RV to biventricular upgraded patients (with high percentages of RV pacing). Therefore, there may also be a potential role for electrocardiographic mapping as a mean for screening chronically RV paced patients to identify individual patients who have prolonged VEU and who would likely benefit from CRT.
Table
1.
Comparison of main electrical parameters between left bundle branch block and nonspecific intraventricular conduction delay.
Parameters
Left bundle branch block (n = 18)
Right ventricular apex pacing (n = 15)
P-value
QRS duration, ms
164 ± 16
137 ± 20
< 0.001
Right ventricular total activation time, ms
62 ± 30
58 ± 26
0.7
Left ventricular total activation time, ms
115 ± 21
91 ± 34
0.03
Ventricular electrical uncoupling, ms
75 ± 12
40 ± 22
< 0.001
Data are presented as means ± SD. Based on the data from Ploux, et al.[13]
The ECG belt used for isochronal mapping is comprised of a 53-electrode body surface mapping system (adapted from Heartscape Technologies, Verathon, Seattle, WA, USA) with a multichannel amplifier and customized software to allow data recording. Dedicated software then transforms the multielectrode ECG data into color-coded isochronal maps presented in anterior and posterior views. Two metrics of electrical heterogeneity can be calculated: standard deviation of activation times from all electrodes, a global measure of electrical heterogeneity, and left thorax activation times, which averages the activation times of electrodes on both the anterior and posterior surfaces of the left thorax (left of sternum on the anterior and left of spine on the posterior surfaces). The ECG belt data are processed offline to generate electrical heterogeneity measures and color-coded isochronal maps. The major advantage of this system compared to ECGI is that a CT scan is not required. This facilitates the workflow and eliminates radiation but decreases the resolution and the accuracy since the patient-specific cardiothoracic anatomy is not integrated in the analysis. The diagnostic accuracy of the ECG belt to predict changes in LV end-systolic volume and LV ejection fraction after six months of CRT was tested in 66 CRT candidates.[24] No sensitivity or specificity analysis was reported but patients with standard deviation of activation times ≥ 35 ms had greater improvement in LV ejection fraction (13 ± 8 units vs. 4 ± 9 units, P < 0.001) and LV end-systolic volume (−34% ± 28% vs. −13% ± 29%, P = 0.005). A multicenter, prospective, randomized, investigational pre-market research study conducted at 48 centers in the United States, Canada, and Europe is in the process of randomizing approximately 400 subjects to test the hypothesis that in patients traditionally less likely to respond to CRT, an individualized approach utilizing the ECG belt to guide lead placement, vector selection, and device programming is superior to current standard of care.[25]
CONCLUSIONS
ECGI is an efficient tool in patient selection for CRT through identification of the interventricular electrical dyssynchrony which is the dominant driver of CRT response. The target population are patients with NIVCD and QRS duration > 130 ms. Future research needs to be conducted to explore the modulating effect of structural parameters such as fibrosis or cardiac contractility.
ACKNOWLEDGMENTS
This study was supported by the French Government as part of the “Investments of the Future” program managed by the National Research Agency (Grant reference: ANR-10-IAHU-04). All authors had no conflicts of interest to disclose.
Solomon SD, Foster E, Bourgoun M, et al. Effect of cardiac resynchronization therapy on reverse remodeling and relation to outcome: multicenter automatic defibrillator implantation trial: cardiac resynchronization therapy. Circulation 2010; 122: 985−992. doi: 10.1161/CIRCULATIONAHA.110.955039
[2]
Glikson M, Nielsen JC, Kronborg MB, et al. 2021 ESC guidelines on cardiac pacing and cardiac resynchronization therapy. Eur Heart J 2021; 42: 3427−3520. doi: 10.1093/eurheartj/ehab364
[3]
Strauss DG, Selvester RH, Wagner GS. Defining left bundle branch block in the era of cardiac resynchronization therapy. Am J Cardiol 2011; 107: 927−934. doi: 10.1016/j.amjcard.2010.11.010
[4]
Bertaglia E, Migliore F, Baritussio A, et al. Stricter criteria for left bundle branch block diagnosis do not improve response to CRT. Pacing Clin Electrophysiol 2017; 40: 850−856. doi: 10.1111/pace.13104
[5]
van Stipdonk AMW, Vanbelle S, Ter Horst IAH, et al. Large variability in clinical judgement and definitions of left bundle branch block to identify candidates for cardiac resynchronisation therapy. Int J Cardiol 2019; 286: 61−65. doi: 10.1016/j.ijcard.2019.01.051
[6]
Eschalier R, Ploux S, Ritter P, et al. Nonspecific intraventricular conduction delay: definitions, prognosis, and implications for cardiac resynchronization therapy. Heart Rhythm 2015; 12: 1071−1079. doi: 10.1016/j.hrthm.2015.01.023
[7]
Strik M, Ploux S, Jankelson L, et al. Non-invasive cardiac mapping for non-response in cardiac resynchronization therapy. Ann Med 2019; 51: 109−117. doi: 10.1080/07853890.2019.1616109
[8]
Strik M, Ploux S, Vernooy K, et al. Cardiac resynchronization therapy: refocus on the electrical substrate. Circ J 2011; 75: 1297−1304. doi: 10.1253/circj.CJ-11-0356
[9]
Jia P, Ramanathan C, Ghanem RN, et al. Electrocardiographic imaging of cardiac resynchronization therapy in heart failure: observation of variable electrophysiologic responses. Heart Rhythm 2006; 3: 296−310. doi: 10.1016/j.hrthm.2005.11.025
[10]
Kligfield P, Gettes LS, Bailey JJ, et al. Recommendations for the standardization and interpretation of the electrocardiogram: part I: the electrocardiogram and its technology: a scientific statement from the American Heart Association Electrocardiography and Arrhythmias Committee, Council on Clinical Cardiology; the American College of Cardiology Foundation; and the Heart Rhythm Society: endorsed by the International Society for Computerized Electrocardiology. Circulation 2007; 115: 1306−1324. doi: 10.1161/CIRCULATIONAHA.106.180200
[11]
Thiagalingam A, Wallace EM, Boyd AC, et al. Noncontact mapping of the left ventricle: insights from validation with transmural contact mapping. Pacing Clin Electrophysiol 2004; 27: 570−578. doi: 10.1111/j.1540-8159.2004.00489.x
[12]
Duchateau J, Sacher F, Pambrun T, et al. Performance and limitations of noninvasive cardiac activation mapping. Heart Rhythm 2019; 16: 435−442. doi: 10.1016/j.hrthm.2018.10.010
[13]
Ploux S, Lumens J, Whinnett Z, et al. Noninvasive electrocardiographic mapping to improve patient selection for cardiac resynchronization therapy: beyond QRS duration and left bundle branch block morphology. J Am Coll Cardiol 2013; 61: 2435−2443. doi: 10.1016/j.jacc.2013.01.093
[14]
Abu-Alrub S, Strik M, Huntjens P, et al. Left-axis deviation in patients with nonischemic heart failure and left bundle branch block is a purely electrical phenomenon. Heart Rhythm 2021; 18: 1352−1360. doi: 10.1016/j.hrthm.2021.03.042
[15]
Eschalier R, Ploux S, Lumens J, et al. Detailed analysis of ventricular activation sequences during right ventricular apical pacing and left bundle branch block and the potential implications for cardiac resynchronization therapy. Heart Rhythm 2015; 12: 137−143. doi: 10.1016/j.hrthm.2014.09.059
[16]
Strik M, Ploux S, Huntjens PR, et al. Response to cardiac resynchronization therapy is determined by intrinsic electrical substrate rather than by its modification. Int J Cardiol 2018; 270: 143−148. doi: 10.1016/j.ijcard.2018.06.005
[17]
Arnold AD, Shun-Shin MJ, Keene D, et al. His resynchronization versus biventricular pacing in patients with heart failure and left bundle branch block. J Am Coll Cardiol 2018; 72: 3112−3122. doi: 10.1016/j.jacc.2018.09.073
[18]
Thibault Bernard, Harel François, Ducharme Anique, et al. Cardiac resynchronization therapy in patients with heart failure and a QRS complex < 120 milliseconds: the Evaluation of Resynchronization Therapy for Heart Failure (LESSER-EARTH) trial. Circulation 2013; 127: 873−881. doi: 10.1161/CIRCULATIONAHA.112.001239
[19]
Ruschitzka F, Abraham WT, Singh JP, et al. Cardiac-resynchronization therapy in heart failure with a narrow QRS complex. N Engl J Med 2013; 369: 1395−1405. doi: 10.1056/NEJMoa1306687
[20]
Ploux S, Eschalier R, Whinnett ZI, et al. Electrical dyssynchrony induced by biventricular pacing: implications for patient selection and therapy improvement. Heart Rhythm 2015; 12: 782−791. doi: 10.1016/j.hrthm.2014.12.031
[21]
Huntjens PR, Ploux S, Strik M, et al. Electrical substrates driving response to cardiac resynchronization therapy: a combined clinical-computational evaluation. Circ Arrhythm Electrophysiol 2018; 11: e005647. doi: 10.1161/CIRCEP.117.005647
[22]
van Stipdonk AM, Rad MM, Luermans JG, et al. Identifying delayed left ventricular lateral wall activation in patients with non-specific intraventricular conduction delay using coronary venous electroanatomical mapping. Neth Heart J 2016; 24: 58−65. doi: 10.1007/s12471-015-0777-3
[23]
Mafi Rad M, Blaauw Y, Dinh T, et al. Different regions of latest electrical activation during left bundle-branch block and right ventricular pacing in cardiac resynchronization therapy patients determined by coronary venous electro-anatomic mapping. Eur J Heart Fail 2014; 16: 1214−1222. doi: 10.1002/ejhf.178
[24]
Gage RM, Curtin AE, Burns KV, et al. Changes in electrical dyssynchrony by body surface mapping predict left ventricular remodeling in patients with cardiac resynchronization therapy. Heart Rhythm 2017; 14: 392−399. doi: 10.1016/j.hrthm.2016.11.019
[25]
Rickard J, Jackson K, Biffi M, et al. The ECG belt for CRT response trial: design and clinical protocol. Pacing Clin Electrophysiol 2020; 43: 1063−1071. doi: 10.1111/pace.13985


 DownLoad:


